Download presentation
Presentation is loading. Please wait.

1
QOD Calculate how many liters of water are wasted in 1 month by a faucet that leaks 2 drops of water per second. (1 liter of water equals about 3500 drops) How many gallons is this? (1 liter equals 0.265 gallons)
 How many gallons is this. (1 liter equals gallons).")
2
Use Factor Label Method 2 drops x 60 sec x 60 min x 24 hour x 30 day = 1 sec1 min 1 hour 1 day 1 month _____ drops x 1 Liter = 1 month 3500 drops _____ Liters x 0.265 gallons = 1 month 1 Liter

3
Water Resources G. Tyler Miller’s Living in the Environment 13 th Edition Chapter 14 G. Tyler Miller’s Living in the Environment 13 th Edition Chapter 14

4
Water’s Unique Properties Hydrogen bonding Hydrogen bonding Major factor in determining water’s unique propertiesMajor factor in determining water’s unique properties strong molecular attractions known as hydrogen bonds between molecules

5
O HH ++ -- O HH ++ -- O HH ++ -- Hydrogen Bonds Covalent bonds

6
Water’s Unique Properties Liquid over wide temperature range Liquid over wide temperature range High boiling point 100°C (212°F)High boiling point 100°C (212°F) Low freezing point 0°C (32°F)Low freezing point 0°C (32°F) Changes temperature slowly, high heat capacity Changes temperature slowly, high heat capacity Helps protect organismsHelps protect organisms Moderates the earth’s climateModerates the earth’s climate Excellent coolantExcellent coolant High heat of evaporation High heat of evaporation Absorbs heat as it changes into water vaporAbsorbs heat as it changes into water vapor Releases heat as vapor condensesReleases heat as vapor condenses
High boiling point 100°C (212°F) Low freezing point 0°C (32°F)Low freezing point 0°C (32°F) Changes temperature slowly, high heat capacity Changes temperature slowly, high heat capacity Helps protect organismsHelps protect organisms Moderates the earth’s climateModerates the earth’s climate Excellent coolantExcellent coolant High heat of evaporation High heat of evaporation Absorbs heat as it changes into water vaporAbsorbs heat as it changes into water vapor Releases heat as vapor condensesReleases heat as vapor condenses")
7
Water’s Unique Properties Great dissolving power, Universal Solvent Great dissolving power, Universal Solvent Carries dissolved nutrients into tissueCarries dissolved nutrients into tissue Flush waste products out of tissueFlush waste products out of tissue All-purpose cleanserAll-purpose cleanser Remove and dilute water-soluble wastesRemove and dilute water-soluble wastes Balances pH Balances pH Helps maintain balance between acids and bases by ionizing (releasing H+ or OH- ions)Helps maintain balance between acids and bases by ionizing (releasing H+ or OH- ions) Adhesion and cohesion Adhesion and cohesion Surface tensionSurface tension Wetting abilityWetting ability Expands when it freezes Expands when it freezes Ice floats – less dense in solid formIce floats – less dense in solid form
Helps maintain balance between acids and bases by ionizing (releasing H+ or OH- ions) Adhesion and cohesion Adhesion and cohesion Surface tensionSurface tension Wetting abilityWetting ability Expands when it freezes Expands when it freezes Ice floats – less dense in solid formIce floats – less dense in solid form")
8
Water: A Vital Resource Oceans and saline lakes 97.4% Fresh Water 2.6%

9
Supply of Water Resources Freshwater Readily accessible freshwater Biota 0.0001% Biota 0.0001% Rivers 0.0001% Rivers 0.0001% Atmospheric water vapor 0.001% Atmospheric water vapor 0.001% Lakes 0.007% Soil moisture 0.005% Groundwater 0.592% Groundwater 0.592% Ice caps and glaciers 0.1.984% 0.014%

10
Sources of Surface Water Surface runoffSurface runoff –Water flowing off the land into bodies of water –One-third of world’s annual runoff –Represents a stable source of water Watershed (Drainage Basin)Watershed (Drainage Basin) –Region from which water drains Cape Fear
Watershed (Drainage Basin) –Region from which water drains Cape Fear")
11
Sources of Groundwater

12
Evaporation and transpiration Evaporation Stream Infiltration Water table Infiltration Unconfined aquifer Confined aquifer Lake Well requiring a pump Flowing artesian well Runoff Precipitation Confined Recharge Area Aquifer Less permeable material such as clay Confirming permeable rock layer Ground Water Resources Fig. 14-3 p. 315 Unconfined Aquifer Recharge Area

13
Use of Water Resources AgricultureAgriculture IndustryIndustry DomesticDomestic Power PlantsPower Plants Humans use about 50% of runoff United States Industry 11% Public 10% Powercooling38% Agriculture41%

14
5,500 5,000 4,500 4,000 3,500 3,000 2,500 2,000 1,500 1,000 500 190019201940196019802000 Water use (cubic kilometers per year) Total use Agricultural use Industrial use Domestic use Year
 Total use Agricultural use Industrial use Domestic use Year")
15
Water in the United States Average precipitation (top) in relation to water-deficit regions andAverage precipitation (top) in relation to water-deficit regions and their proximity to metropolitan areas (bottom). their proximity to metropolitan areas (bottom).
..")
16
Too Little Water – Shortages 1)Dry climate Air circulation patternsAir circulation patterns 2)Drought 21 days+21 days+ Precipitation <70%Precipitation <70% Increased evaporationIncreased evaporation 3)Desiccation Drying of the soilDrying of the soil 4)Water stress Low per capita availabilityLow per capita availability Caused by increased populationCaused by increased population Limited runoff levelsLimited runoff levels Acute shortage Adequate supply Shortage Metropolitan regions with population greater than 1 million
Dry climate Air circulation patternsAir circulation patterns 2)Drought 21 days+21 days+ Precipitation <70%Precipitation <70% Increased evaporationIncreased evaporation 3)Desiccation Drying of the soilDrying of the soil 4)Water stress Low per capita availabilityLow per capita availability Caused by increased populationCaused by increased population Limited runoff levelsLimited runoff levels Acute shortage Adequate supply Shortage Metropolitan regions with population greater than 1 million")
17
Water stressed – reliable runoff per person below 1700 cu meters per year Water scarcity – per capita availability below 1000 cu meter per year 500 million people live in countries that are either water stressed or water scarce limited access (live far away from source) limited access (live far away from source) arrives during short periods (monsoon season) arrives during short periods (monsoon season) hydrological poverty hydrological poverty –Collect water from unsafe sources –Purchase from private vendor
 limited access (live far away from source) arrives during short periods (monsoon season) arrives during short periods (monsoon season) hydrological poverty hydrological poverty –Collect water from unsafe sources –Purchase from private vendor")
18
Ways to Increase Fresh Water Supplies 1.Build dams and reservoirs to store runoff 2.Bring surface water from another area - termed water diversion 3.Withdraw groundwater from aquifers 4.Convert salt water to fresh water - termed desalination - termed desalination 5. Waste less water - conservation 6. Import food to reduce water use

19
1. Using Dams and Reservoirs to Supply More Water (To Dam or Not To Dam)
")
20
Fig. 14-13a, p. 317 Provides water for year-round irrigation of cropland Flooded land destroys forests or cropland and displaces people Large losses of water through evaporation Provides water for drinking Downstream cropland and estuaries are deprived of nutrient-rich silt Reservoir is useful for recreation and fishing Risk of failure and devastating downstream flooding Can produce cheap electricity (hydropower) Downstream flooding is reduced Migration and spawning of some fish are disrupted
 Downstream flooding is reduced Migration and spawning of some fish are disrupted.")
21
Deliver nutrients to the sea which helps to sustain coastal fisheries Deliver nutrients to the sea which helps to sustain coastal fisheries Deposit silt that maintains deltas Deposit silt that maintains deltas Purify water Purify water Renew and nourish wetlands Renew and nourish wetlands Provide habitats for aquatic life Provide habitats for aquatic life Conserve species diversity Conserve species diversity Ecological Services of Rivers.. not dams

22
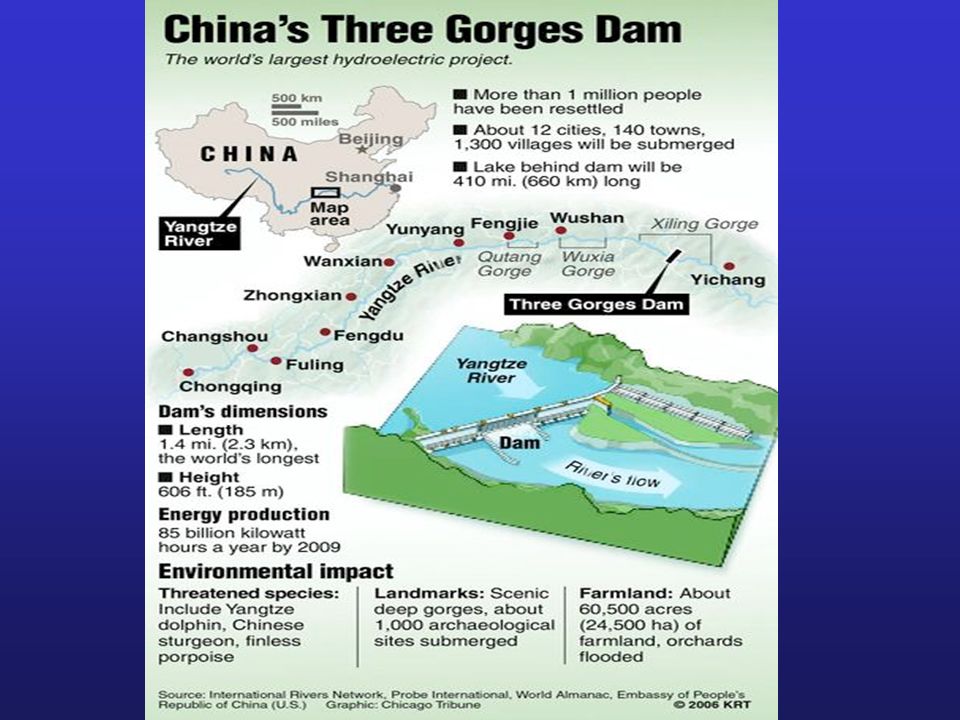
RUSSIA MONGOLIA CHINA NEPAL BHUTAN INDIA BANGLADESH BURMA LAOS VIETNAM PACIFIC OCEAN Beijing CHINA Jailing River Chongquing Yichang Wunan Yangtze River Shanghai YELLOW SEA EAST CHINA SEA Three Gorges Dam Reservoir China’s Three Gorges Dam

23
before after

25
The Colorado River Basin Lake Powell, is the second largest reservoir in the U.S.Lake Powell, is the second largest reservoir in the U.S. It hosts one of the hydroelectric plants located on the Colorado River.It hosts one of the hydroelectric plants located on the Colorado River. Water Diversion and Extraction is problematic for downstream usersWater Diversion and Extraction is problematic for downstream users

26
Dam Aqueduct or canal Upper Basin Lower Basin IDAHO WYOMING UTAH Salt Lake City Las Vegas CALIFORNIA Boulder City Los Angeles Palm Springs San Diego Mexicali Yuma Phoenix Tucson LOWER BASIN ARIZONA Grand Canyon UPPER BASIN Grand Junction Denver COLORADO NEW MEXICO Albuquerque MEXICO Lake Powell Glen Canyon Dam All-American Canal Gulf of California 0 0 100 mi. 150 km The Colorado River Basin Multiple dams AqueductsCanals Mono Lake http://www.monolake.org/ about/story

27
#2 - Diversion: Transferring Water from One Place to Another North Bay Aqueduct North Bay Aqueduct South Bay Aqueduct South Bay Aqueduct California Aqueduct CALIFORNIA NEVADA UTAH MEXICO Central Arizona Project Colorado River Aqueduct Los Angeles Aqueduct Shasta Lake Sacramento Fresno Phoenix Tucson ARIZONA Colorado River Sacramento River Sacramento River San Francisco Los Angeles San Diego Watershed transfer California Water Project California Water Project Central Arizona Project Central Arizona Project James Bay (Canada) James Bay (Canada) Mono Lake, CA Mono Lake, CA
 James Bay (Canada) Mono Lake, CA Mono Lake, CA")
28
Case Study: Owens Lake EX. Owens Lake diversion to Owens Valley Aqueduct Los Angeles http://en.wikipedia.org/wiki/Owens_Lake http://www.ovcweb.org/OwensValley/OwensLake.html

29
#3. Extracting Groundwater AdvantagesAdvantages –Year-round use –No evaporation losses –Often less expensive Potential Problems!Potential Problems!

30
Problems with Using Groundwater 1)Water Table Lowering Initial water table Cone of depression Original water table Lowered water table
Water Table Lowering Initial water table Cone of depression Original water table Lowered water table")
31
Problems with Using Groundwater 2)Aquifer depletion Ogallala AquiferOgallala Aquifer WYOMINGSOUTH DAKOTA NEBRASKA COLORADO KANSAS OKLAHOMA NEW MEXICO TEXAS 0100 Miles Kilometers Less than 61 meters (200 ft) 61-183 meters (200-600 ft) More than 183 meters (600 ft) (as much as 370 meters or 1,200 ft. in places) 0160
")
32
Problems with Using Groundwater 3)Subsidence –Sinking of land when groundwater is withdrawn
Subsidence –Sinking of land when groundwater is withdrawn")
33
Other Effects of Groundwater Extraction Sinkholes form when the roof of an underground cavern collapses after being drained of groundwater.Sinkholes form when the roof of an underground cavern collapses after being drained of groundwater.

34
Problems with Using Groundwater 4) Saltwater intrusion near coastal areas Major irrigation well Well contaminated with saltwater Saltwater Intrusion Normal Interface Fresh groundwater aquifer Interface Salt water Sea Level Water table
 Saltwater intrusion near coastal areas Major irrigation well Well contaminated with saltwater Saltwater Intrusion Normal Interface Fresh groundwater aquifer Interface Salt water Sea Level Water table")
35
Fig. 14-11, p. 315 Major irrigation well Well contaminated with saltwater Water table Fresh groundwater aquifer Sea level Saltwater Interface Seafloor Saltwater intrusion Interface Normal interface

36
Problems with Using Groundwater Tragedy of the CommonsTragedy of the Commons

37
#4. Converting Salt Water to Fresh Water – HOW? Desalination – removing dissolved salts from ocean water or brackish water.Desalination – removing dissolved salts from ocean water or brackish water. –Distillation desalination Heating salt water until water evaporates, leaves salt behind.Heating salt water until water evaporates, leaves salt behind. –Reverse osmosis desalination Salt water is pumped at high pressure across a thin membrane to collect saltSalt water is pumped at high pressure across a thin membrane to collect salt

38
#4. Converting Salt Water to Fresh Water - Effects Desalination – removing dissolved salts from ocean water or brackish water.Desalination – removing dissolved salts from ocean water or brackish water. –Desalination is very expensive Larger amounts of energy and capital neededLarger amounts of energy and capital needed –Desalination produces large quantities of wastewater and waste salt waste disposal problem – landfill??waste disposal problem – landfill??

39
#5. Making it Rain Cloud SeedingCloud Seeding –Water condensation nuclei –Silver iodide particles Limited SuccessLimited Success –Not useful in dry areas --- DUH! –Potential pollution from cloud seeding chemicals (AgI) –Legal disputes: ownership of clouds
 –Legal disputes: ownership of clouds.")
41
#6. Using Water More Efficiently Reduce losses due to leakageReduce losses due to leakage –60 to75% of water people use is lost! Reduce mindless wasteReduce mindless waste –Water subsidy policy Artificially low cost of waterArtificially low cost of water False sense of abundanceFalse sense of abundance

42
#6. Using Water More Efficiently Causes of waste cont.Causes of waste cont. –Water laws Doctrine of riparian rights (East)Doctrine of riparian rights (East) –Anyone owning land adjoining stream has right to water Principle of prior appropriation (West)Principle of prior appropriation (West) –First-come, first-served Common law governs groundwaterCommon law governs groundwater –Subsurface water belongs to whomever owns the land above it – Fragmented watershed management
Doctrine of riparian rights (East) –Anyone owning land adjoining stream has right to water Principle of prior appropriation (West)Principle of prior appropriation (West) –First-come, first-served Common law governs groundwaterCommon law governs groundwater –Subsurface water belongs to whomever owns the land above it – Fragmented watershed management.")
43
What Can You Do? Water Use and Waste Use water-saving toilets, showerheads, and faucet aerators. Shower instead of taking baths, and take short showers. Stop water leaks. Turn off sink faucets while brushing teeth, shaving, or washing. Flush toilets only when necessary. Wash only full loads of clothes or use the lowest water-level for smaller loads. Use recycled (gray) water for lawn, gardens, house plants, car washing. Wash a car from a bucket of soapy water, and use the hose for rinsing only. If you use a commercial car wash, try to find one that recycles its water. Replace your lawn with native plants that need little if any watering and decorative gravel or rocks. Water lawns and gardens in the early morning or evening. Sweep or blow off driveways instead of hosing off with water. Use drip irrigation and mulch for gardens and flowerbeds.
 water for lawn, gardens, house plants, car washing. Wash a car from a bucket of soapy water, and use the hose for rinsing only. If you use a commercial car wash, try to find one that recycles its water. Replace your lawn with native plants that need little if any watering and decorative gravel or rocks. Water lawns and gardens in the early morning or evening. Sweep or blow off driveways instead of hosing off with water. Use drip irrigation and mulch for gardens and flowerbeds..")
44
Fig. 14-18, p. 325 Center pivot Drip irrigation Gravity flow (efficiency 60% and 80% with surge valves) Above- or below- ground pipes or tubes deliver water to individual plant roots. Water usually comes from an aqueduct system or a nearby river. (efficiency 90–95%) (efficiency 80%–95%) Water usually pumped from underground and sprayed from mobile boom with sprinklers.
 Above- or below- ground pipes or tubes deliver water to individual plant roots. Water usually comes from an aqueduct system or a nearby river. (efficiency 90–95%) (efficiency 80%–95%) Water usually pumped from underground and sprayed from mobile boom with sprinklers..")
45
Too Much Water: Floods Natural phenomena heavy rain, melting snow Natural phenomena heavy rain, melting snow Floodplain Levee Flood wall Dam Reservoir Renew and replenish Aggravated by human activities

Similar presentations


 Polar covalent molecule 2) High heat capacity (good coolant – helps to moderate climate) 3) Universal solvent.>")


>")