Download presentation
Presentation is loading. Please wait.

1
Goal #2 LIMIT INFLATION

2
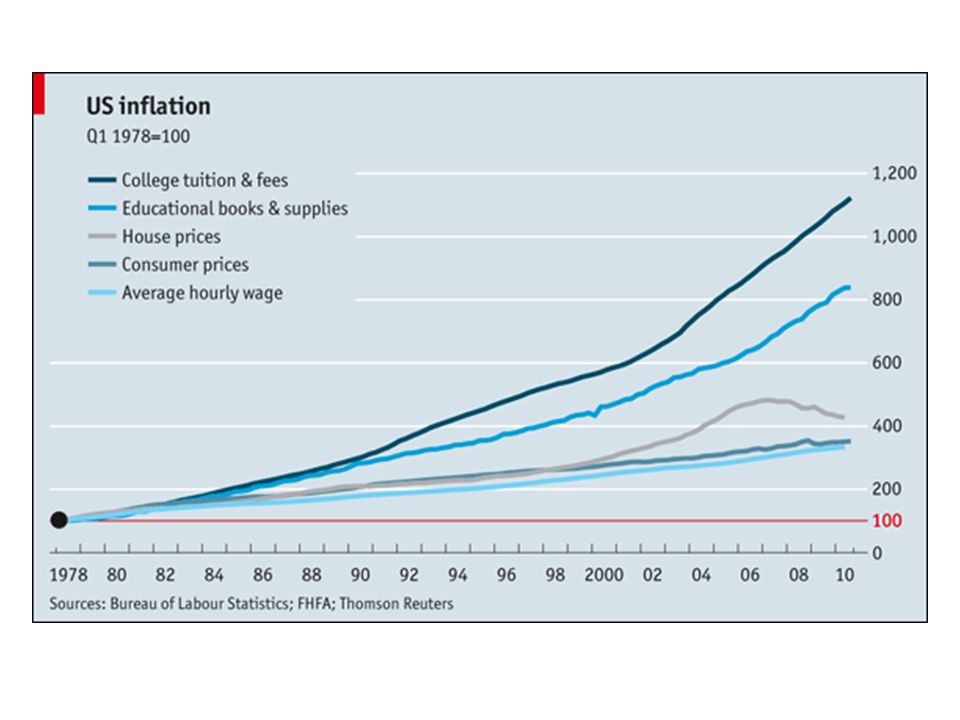
What is Inflation? Inflation: a rise in the average level of prices Inflation reduces the purchasing power of money Examples: It takes $2 to buy what $1 bought in 1982 It takes $6 to buy what $1 bought in 1961

3
Consumer Price Index (CPI) and GDP Deflator Measuring Inflation
 and GDP Deflator Measuring Inflation")
4
CPI Calculation 1. Government adds up prices of a “market basket” made up of ~300 commonly purchased goods 2. Compares basket price from year to year 3. Inflation Rate = % change in prices between two years

5
= Price of market basket in base year x 100 CPI Price of market basket Consumer Price Index (CPI) The U.S. Government’s Inflation Statistic How it works: Base year given index of 100 Year being compared also given an index # 1997 Market Basket: Movie is $8 & Pizza is $12 Total = $20 (Index of Base Year = 100) 2015 Market Basket: Movie is $10 & Pizza is $15 Total = $25 (Index of ) 125 This means inflation increased 25% b/w ’97 & ’15 Items that cost $100 in ’97 cost $125 in ‘15
 2015 Market Basket: Movie is $10 & Pizza is $15 Total = $25 (Index of ) 125 This means inflation increased 25% b/w ’97 & ’15 Items that cost $100 in ’97 cost $125 in ‘15.")
6
Problems with CPI 1.Substitution Bias – As prices increase for goods in “market basket,” consumers may switch to cheaper substitutes outside of basket. (Result: CPI overestimates what consumers are really paying) 2.New Products – CPI basket may not include newest consumer products. (Result: CPI measures prices but not increase in choices) 3.Product Quality – CPI ignores changes in product quality. (Result: CPI assumes that the quality of items in the m
 2.New Products – CPI basket may not include newest consumer products. (Result: CPI measures prices but not increase in choices) 3.Product Quality – CPI ignores changes in product quality. (Result: CPI assumes that the quality of items in the m.")
7
7 GDP Deflator Real GDP Growth Rate Nominal GDP Growth Rate ≈ – GDP Deflator Growth Rate The GDP deflator, like CPI, is a measure of the average price level Key difference: GDP deflator includes producer prices as well as consumer prices GDP deflator is used to calculate real GDP growth

8
World Inflation Rates

9
9

11
Inflation: Friend or Foe?

12
Borrowers –e.g. fixed-rate mortgage holders, –e.g. the Federal Government Lenders People with fixed incomes Savers Hurt by Inflation Helped by Inflation

13
Who is helped/hurt by inflation? 1.A man who lent his friend $500 in 1960 and is still waiting to be repaid 2.A tenant who pays a fixed $850/mo. rent 3.An elderly couple living off fixed retirement payments of $2,000 a month 4.A woman who borrowed $1,000 from a friend in 1995 and paid it back, without interest, last week 5.A man who saves money by putting it under his mattress

14
14 Expected and Unexpected Inflation All countries experience some degree of inflation over time Because inflation is so widespread, people expect that it will occur, and adjust their actions accordingly The expectation of inflation plays an important role in the interest rate – the price of borrowing money

15
15 Expected and Unexpected Inflation Imagine a world without inflation, where $100 today can buy you the exact same basket of goods and services 1 year from now Suppose the interest rate in this world is 3% Now imagine that – for some reason – both lenders and borrowers suddenly expect that prices will increase by 3% over the next year Will lenders still be willing to accept 3% interest on loans?

16
16 Nominal vs. Real Interest Rates The nominal interest rate is simply the raw, unadjusted interest rate e.g. 4% interest on $100 is $4 The real interest rate is the nominal interest rate adjusted for inflation e.g. If prices rose by 4% over the term of the loan above, the purchasing power gained by the lender is 0 Real Interest Rate Nominal Interest Rate ≈ – Inflation Rate

17
Causes of Inflation

18
1. Central Bank Expansion of the Money Supply Causes of Inflation Governments – via the central bank – are constantly expanding the money supply Gov’ts that abuse this and expand the money supply too fast end up with hyperinflation Examples: Zimbabwe, Argentina, Germany after WWI

19
19 Warm Up In base year 2013, the GDP deflator was 100 and nominal GDP was $100 billion. In 2014, nominal GDP was $104 billion and the GDP deflator was 102. The real GDP growth rate between 2013 and 2014 was roughly _____%. A banks lends money to a borrower at 3% annual interest. Over the period of the loan, the price level increases by 5%. What is the real interest rate?

20
20

21
Quantity Theory of Money Suppose the amount of money in circulation is $100 Billion, but GDP is $400 Billion. How is this possible? Answer: each dollar gets spent four times Velocity of money = # of times the average dollar changes hands each year (as part of a GDP-included transaction) 21
 21.")
22
22 Quantity Theory of Money Equation: M x V = P x Y M = money supply P = price level V = velocity Y = real GDP

23
M x V = P x Y In the short run, velocity (V) and output (Y) are relatively stable If the central bank doubles the money supply (M), what will happen to the price level (P)? 23 Why does printing money lead to inflation?

24
24 Assume a simple economy in which there is only one product produced and sold: Reese’s Peanut Butter Cups Each cup is sold for $1 The supply of money in Reesestan is $5 billion There are 10 billion cups sold this year What is the velocity of money? If velocity and output stay the same, what will happen if money supply quadruples to $20 Billion? Reesestan

25
25

26
26

27
27 National Debt Clock

28
What would happen if the government printed money to pay off the national debt all at once?

29
2. COST-PUSH INFLATION Rising input costs decrease output, raise prices Example: In 1970s, OPEC imposed oil embargo on U.S. => increased costs for virtually all producers => raised prices Causes of Inflation M x V = P x Y ↑ ↓

30
Goal #3 Limit Unemployment 30

31
% of people in the labor force who want a job but don’t have one. Who is in the labor force? >16 years old Able and willing to work Not in jail or psychiatric hospital Not in military, in school full time, or retired Unemployment rate # unemployed # in labor force x 100 = 31 The Unemployment Rate

32
#1. Frictional Unemployment You’reFired! 32 3 Types of Unemployment Unemployment due to people transitioning between jobs Examples: Recent graduates looking for jobs People fired for poor performance People who quit their jobs

33
Seasonal Unemployment Those unemployed solely due to time of year Examples: Professional Santa Claus Impersonators Tax preparers Lifeguards 33 3 Types of Unemployment

34
#2. Structural Unemployment Changes in the economy make certain jobs obsolete Examples: Switchboard operators Bowling pinsetters 34 3 Types of Unemployment

35
Technological Unemployment Type of structural unemployment where automation and machinery replace workers Examples: Robots replace auto workers Self-Checkout replaces cashiers 35 3 Types of Unemployment

36
#3 Cyclical Unemployment 36 Unemployment that results from economic downturns (recession and depression) As demand for goods and services falls, demand for labor falls and workers are laid off. Example: Unemployment reached 25% during Great Depression Unemployment reached 10% during 2007-2009 recession

37
Frictional and Structural unemployment are unavoidable Together they make up the natural rate of unemployment (NRU). Usually around 4-6% If cyclical unemployment is 0, economy is at full employment The Natural Rate of Unemployment 37

38
US Unemployment Rate (2005 to 2015)
")
39
US Unemployment Rate (1948 to 2014)
")
40
In some European countries, it’s 8-10% Why? Generous unemployment benefits discourage people from “settling” for just any job The Natural Rate of Unemployment

41
“Discouraged” job seekers If not actively looking, not counted in labor force Part-Time (Underemployed) Workers Counted as employed, even if they want to be working more Illegal Workers Not counted at all! Problems with the Unemployment Rate 41

Similar presentations


 increase.>")


 CPI reports inflation each month and year Reports the price of a basket of.>")

