Download presentation
Presentation is loading. Please wait.

1
Back to the Future GDP, Unemployment, etc.

2
Inflation Ever see stories like this? Clip
But what does it all mean? Feb 15, air date

3
What does this tell you? Figure The Price Level versus the Inflation Rate, 1969–2009 Ray and Anderson: Krugman’s Macroeconomics for AP, First Edition Copyright © 2011 by Worth Publishers

4
Annual Inflation Rate- Time for Prices to Double-
Goal #3 LIMIT INFLATION Country and Time- Zimbabwe, 2008 Annual Inflation Rate- 79,600,000,000% Time for Prices to Double- 24.7 hours Clip sample Historical context[edit] On 18 April 1980, the Republic of Zimbabwe was born from the former British colony of Southern Rhodesia. The Rhodesian Dollar was replaced by the Zimbabwe dollar at par value. When Zimbabwe gained independence, the Zimbabwean dollar was more valuable than the US dollar.[3] In its early years, Zimbabwe experienced strong growth and development. Wheat production for non-drought years was proportionally higher than in the past. The tobacco industry was thriving as well. Economic indicators for the country were strong. From 1991–1996, the Zimbabwean Zanu-PF government of president Robert Mugabe embarked on an Economic Structural Adjustment Programme (ESAP), designed by the IMFand the World Bank, that had serious negative effects on Zimbabwe's economy. In the late 1990s, the government instituted land reforms intended to redistribute land from white landowners to black farmers to correct the 'injustices of colonialism'. However, many of these farmers had no experience or training in farming.[citation needed] From 1999 to 2009, the country experienced a sharp drop in food production and in all other sectors. The banking sector also collapsed, with farmers unable to obtain loans for capital development. Food output capacity fell 45%, manufacturing output 29% in 2005, 26% in 2006 and 28% in 2007, and unemployment rose to 80%.[4] Life expectancy dropped.[5] The government blames most of Zimbabwe's economic woes on economic sanctions imposed by the United States of America and the European Union.[6] These sanctions affect the government of Zimbabwe,[7] and asset freezes and visa denials targeted at 200 specific Zimbabweans closely tied to the Mugabe regime.[8] There are also restrictions placed on trade with Zimbabwe, by both individual businesses and the US Treasury Department's Office of Foreign Asset Control.[9] Causes[edit] The largest denomination of a Zimbabwean banknote (100 trillion) A monetarist view[10] is that a general increase in the prices of things is less a commentary on the worth of those things than on the worth of the money. This has objective and subjective components: Objectively, that the money has no firm basis to give it a value. Subjectively, that the people holding the money lack confidence in its ability to retain its value. Crucial to both components is discipline over the creation of additional money. However, the Mugabe government was printing money to finance involvement in the Democratic Republic of the Congo and, in 2000, in the Second Congo War, including higher salaries for army and government officials. Zimbabwe was under-reporting its war spending to the International Monetary Fund by perhaps $22 million a month.[11] Another motive for excessive money creation has been self-dealing. Transparency International ranks Zimbabwe's government 134th of 176 in terms of institutionalised corruption.[12] The resulting lack of confidence in government undermines confidence in the future and faith in the currency. Economic mis-steps by government can create shortages and occupy people with workarounds rather than productivity. Though this harms the economy, it does not necessarily undermine the value of the currency, but may harm confidence in the future. Widespread poverty and violence, including government violence to stifle political opposition, also undermines confidence in the future.[13] Land reform lowered agricultural output, especially in tobacco, which accounted for one-third of Zimbabwe's foreign-exchange earnings. Manufacturing and mining also declined. An objective reason was, again, that farms were put in the hands of inexperienced people; and subjectively, that the move undermined the security of property. Government instability and civic unrest were evident in other areas.[14] Zimbabwean troops, trained by North Korean soldiers, conducted a massacre in the 1980s in the southern provinces of Matabeleland and Midlands, though Mugabe's government cites guerrilla attacks on civilian and state targets. Conflicts between the Ndebele ethnic minority and Mugabe's majority Shona people have led to many clashes,[15] and there is also unrest between blacks and whites, in which the land reform was a factor. An aspect of this reform that seeks to bar whites from business ownership induced many to leave the country.[16] Self-perpetuationLack of confidence in government to practice fiscal restraint feeds on itself. In Zimbabwe, neither the issuance of banknotes of higher denominations nor proclamation of new currency regimes led holders of the currency to expect that the new money would be more stable than the old. Remedies announced by the government never included a believable basis for monetary stability.[17][18] Thus, one reason the currency continued to lose value, causing hyperinflation, is that so many people expected it to.[19]
, designed by the IMFand the World Bank, that had serious negative effects on Zimbabwe s economy. In the late 1990s, the government instituted land reforms intended to redistribute land from white landowners to black farmers to correct the injustices of colonialism . However, many of these farmers had no experience or training in farming.[citation needed] From 1999 to 2009, the country experienced a sharp drop in food production and in all other sectors. The banking sector also collapsed, with farmers unable to obtain loans for capital development. Food output capacity fell 45%, manufacturing output 29% in 2005, 26% in 2006 and 28% in 2007, and unemployment rose to 80%.[4] Life expectancy dropped.[5] The government blames most of Zimbabwe s economic woes on economic sanctions imposed by the United States of America and the European Union.[6] These sanctions affect the government of Zimbabwe,[7] and asset freezes and visa denials targeted at 200 specific Zimbabweans closely tied to the Mugabe regime.[8] There are also restrictions placed on trade with Zimbabwe, by both individual businesses and the US Treasury Department s Office of Foreign Asset Control.[9] Causes[edit] The largest denomination of a Zimbabwean banknote (100 trillion) A monetarist view[10] is that a general increase in the prices of things is less a commentary on the worth of those things than on the worth of the money. This has objective and subjective components: Objectively, that the money has no firm basis to give it a value. Subjectively, that the people holding the money lack confidence in its ability to retain its value. Crucial to both components is discipline over the creation of additional money. However, the Mugabe government was printing money to finance involvement in the Democratic Republic of the Congo and, in 2000, in the Second Congo War, including higher salaries for army and government officials. Zimbabwe was under-reporting its war spending to the International Monetary Fund by perhaps $22 million a month.[11] Another motive for excessive money creation has been self-dealing. Transparency International ranks Zimbabwe s government 134th of 176 in terms of institutionalised corruption.[12] The resulting lack of confidence in government undermines confidence in the future and faith in the currency. Economic mis-steps by government can create shortages and occupy people with workarounds rather than productivity. Though this harms the economy, it does not necessarily undermine the value of the currency, but may harm confidence in the future. Widespread poverty and violence, including government violence to stifle political opposition, also undermines confidence in the future.[13] Land reform lowered agricultural output, especially in tobacco, which accounted for one-third of Zimbabwe s foreign-exchange earnings. Manufacturing and mining also declined. An objective reason was, again, that farms were put in the hands of inexperienced people; and subjectively, that the move undermined the security of property. Government instability and civic unrest were evident in other areas.[14] Zimbabwean troops, trained by North Korean soldiers, conducted a massacre in the 1980s in the southern provinces of Matabeleland and Midlands, though Mugabe s government cites guerrilla attacks on civilian and state targets. Conflicts between the Ndebele ethnic minority and Mugabe s majority Shona people have led to many clashes,[15] and there is also unrest between blacks and whites, in which the land reform was a factor. An aspect of this reform that seeks to bar whites from business ownership induced many to leave the country.[16] Self-perpetuationLack of confidence in government to practice fiscal restraint feeds on itself. In Zimbabwe, neither the issuance of banknotes of higher denominations nor proclamation of new currency regimes led holders of the currency to expect that the new money would be more stable than the old. Remedies announced by the government never included a believable basis for monetary stability.[17][18] Thus, one reason the currency continued to lose value, causing hyperinflation, is that so many people expected it to.[19]")
5
What is Inflation? Inflation is rising general level of prices
Inflation reduces the “purchasing power” of money Examples: It takes $2 to buy what $1 bought in 1982 It takes $6 to buy what $1 bought in 1961 When inflation occurs, each dollar of income will buy fewer goods than before.

6
How is Inflation measured?
The government tracks the prices of the same goods and services each year. This “market basket” is made up of about 300 commonly purchased goods The Inflation Rate-% change in prices in 1 year They also compare changes in prices to a given base year (usually 1982) Prices of subsequent years are then expressed as a percentage of the base year Examples: 2005 inflation rate was 3.4% U.S. prices have increase 98.3% since 1982 (base year). The inflation rate in Bolivia in 1985 was 50,000% This is called Hyperinflation A $25 meal today would cost $12,525 a year later
 Prices of subsequent years are then expressed as a percentage of the base year. Examples: 2005 inflation rate was 3.4% U.S. prices have increase 98.3% since 1982 (base year). The inflation rate in Bolivia in 1985 was 50,000% This is called Hyperinflation. A $25 meal today would cost $12,525 a year later.")
7
World Inflation Rates

8
Go to table 24– 2014 around 2%; from 1982 prices are up approx 230%

10
Current Data

11
Is Inflation Good or Bad?

12
Identify which people are helped and which are hurt by unanticipated inflation?
A man who lent out $500 to his friend in 1960 and is still waiting to be paid back. A tenant who is charged $850 rent each year. An elderly couple living off fixed retirement payments of $2000 a month A man that borrowed $1,000 in 1995 and paid it back in 2006 A women who saved a paycheck from 1950 by putting it under her mattress hurt—worth less Helped– fixed price money worth less Hurt– doesn’t go as far Helped-worth less Hurt---worth less

13
Make a T-Chart Hurt by Inflation Helped by Inflation
Lenders-People who lend money (at fixed interest rates) People with fixed incomes Savers Borrowers-People who borrow money A business where the price of the product increases faster than the price of resources Cost-of-Living-Adjustment (COLA) Some works have salaries that mirror inflation. They negotiated wages that rise with inflation
 People with fixed incomes. Savers. Borrowers-People who borrow money. A business where the price of the product increases faster than the price of resources. Cost-of-Living-Adjustment (COLA) Some works have salaries that mirror inflation. They negotiated wages that rise with inflation.")
14
Interest Rates

15
Interest Rates and Inflation
What are interest rates? Why do lenders charge them? Who is willing to lend me $100 if I will pay a total interest rate of 100%? (I plan to pay you back in 2050) If the nominal interest rate is 10% and the inflation rate is 15%, how much is the REAL interest rate? Real Interest Rates- The percentage increase in purchasing power that a borrower pays. (adjusted for inflation) Real = nominal interest rate - expected inflation Nominal Interest Rates- the percentage increase in money that the borrower pays not adjusting for inflation. Nominal = Real interest rate + expected inflation
 If the nominal interest rate is 10% and the inflation rate is 15%, how much is the REAL interest rate Real Interest Rates- The percentage increase in purchasing power that a borrower pays. (adjusted for inflation) Real = nominal interest rate - expected inflation. Nominal Interest Rates- the percentage increase in money that the borrower pays not adjusting for inflation. Nominal = Real interest rate + expected inflation.")
16
Nominal vs. Real Interest Rates
Suppose you lend a buddy $100 and he promises to pay you back in a year. You both agree the inflation rate next year will be 5% and you agree that your lending services are worth another 3%. You charge your friend: 8%= 3%+5% Nom.= real + inflation rate Scenario #1 You expected 5% inflation and you experienced exactly 5% inflation. The purchasing power of the $100 you lent him was unchanged as you were paid back enough to compensate for inflation

17
Nominal vs. Real Interest Rates
Suppose you lend a buddy $100 and he promises to pay you back in a year. You both agree the inflation rate next year will be 5% and you agree that your lending services are worth another 3%. You charge your friend: 8%= 3%+5% Nom.= real + inflation rate Scenario #2 You expected 5% inflation and you experienced only 1% inflation. Your purchasing power has actually increased because your friend paid you back more than enough to compensate for the inflation. You (the lender) gain
 gain.")
18
Nominal vs. Real Interest Rates
Suppose you lend a buddy $100 and he promises to pay you back in a year. You both agree the inflation rate next year will be 5% and you agree that your lending services are worth another 3%. You charge your friend: 8%= 3%+5% Nom.= real + inflation rate Scenario #3 You expected 5% inflation and you experienced 8%. Your purchasing power has decreased because your friend paid you back less than enough to compensate for inflation. You lose.

19
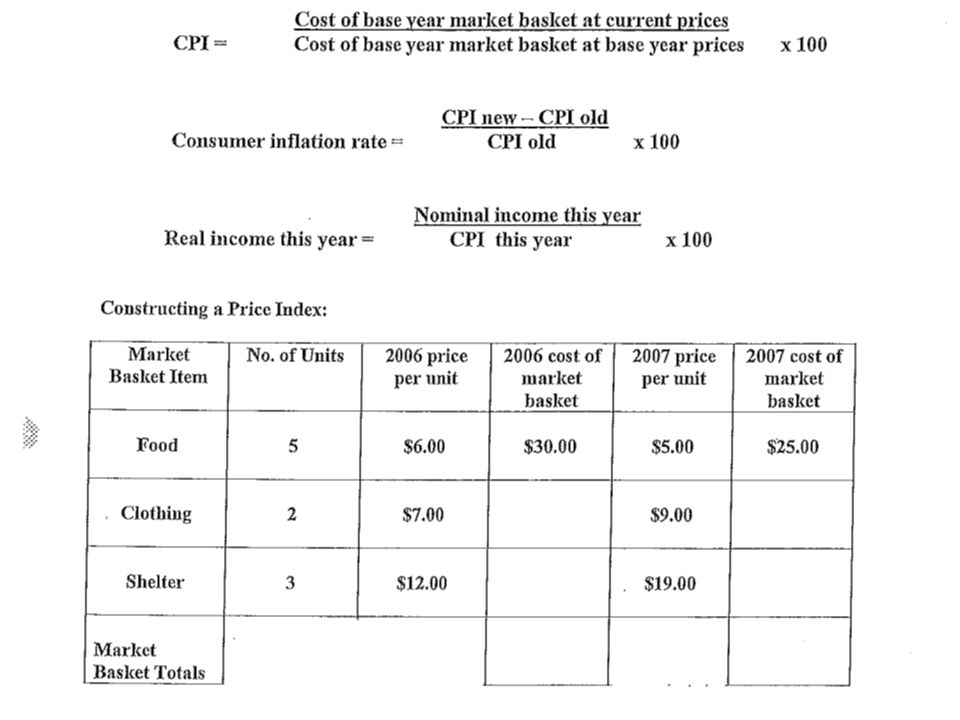
Consumer Price Index (CPI)
Measuring Inflation Consumer Price Index (CPI)
")
20
Consumer Price Index (CPI)
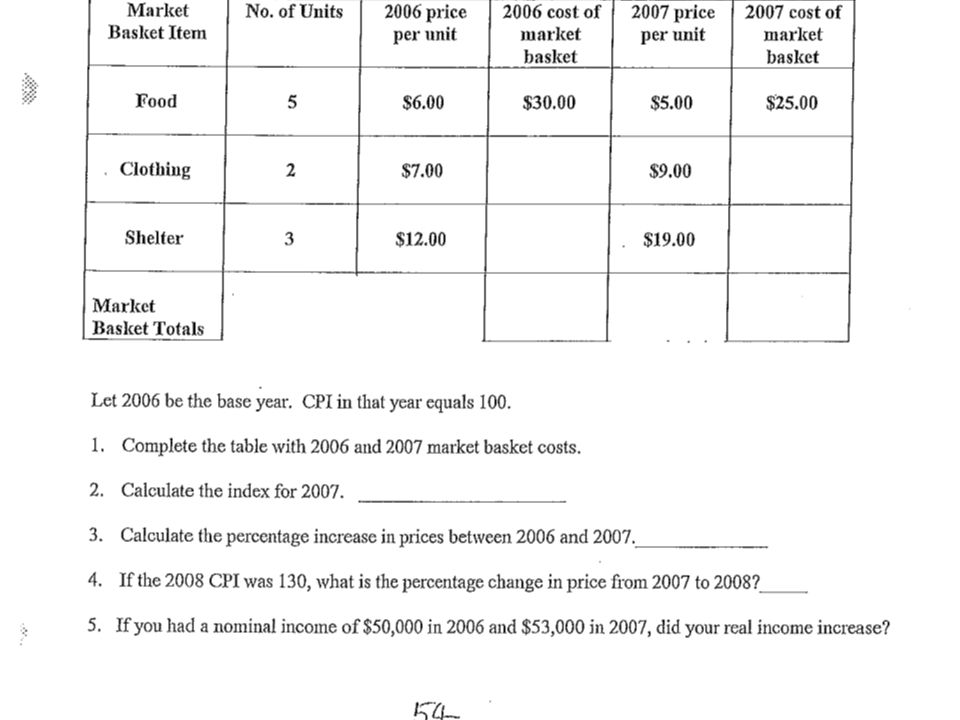
The most commonly used measurement inflation for consumers is the Consumer Price Index Here is how it works: The base year is given an index of 100 To compare, each year is given an index # as well = Price of market basket in base year x 100 CPI Price of market basket Market Basket: Movie is $6 & Pizza is $14 Total = $20 (Index of Base Year = 100) Market Basket: Movie is $8 & Pizza is $17 Total = $25 (Index of ) 125 This means inflation increased 25% b/w ’97 & ‘09 Items that cost $100 in ’97 cost $125 in ‘09
 2009 Market Basket: Movie is $8 & Pizza is $17. Total = $25 (Index of ) 125. This means inflation increased 25% b/w ’97 & ‘09. Items that cost $100 in ’97 cost $125 in ‘09.")
22
Problems with the CPI Substitution Bias- As prices increase for the fixed market basket, consumers buy less of these products and more substitutes that may not be part of the market basket. (Result: CPI may be higher than what consumers are really paying) New Products- The CPI market basket may not include the newest consumer products. (Result: CPI measures prices but not the increase in choices) Product Quality- The CPI ignores both improvements and decline in product quality. (Result: CPI may suggest that prices stay the same though the economic well being has improved significantly)
 New Products- The CPI market basket may not include the newest consumer products. (Result: CPI measures prices but not the increase in choices) Product Quality- The CPI ignores both improvements and decline in product quality. (Result: CPI may suggest that prices stay the same though the economic well being has improved significantly)")
23
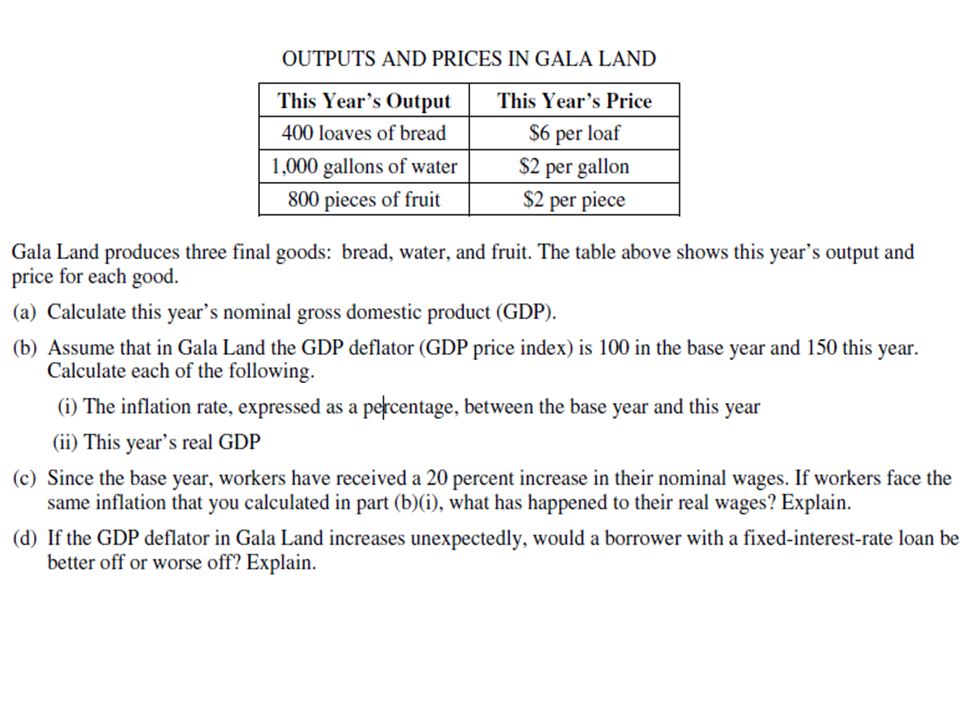
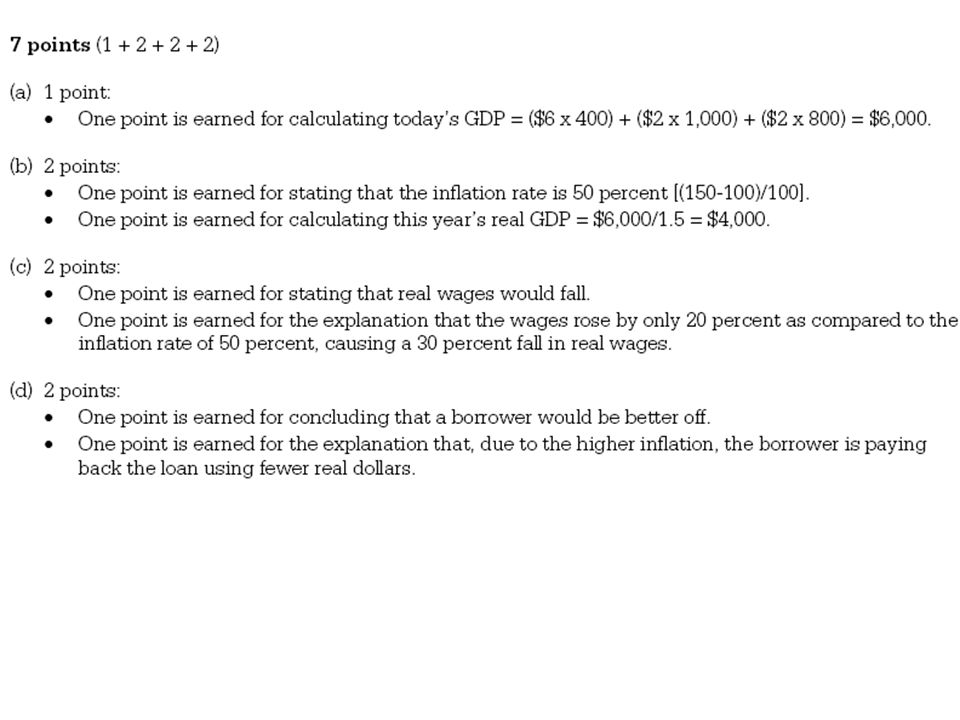
Calculating Nominal GDP, Real GDP, and Inflation

24
CPI vs. GDP Deflator The GDP deflator measures the prices of all goods produced, whereas the CPI measures prices of only the goods and services bought by consumers. An increase in the price of goods bought by firms or the government will show up in the GDP deflator but not in the CPI. The GDP deflator includes only those goods and services produced domestically. Imported goods are not a part of GDP and therefore don’t show up in the GDP deflator. = Real GDP x 100 GDP Deflator Nominal GDP If the nominal GDP in ’09 was 25 and the real GDP (compared to a base year) was 20 how much is the GDP Deflator?
 was 20 how much is the GDP Deflator")
25
Calculating GDP Deflator
= Real GDP x 100 GDP Deflator Nominal GDP = 100 Nominal GDP (Deflator) x (Real GDP)
 x (Real GDP)")
26
Calculations In an economy, Real GDP (base year = 1996) is $100 billion and the Nominal GDP is $150 billion. Calculate the GDP deflator. In an economy, Real GDP (base year = 1996) is $125 billion and the Nominal GDP is $150 billion. Calculate the GDP deflator. In an economy, Real GDP for year 2002 (base year = 1996) is $200 billion and the GDP deflator 2002 (base year = 1996) is Calculate the Nominal GDP for 2002. In an economy, Nominal GDP for year 2005 (base year = 1996) is $60 billion and the GDP deflator 2005 (base year = 1996) is 120. Calculate the Real GDP for 2005. GDP deflator=150 GDP deflator=120 Nominal GDP=$240 billion Real GDP=$50
 is $125 billion and the Nominal GDP is $150 billion. Calculate the GDP deflator. In an economy, Real GDP for year 2002 (base year = 1996) is $200 billion and the GDP deflator 2002 (base year = 1996) is 120. Calculate the Nominal GDP for In an economy, Nominal GDP for year 2005 (base year = 1996) is $60 billion and the GDP deflator 2005 (base year = 1996) is 120. Calculate the Real GDP for GDP deflator=150. GDP deflator=120. Nominal GDP=$240 billion. Real GDP=$50.")
33
Three Causes of Inflation

34
3 Causes of Inflation 1. The Government Prints TOO MUCH Money (The Quantity Theory) Governments that keep printing money to pay debts end up with hyperinflation. There are more “rich” people but the same amount of products. Result: Banks refuse to lend and GDP falls

35
Quantity Theory of Money
If the real GDP in a year is $400 billion but the amount of money in the economy is only $100 billion, how are we paying for things? The velocity of money is the average times a dollar is spent and re-spent in a year. How much is the velocity of money in the above example? Quanity Theory of Money Equation: M x V = P x Y M = money supply P = price level V = velocity Y = quantity of output Notice that P x Y is GDP 35

36
M x V = P x Y Why does printing money lead to inflation?
Assume the velocity is relatively constant because people's spending habits are not quick to change. Also assume that output (Y) is not affected by the amount of money because it is based on production, not the value of the stuff produced. If the govenment increases the amount of money (M) what will happen to prices (P)? Ex: Assume money supply is $5 and it is being used to buy 10 products with a price of $2 each. 1. How much is the velocity of money? 2. If the velocity and output stay the same, what will happen if the amount of money is increase to $10? Notice, doubling the money supply doubles prices 36
 is not affected by the amount of money because it is based on production, not the value of the stuff produced. If the govenment increases the amount of money (M) what will happen to prices (P) Ex: Assume money supply is $5 and it is being used to buy 10 products with a price of $2 each. 1. How much is the velocity of money 2. If the velocity and output stay the same, what will happen if the amount of money is increase to $10 Notice, doubling the money supply doubles prices. 36.")
37
What would happen if the government printed money to pay off the national debt all at once?

38
3 Causes of Inflation 2. DEMAND-PULL INFLATION
“Too many dollars chasing too few goods” DEMAND PULLS UP PRICES!!! Demand increases but supply stays the same. What is the result? A Shortage driving prices up An overheated economy with excessive spending but same amount of goods.

39
Higher production costs increase prices
3 Causes of Inflation 3. COST-PUSH INFLATION Higher production costs increase prices A negative supply shock increases the costs of production and forces producers to increase prices. Examples: Hurricane Katrina destroyed oil refineries and causes gas prices to go up. Companies that use gas increase their prices.

41
Cost-Push Inflation

42
The Wage-Price Spiral A Perpetual Process: 1.Workers demand raises
2.Owners increase prices to pay for raises 3. High prices cause workers to demand higher raises 4. Owners increase prices to pay for higher raises 5. High prices cause workers to demand higher raises 6. Owners increase prices to pay for higher raises

43
Does that mean deflation is good?

44
Figure The Cost of Disinflation Ray and Anderson: Krugman’s Macroeconomics for AP, First Edition Copyright © 2011 by Worth Publishers

45
Cartoon Video: Why Play Leap Frog?
45

Similar presentations


 TOPIC 2.>")


