Download presentation
Presentation is loading. Please wait.

1
Research methods and statistics An introduction lihong.huang@nova.no

2
Why do we need a course in Research methods in the syllabus of a Master’s study? You are going to do a small scale research work for your Master’s thesis. A course in Research Methods shall provide you with some tools for this work. As a Master, in Higher Education or in Comparative and International Education, you are supposed to be a qualified reader of research literature, you should be able: 1. to make scientifically sound interpretations of results from educational research, 2. to evaluate the validity of inferences drawn from such research.

3
Two compulsory papers: One paper will primarily deal with matters of theory of science. A short summary of your understanding of the subject. 2-4 pages are enough. This paper is ‘home work’ you should work on during the course, and it should be handed in before Friday February 1. The second paper deals primarily with solution of statistical problems, as statistics is the main topic in this first course. You are work out this paper individually, in a computer room here in Helga Engs hus, at the scheduled time on Thursday February 7. You will be allowed to use any kind of aids, your books, your notes, the computer or your teacher. The two papers will be evaluated together. Results of Pass/Fail will be disseminated and discussed on Friday February 15. If any of you failed any of the two or both papers, you will have to re-write.

4
Part I: What is this thing called science The book is mostly a discussion both of scientific method and of the problem of justifying scientific knowledge and theory change. an introduction of philosophy of science

5
‘Commonsense’ view of science Science is derived from the facts On an empiricist/positivist view, three components of the statement on the facts assumed to be the basis of science: 1.Facts are directly presented to the senses 2.Facts are prior to and independent of theory 3.Facts constitute a firm and reliable foundation for scientific knowledge. Let’s dismantle them one by one

6
Is it really possible to be a really unprejudiced observer? Two persons looking at the same object, do they see the same image? Will they make the same perception of the object they have observed? page 6 Figure 1 the stairs, two way to look it, and Africa tribe people to look at it Page 8 the X-ray picture example, the experienced and skilled observer and the untrained novice. Perceptions are influenced by the background and expectations of the observer, what appears to be an observable fact for one need not be for another.

7
Are facts prior to and independent of theory? Darwin would not have made any significant contribution to science if he had not formulated statements describing what he saw and made those statements available to other scientists. Before an observer can formulate and assent to an observation statement, he or she must be in possession of the appropriate conceptual framework and a knowledge of how to appropriately apply it. (when a child learned to describe what they see) The truth of observation statements depend on what already known or assumed
 The truth of observation statements depend on what already known or assumed.")
8
Do facts really constitute a firm and reliable foundation for scientific knowledge? The fallibility of observation statement If the knowledge that provides the categories we use to describe our observations is defective, the observation statements that presuppose those categories are similarly defective. (e.g. Aristotle ‘fire is a distinctive substance’ took hundreds of years to be found defective) The scientific revolution involved not just a progressive transformation of scientific theory, but also a transformation in what were considered to be the observable facts. (e.g. the earth is stationary)
 The scientific revolution involved not just a progressive transformation of scientific theory, but also a transformation in what were considered to be the observable facts. (e.g. the earth is stationary).")
9
Observation as practical intervention Observations suitable for constituting a basis for scientific knowledge are both objective and fallible An observation statement constitutes a fact worthy of forming part of the basis for science if it is such that it can be straightforwardly tested by the senses and withstands those tests. If a statement qualifies as an observable fact because it has passed all the tests that can be levelled at it hitherto, this does not mean that it will necessarily survive new kinds of tests that become possible in the light of advances in knowledge and technology.

10
Experiment Experimental results are by no means straightforwardly given. Nor are judgments about the adequacy of experimental results straightforward. Experimental facts and theory are interrelated, experimental results can be faulty if the knowledge informing them is deficient or faulty. In fact, the acceptability of scientific experiments is also theory-dependent. Judgments of the acceptability of experimental results are subject to change as our scientific understanding develops.

12
Logical methods of inference Induction: deriving theories from the facts, typically associated with a qualitative research approach Deduction: departure from theories to predictions and explanations, typically associated with a quantitative research approach. Abduction: a method of reasoning in which one chooses the hypothesis that would, if true, best explain the relevant evidence. Abductive reasoning starts from a set of accepted facts and infers to their most likely, or best, explanations. The term abduction is also sometimes used to just mean the generation of hypotheses to explain observations or conclusions

13
About methods of inference In the social sciences, none of these logical methods and inference can give us any guarantee of a true conclusion. Whether we make inferences by deduction, induction or abduction, there is a need of empirical testing of our inferences. As a consequence, neither the deductive method nor the inductive method is sufficient for scientific work. What we can do?

14
We need to substitute them with some variant of the hypothetico-deductive method, which combines induction (abduction) with deduction and empirical ‘testing’ of hypotheses. We have to confront our theories with empirical data, without automatically given any of them superiority. We need rational and empirical evidence. However, it is now generally accepted that all observation is theory laden, that all observation is influenced by our expectations. Hence, it is impossible to get a completely independent test of our theories by means of empirical data. On the other hand, we cannot just leave off critical testing of our hypotheses and theories just because we do not have a completely reliable criterion. Common sense will recommend us to make the best of a difficult situation and perform at least a partial test of our hypotheses and theories if we are not able to perform a perfect test of them.

15
The three main theories of truth The correspondence theory of truth: a knowledge claim is true if it corresponds to a world of empirical reality. As Chalmer’s formulations: 1.A statement is true if and only if it corresponds to the facts 2.A statement is true if things are as the statement says they are and false otherwise, The coherence theory of truth: a knowledge claim is true if it belongs to a coherent set of claims, more roughly said, if it corresponds to our former knowledge. The pragmatic theory of truth: a knowledge claim is true if it is useful to believe that claim.

16
Problems with theories of truth Correspondence theory is compromised because the data to which a knowledge claim may be compared, are themselves theory laden as cannot provide a theory-free test of the claim. (observation is not independent of theory as Hanson’s thesis) The problem with coherence theory is that coherent stories (stories which are coherent with each other) need not bear any exact relationship to the world A problem with the pragmatic theory of truth is that a belief obviously can be true without being useful. To make the best of the situation, Validity theories based on a critical realistic view make some use of each of the three theories of truth. If follows from the idea of ontological realism that the correspondence theory is important. However, the limited possibilities of independent observation of this reality makes it necessary to rely, at least partially, on the two other theories too.
 The problem with coherence theory is that coherent stories (stories which are coherent with each other) need not bear any exact relationship to the world A problem with the pragmatic theory of truth is that a belief obviously can be true without being useful. To make the best of the situation, Validity theories based on a critical realistic view make some use of each of the three theories of truth. If follows from the idea of ontological realism that the correspondence theory is important. However, the limited possibilities of independent observation of this reality makes it necessary to rely, at least partially, on the two other theories too..")
17
Epistemology and ontology There are different epistemological and ontological standpoints underlying quantitative and qualitative methods. Ontology: philosophy of the nature of reality. Ontological questions concern the kinds of things there are in the world. Epistemology: philosophy of the justifications for knowledge claims. Epistemological questions concern how scientific knowledge is vindicated by appear to evidence and the nature of that evidence.

18
Epistemological consideration Central issue: whether the social world can and should be studied according to the same principles, procedures and ethos as the natural sciences. Positivism: affirms the importance of imitating the nature science, but stretches beyond this principle. Realism: science describes not just the observable world but also the world that lies behind the appearances (two major forms: empirical realism and critical realism) Interpretivism: (against the positivism) the subject matter of the social sciences – people and their institutions – is fundamentally different from that the nature sciences. The study of the social world therefore requires a different logic of research procedure, one that reflects the distinctiveness of humans as against the natural order.
 Interpretivism: (against the positivism) the subject matter of the social sciences – people and their institutions – is fundamentally different from that the nature sciences. The study of the social world therefore requires a different logic of research procedure, one that reflects the distinctiveness of humans as against the natural order..")
19
Ontological considerations Central issue: whether social entities can and should be considered objective entities that have a reality external to social actors, or whether they can and should be considered social constructions built up from the perceptions and actions of social actors. Objectivism: (about organisation), social phenomena confront us as external facts that are beyond our reach or influence (existence independent of social actors. Constructionism: (about culture), social phenomena and their meanings are continually being accomplished by social actors. It implies that social phenomena and categories are not only produced through social interaction but that they are in a constant state of revision.
, social phenomena confront us as external facts that are beyond our reach or influence (existence independent of social actors. Constructionism: (about culture), social phenomena and their meanings are continually being accomplished by social actors. It implies that social phenomena and categories are not only produced through social interaction but that they are in a constant state of revision..")
20
A rough classification of researchers The constructionists, who will deny the existence of an external reality outside people’s mind, the ontological relativism, and hence will be epistemological relativists too. Naïve empiricists, who try to limit the scientific world to what could be observed directly, and hence of course see no problems in directly observing what they find interesting The critical realists (ontological realism and weak epistemological relativism), our knowledge and theories are not completely relative in the sense that it is impossible to argue on a rational basis that some theories are better than others. Researchers have to provide evidence for their theories, and one theory may have stronger support from evidence than another theory has. However, our scientific knowledge is influenced both by the ontological world and by the world of ideology, interests, values, hopes and wishes too.
, our knowledge and theories are not completely relative in the sense that it is impossible to argue on a rational basis that some theories are better than others. Researchers have to provide evidence for their theories, and one theory may have stronger support from evidence than another theory has. However, our scientific knowledge is influenced both by the ontological world and by the world of ideology, interests, values, hopes and wishes too..")
21
Qualitative vs Quantitative methods What are the fundamental differences between Qualitiative and Quantitative methods? Are there any fundamental differences between these two methods? What are the similarities?

22
Three different view points 1.They belong to different traditions of philosophy of science (different worlds) and can not or should not be combined (Bryman chapter 1 and 2) 2.They are based on different philosophical ways of thinking, but they can supplement on another – that is called triangulation (Bryman Chapter 21 and 22) 3.They have different strengths and weaknesses, but they are not as fundamentally different as they often are presented in the literature or in the education research institutions.
 and can not or should not be combined (Bryman chapter 1 and 2) 2.They are based on different philosophical ways of thinking, but they can supplement on another – that is called triangulation (Bryman Chapter 21 and 22) 3.They have different strengths and weaknesses, but they are not as fundamentally different as they often are presented in the literature or in the education research institutions.")
23
Strengths and weaknesses Qualitative methods have particular advantages in: exploratory studies or hypothesis generating studies Holistic analyses of single cases or in depth observation in small groups But: It is practically difficult to conduct qualitative research in large samples Difficult to generalize the research results

24
Strengths and weaknesses Quantitative research has strengths in Finding general trends and patterns in certain populations Finding relationships between different factors, and testing hypothesis But: Often missing details of the mechanisms in human relations Difficult to answer the question ‘how’ and ‘why’

26
Part II: Validity of inferences Jan 15 kl. 9-11 U35

27
The definition of validity Validity refers to the accuracy of measure. It is the extent to which a measuring instrument actually measures the underlying concept it is suppose to measure.

28
It refers to the extent of matching congruence or ‘goodness of fit’ between an operational definition and the concept it is purported to measure. An instrument is said to be valid if it taps the concept it is suppose to measure. It is designed to answer the question-is it true

29
Assessing the validity of a measure Content validity/ Face validity Criterion-related validity

30
Content validity/ Face validity This is the extent to which a measuring instrument reflects a specific domain of content. It can also be viewed as the sampling adequacy of the content of a phenomena being measured. This type of validity is often used in the assessment of various educational and psychological tests Content validation then, is essentially judgmental.

31
Problem with content validity Specifying the full domain of content relevant to a particular measurement situation No agreed upon criterion for determining content validity

32
Criterion-related validity This is at issue when the purpose is to use an instrument to estimate some important form of behaviour that is external to the measuring instrument itself, the latter being referred to as the criterion. A test used to select students for special programs of study in high school is valid only to the extent that it actually predicts performance in those programs. Two types of criterion-related validity: concurrent validity and predictive validity

33
Concurrent validity Refers to the ability of a measure to accurately predict the current situation or status of an individual. Where the instrument being assessed is compared to some already existing criterion, such as the results of another measurement device.

34
Predictive validity This is where an instrument is used to predict some future state of affairs. An example here is the various educational tests used for selection purposes in different occupations and schools, like TOEFL, GRE, etc. If people who score high on TOEFL or GRE do better in college than low-scorers, then the TOEFL or GRE is presumably a valid measure of scholastic aptitude.

35
Problems with Criterion- related validity From the definition of criterion-related validity, it can be inferred that the degree of criterion-related validity depends on the extent of the correspondence between the test and the criterion. Most measures in the social sciences have no well delimited relevant criterion variables against which measures can be reasonably evaluated.

36
Validity: a property of inferences… From indicators to constructs (from what we have seen to what we call what we have seen): Construct validity (or measurement validity) From an observed covariation to a causal interpretation (to the interpretation that something is an effect of another thing): Internal validity From the context of the study to a wider context or to other contexts: External validity The applicability of research findings to people’s everyday, natural social settings: Ecological validity (or conclusion validity)
: Construct validity (or measurement validity) From an observed covariation to a causal interpretation (to the interpretation that something is an effect of another thing): Internal validity From the context of the study to a wider context or to other contexts: External validity The applicability of research findings to people’s everyday, natural social settings: Ecological validity (or conclusion validity)")
37
It seems validity is mostly a issue for quantitative rather than qualitative research. Some qualitative researchers argue that validity is not a relevant concept in qualitative research. If we accept that validity is a property of inferences or conclusions, a consequence will be that the relevance of validity does not depend on what kind of methods that have been used to collect or analyse the data, it depends on what kind of inferences that are drawn in and from the research. Validity and research strategy

38
XY XY

39
As long as qualitative researchers do not make inferences of the kinds illustrated in the figure, they may argue that construct validity, internal validity and external validity are irrelevant. If they make such inferences, these inferences should be valid regardless of what kind of date they are based on. However, the validation of procedure will be somewhat different depending on the nature of the data.

40
Validity is a property of inferences, not a property of methods or tests or design – statements from others We use the term validity to refer to the approximate truth of an inference. (Shadish, Cook and Campbell 2002) Validity is not a property of the test or assessment as such, but rather of the meaning of the test scores. (Messick 1996) What needs to be valid is the meaning or interpretation of the score, as well as any implications for action that this meaning entails. (Cronbach 1971) Data in themselves cannot be valid or invalid, what is at issue are the inferences drawn from them. (Hammersley and Atkinson 1983) In its broadest sense, validity refers to the degree to which the research conclusions are sound. (Durrhem 1999) Validity is concerned with the integrity of the conclusions that are generated from a piece of research. (Bryman 2001)
 Validity is not a property of the test or assessment as such, but rather of the meaning of the test scores. (Messick 1996) What needs to be valid is the meaning or interpretation of the score, as well as any implications for action that this meaning entails. (Cronbach 1971) Data in themselves cannot be valid or invalid, what is at issue are the inferences drawn from them. (Hammersley and Atkinson 1983) In its broadest sense, validity refers to the degree to which the research conclusions are sound. (Durrhem 1999) Validity is concerned with the integrity of the conclusions that are generated from a piece of research. (Bryman 2001).")
41
The reliability – validity relationship An instrument that is valid is always reliable An instrument that is not valid may or may not be reliable An instrument that is reliable may or may not be valid An instrument that is not reliable is never valid Reliability is a necessary, but not sufficient, condition for good measurement

42
Methods of data collection See (observe) 1.Structured observation (see Bryman, chapter 8) 2.Unstructured observation (free) 3.Participant observation, in Bryman chapter 14 participant observation is discussed within an ethnographic context, practical and fundamental ethical issues are discussed.
 1.Structured observation (see Bryman, chapter 8) 2.Unstructured observation (free) 3.Participant observation, in Bryman chapter 14 participant observation is discussed within an ethnographic context, practical and fundamental ethical issues are discussed.")
43
Ask 1.Structured-unstructured 2.Written-orally 3.Directly-indirectly In Bryman, Chapter 5 deals with a lot of practical and fundamental issues concerning planning and conducting of structured interview. Chapter 6 starts with a brief discussion of advantages and disadvantages of questionnaires and compared to structured interview. The chapter deals with a lot of practical and fundamental issues about designing of questionnaires. Chapter 7 goes in some detail about how to ask questions, in a structured interview as well as in a questionnaire. Chapter 15 deals with practical and fundamental issues concerning developing interview guides and conducting interviews

45
Part III: Variables and Measurement January 17, 09:15-14:00Audi.2

46
Can internal human qualities be measured? For example, intelligence, motivation, attitudes... “a social scientist trying to capture the shape or size of abstract concepts is like a seamstress trying to measure an invisible, intangible piece of cloth” (Hoyle, Harris & Judd: Research Methods in Social Relations). The task, as a matter of fact, impossible. However, if we want to do empirical research, we have to ‘measure’ or ‘operationalize’ constructs which are not directly measurable. We can avoid expressing the results by means of numbers, but what we can not avoid, is the main measurement problem of selecting visible indicators to represent the invisible abstract concept of interest.
. The task, as a matter of fact, impossible. However, if we want to do empirical research, we have to ‘measure’ or ‘operationalize’ constructs which are not directly measurable. We can avoid expressing the results by means of numbers, but what we can not avoid, is the main measurement problem of selecting visible indicators to represent the invisible abstract concept of interest..")
47
The basic terms A variable is an attribute that has two or more divisions, characteristics or categories. The bulk of statistical analysis attempts to understand whether (and why) a variable takes on certain traits for some cases and different traits for other cases. (then we have to measure...) Measurement is the process of determining and recording which of the possible traits of a variable an individual case exhibits or possesses. Case: a case is an entity that displays or possesses the traits of a given variable. (and individual person, an community, an city, an nation) The extent to which we are able to take measurements of a variable from all the cases of interest will determine whether we are dealing with a population or a sample. A population is the set of all cases of interest. A sample is a set of cases that does not include every member of the population.
 a variable takes on certain traits for some cases and different traits for other cases. (then we have to measure...) Measurement is the process of determining and recording which of the possible traits of a variable an individual case exhibits or possesses. Case: a case is an entity that displays or possesses the traits of a given variable. (and individual person, an community, an city, an nation) The extent to which we are able to take measurements of a variable from all the cases of interest will determine whether we are dealing with a population or a sample. A population is the set of all cases of interest. A sample is a set of cases that does not include every member of the population..")
48
The conceptualization of variables The choice of variables to investigate is affected by a number of complex factors. 1.Theoretical framework: without a theory to order our perception of the world, research will often become a jumble of observations that do not tie together in a meaningful way. We should acknowledge the theoretical preconceptions upon which the choice to variables to investigate is often based. 2.Pre-specified research agenda: sometimes the research question and the variables to be investigated are not determined by the researcher themselves. (e.g. commissioned project) 3.Curiosity driven research: a hunch can be as important a reason for undertaking research as the imperatives of social theories. These three motivations are obviously not mutually exclusive. Regardless of the motivation, the need to undertake social inquiry will direct us to particular variables to be investigated, and usually, at the initial stage a variable has a conceptual definition. The conceptual definition (or nominal definition) of a variable uses literal terms to specify the quality of a variable. It is much like a dictionary definition, it provides a working definition of the variable so that we have a general sense of what it ‘means’. (e.g. income).
 3.Curiosity driven research: a hunch can be as important a reason for undertaking research as the imperatives of social theories. These three motivations are obviously not mutually exclusive. Regardless of the motivation, the need to undertake social inquiry will direct us to particular variables to be investigated, and usually, at the initial stage a variable has a conceptual definition. The conceptual definition (or nominal definition) of a variable uses literal terms to specify the quality of a variable. It is much like a dictionary definition, it provides a working definition of the variable so that we have a general sense of what it ‘means’. (e.g. income)..")
49
The operationalization of variable Isolating a variable of interest at this conceptual level is only the beginning An operational definition of a variable specifies the operations used to measure a variable for individual cases. Two kinds of operational definitions from literature: 1.Operational definitions define the concept by means of the indicants. (e.g. intelligence is ‘that which a properly standardized intelligence test measures’, losing ground for decades now) 2.Operational definition specify how to operationalize a concept. (this kind of operational definition is necessary if we are going to make empirical research.) Nevertheless, operational definitions are necessary but rarely sufficient for measurement.
 2.Operational definition specify how to operationalize a concept. (this kind of operational definition is necessary if we are going to make empirical research.) Nevertheless, operational definitions are necessary but rarely sufficient for measurement..")
50
Problems in arriving at an operational definition of an variable Complexity of the concept (e.g. socioeconomic status) Availability of data (e.g. criminality) Cost and difficulty of obtaining data Ethics However, an operational definition must allow a researcher to assign each case into one, and only one, of the categories of the variable.
 Availability of data (e.g. criminality) Cost and difficulty of obtaining data Ethics However, an operational definition must allow a researcher to assign each case into one, and only one, of the categories of the variable..")
51
Two principles of measurement Principle of exclusiveness: no case should have more than one value for the same variable (e.g. someone can not be 18 years old and 64 years old at the same time) Principle of exhaustiveness: every case must be classified into a category (e.g. a scale for measuring family status must allow for every possible type of family status that can arise).
 Principle of exhaustiveness: every case must be classified into a category (e.g. a scale for measuring family status must allow for every possible type of family status that can arise)..")
52
Measurement error Any measure that you make can be thought of comprising two components: 1.A true score, the real score on the variable 2.Measurement error Two types of measurement errors: random measurement errors and systematic measurement error. They are the threats to construct validity (or measurement validity). Random measurement errors tend to break even in the long run. (discussed mostly under the heading reliability). Systematic measurement errors are those which consistently affect an individual’s score because of some particular characteristics of the person or the test that has nothing to do with the variable being measured.
. Random measurement errors tend to break even in the long run. (discussed mostly under the heading reliability). Systematic measurement errors are those which consistently affect an individual’s score because of some particular characteristics of the person or the test that has nothing to do with the variable being measured..")
53
Theoretical construct Operationalization nr.1 Operationalization nr.2 Random errors

54
Assessment of measurement validity As construct validity is defined as degree of correspondence between something measurable and something not measurable, it is impossible to estimate construct validity numerically An assessment of construct validity will involve:

55
1.A rational assessment of the content of the operationalized construct: are the questions representative of the content of the construct? Will the test result be influenced by some irrelevant constructs? 2.An empirical assessment: does our measured construct behave as we would expect the theoretical construct to behave? Does the measured construct correlate with other variables which we on theoretical reasons will expect it to be related to? Does the measured construct show low correlations with other variables which we on theoretical reasons will expect it to be almost unrelated to?

56
Improving measurement validity Making each measurement as valid as possible Making use of different operationalisations of the same construct, in an attempt to neutralize the systematic errors Reducing the random errors (improving the reliability)
")
57
Relevant questions relating to reliability An examination: 1.To what degree does the result depend on random fluctuations in the person’s achievement from day to day? 2.To what degree does the result depend on the specific tasks or problems to solve? 3.To what degree does the result depend on which committee of censors are evaluating the set of answers? A questionnaire or interview 1.To what degree would we have had the same answer if the person had been asked at another specific point of time? 2.To what degree does the result depend on what specific questions are asked? 3.To what degree does the result depend on the person interpreting the answers? Participant observation 1.To what degree would we have observed the same thing if we had happened to be observing at another specific point of time? 2.To what degree does the result depend on what the observer happens to focus on? 3.To what degree would another observer (with the same theoretical position) have observed the same things and made the same interpretation)
 have observed the same things and made the same interpretation).")
58
The ‘1’ questions are examples regarding the stability aspect of reliability The ‘2’ questions exemplify the equivalence aspect, e.g. to what degree different wordings of a question affect the result. The danger of misunderstanding questions is relevant here, and the possibilities of guessing. The ‘3’ questions regard observer reliability or judgment reliability, i.e. to what degree the result depends on which person or persons are observing or judging.

59
Estimating reliability by... The retest method --- the stability aspect The split-half method or The alpha coefficient (Cronbachs alpha) --- the equivalence aspect Parallel forms --- stability + equivalence
 --- the equivalence aspect Parallel forms --- stability + equivalence.")
60
Improving reliability by... Reducing the random errors Neutralizing the random errors (e.g. through increasing the number of questions, longer or more observation periods.)
.")
62
Level of measurement Four levels: nominal, ordinal, interval and ratio. Levels of measurement, the higher the level of measurement the more information we have about a variable.

63
Nominal A nominal scale of measurement only indicates the category that a case falls into with respect to a variable (e.g. country of origin) 1=Tanzania1=Cameron 2=Romania2=China 3=Turkey3=Colombia 4=USA4=Georgia 5=China5=Romania 6=Colombia6=Tanzania 7=Georgia7=Turkey 8=Cameron8=USA9=other To ensure that the scale is exhaustive nominal scales usually have a catchall category like ‘other’ or ‘miscellaneous’ These numerical values are simply category labels that have no quantitative meaning as such
 1=Tanzania1=Cameron 2=Romania2=China 3=Turkey3=Colombia 4=USA4=Georgia 5=China5=Romania 6=Colombia6=Tanzania 7=Georgia7=Turkey 8=Cameron8=USA9=other To ensure that the scale is exhaustive nominal scales usually have a catchall category like ‘other’ or ‘miscellaneous’ These numerical values are simply category labels that have no quantitative meaning as such.")
64
Ordinal Nominal and ordinal scales are also called collectively categorical variables. An ordinal scale, in addition to the function of classification, allows cases to be ordered by degree according to measurement of a variable. That is, ordinal scales enable us to rank cases. Ordinal scales are particularly common when measuring attitudes or satisfaction in opinion surveys (e.g. satisfaction of library service) As with nominal data, numerical values can be assigned to the categories as a form of shorthand, but with ordinal scales these values need to preserve the sense of ranking Although ordinal scales permit us to rank cases in terms of a variable, they do not allow us to say ‘by how much’ better or stronger one case is compared with another, the distances or intervals between the categories are unknown. 12345 Very poorPoorOKGoodExcellent
 As with nominal data, numerical values can be assigned to the categories as a form of shorthand, but with ordinal scales these values need to preserve the sense of ranking Although ordinal scales permit us to rank cases in terms of a variable, they do not allow us to say ‘by how much’ better or stronger one case is compared with another, the distances or intervals between the categories are unknown Very poorPoorOKGoodExcellent.")
65
Interval An interval scale has units measuring intervals of equal distance between values on the scale Not only can we say that one case has more (or less) of the variable in question than another, but we can say by how much more (or less). Like temperature between 20 o C and 15 o C, 1 o C and 3 o C, 101 o C and 103 o C Numerical values on an interval scale do have significance since they indicate a measurable quantity. Interval scale does not have a true zero point. (zero degree does not mean there is no heat at all)
.")
66
Ratio A ratio scale of measurement has a value of zero indicating cases where no quality of the variable is present A ratio scale allows us to express the value of one case as a ratio of another (e.g. 180cm verses 120cm, 60cm taller and 1.5 times as tall). The distinction between interval and ratio scales of measurement is a fairly subtle one, is not important for what is to follow. we can generally perform the same statistical analyses on interval data that we can perform on ratio data In fact, we talk about only three levels of measurement: nominal, ordinal and interval/ratio.
. The distinction between interval and ratio scales of measurement is a fairly subtle one, is not important for what is to follow. we can generally perform the same statistical analyses on interval data that we can perform on ratio data In fact, we talk about only three levels of measurement: nominal, ordinal and interval/ratio..")
67
Interval/ratio data One important distinction that only applies to interval/ratio data is that between discrete and continuous variables. A discrete variable is measured by a unit that cannot be subdivided. It has a countable number of values. (e.g. 1.7 children per household) A continuous variable is measured by units that can be subdivided infinitely. It can take any value in a line interval.
 A continuous variable is measured by units that can be subdivided infinitely. It can take any value in a line interval..")
68
Summary: levels of measurement LevelexamplesMeasurement procedure Operations permitted NominalSex, race, religion, marital status Classification into categories Counting number of cases in each category; comparing sizes of categories. = ≠ OrdinalSocial class, attitude and opinion scales Classification plus ranking of categories with respect to each other All above plus judgments of ‘greater than’ or ‘less than’. = ≠ Interval/ ratio Age, number of children, income All above plus description of distances between scores in terms of equal units All above plus other mathematical operations (addition, subtraction, multiplication, etc.). = ≠ + - * :
. = ≠ + - * :.")
69
Guidance about how to identify variables of each type (Bryman p.226) Are there more than two categories? No yes Variable is dichotomous Can the categories be rank ordered? NoyesVariable is nominal/categorical Are the distance between the categories equal? No yes Variable is ordinal Variable is interval/ratio

71
Part IV: Univariate analysis January 21 09:15-14:00U35

72
Two types of statistics Descriptive statistics are the numerical and graphical techniques for organizing, presenting and analyzing data. Inferential statistics (analytical statistics, inductive statistics) 1.Estimation (e.g. confidence intervals) 2.Testing of significance (hypothesis testing)
 1.Estimation (e.g. confidence intervals) 2.Testing of significance (hypothesis testing).")
73
The emphasis of this course is on: Understanding of statistical concepts Interpretation of statistical results Understanding the values and the limitations of use of statistical analysis in educational research We will pay most emphasis on inferential statistics, and particularly on analysis of relations between two variables (bivariate statistics) Nevertheless, we first need an understanding of univeriate descriptive statistics.
 Nevertheless, we first need an understanding of univeriate descriptive statistics.")
74
Univariate analysis Univeriate analysis refers to the analysis of one variable at a time, the most common approaches are the four types of descriptive statistics: 1.Frequency distributions, tables, and graphs – give a visual representation of a distribution 2.Measures of central tendency – indicate the typical score of a distribution 3.Measures of variation (of dispersion) – indicate the spread or variety of scores in a distribution 4.Measures of covariation (correlation, or association) – indicate the existence and strength of any relationship between two or more variables.
 – indicate the spread or variety of scores in a distribution 4.Measures of covariation (correlation, or association) – indicate the existence and strength of any relationship between two or more variables.")
75
How do we choose which descriptive statistics to use? Descriptive statistics are meant to simplify – to capture the essential features of the terrain – but in so doing they also leave out information contained in the original data. The choice of descriptive statistics used to summarize research data really depends on the specific context. Sometimes it might be important to summarize the data in a table, at other times it might be important to also calculate some measure of average and/or dispersion.

76
Frequency distributions A frequency distribution reports, for each value or category of a variable, the number of cases that have that value or fall into that category.

77
A survey of statistics students Variables: sex, age, attitude to statistics (like, indifferent, hate). Table 1 is called ‘raw frequency distribution’ Table 2 adds more information to a frequency table, ‘relative frequencies’ Table 4.1 Sex of students SexFrequency Female8 Male12 Total20 Table 4.2 sex of students SexFrequencyPercentage (%) Female88/20*100=40 Male1212/20*100=60 Total20100
 Female88/20*100=40 Male1212/20*100=60 Total")
78
With ordinal and interval/ratio data Since ordinal and interval/ratio data are on a scale that gives some sense of increase or decrease, it is sometimes interesting to know the number and percentage, of cases that fall above or below a certain point on the scale. A cumulative frequency distribution shows the number of cases in each category up to and including that category. Table 4.3 Attitude of students to statistics PreferenceFrequencyCumulative frequency Percentage (%) Cumulative percentage (%) Like88408/20*100=40 Indifferent58+5=1325(8+5)/20=65 Hate78+5+7=2035(8+5+7)/20=100 Total20100
 Cumulative percentage (%) Like88408/20*100=40 Indifferent58+5=1325(8+5)/20=65 Hate78+5+7=2035(8+5+7)/20=100 Total")
79
Table 4.4 Age (in years) of students AgeFrequencyCumulative frequency Percentage (%)Cumulative percentage (%) 187735 195122560 204162080 212181090 2222010100 Total20100
 of students AgeFrequencyCumulative frequency Percentage (%)Cumulative percentage (%) Total20100")
80
Measures of central tendency A central tendency statistic tells us what the sample as a whole, or on the average, is like. Measures of central tendency indicate the typical or average value of a distribution. There are three measures of central tendency MeasureLevel of measurement MeanInterval/ratio MedianInterval/ratio, ordinal ModeInterval/ratio, ordinal, nominal

81
Arithmetic mean ( ) The mean of a set of scores is obtained by adding all the scores and dividing by the number of scores. The sum of all observations (X 1 +X 2 + X 3 +......X N ) divided upon the number of observation N. The arithmetic mean can be used when data may be said to be at an approximate interval level of measurement. ═
 divided upon the number of observation N. The arithmetic mean can be used when data may be said to be at an approximate interval level of measurement. ═.")
82
Median (Mdn, M d ) The median is the score that divides the group in half (with 50% scoring below and 50% scoring above the median). For an odd number of cases, the median is the middle score for a rank-ordered set of cases. Score3122556648793 Rank1234567

83
For an even number of cases, the median is the average of the two middle scores for a rank-ordered set of cases.For an even number of cases, the median is the average of the two middle scores for a rank-ordered set of cases. Score312255664879398 Rank12345678 The median will be the average of the 4th and 5th values. Median=(56+64)/2=60
/2=60.")
84
The arithmetic mean and median give identical results in symmetric distributions In skewed distributions (distributions with an accumulation at one side of the scale and fewer extreme values on the other side) the mean will come closer to the few extreme values. Therefore, median is the recommended measure of central tendency in skewed distributions. (e.g. age distribution in a student group, distribution of income level in a society)
.")
85
Mode The mode is the value or category of a distribution with the highest number of cases. (the score value with the highest frequency). The mode is the only measure of central tendency that can be calculated for nominal data, and even with ordinal and interval/ratio it can be easily calculated. An important point to remember is that the value or category of the variable is the mode, not the number of times it appears in the distribution
. The mode is the only measure of central tendency that can be calculated for nominal data, and even with ordinal and interval/ratio it can be easily calculated. An important point to remember is that the value or category of the variable is the mode, not the number of times it appears in the distribution.")
86
Unlike the other measures of central tendency, there can be more than one mode for the same distribution. Such distribution is bimodal. Table 4.5 Sex of students SexFrequency Female8 Male12 Total20 Table 4.6 Age in years AgeFrequency 187 195 204 212 227 Total25

87
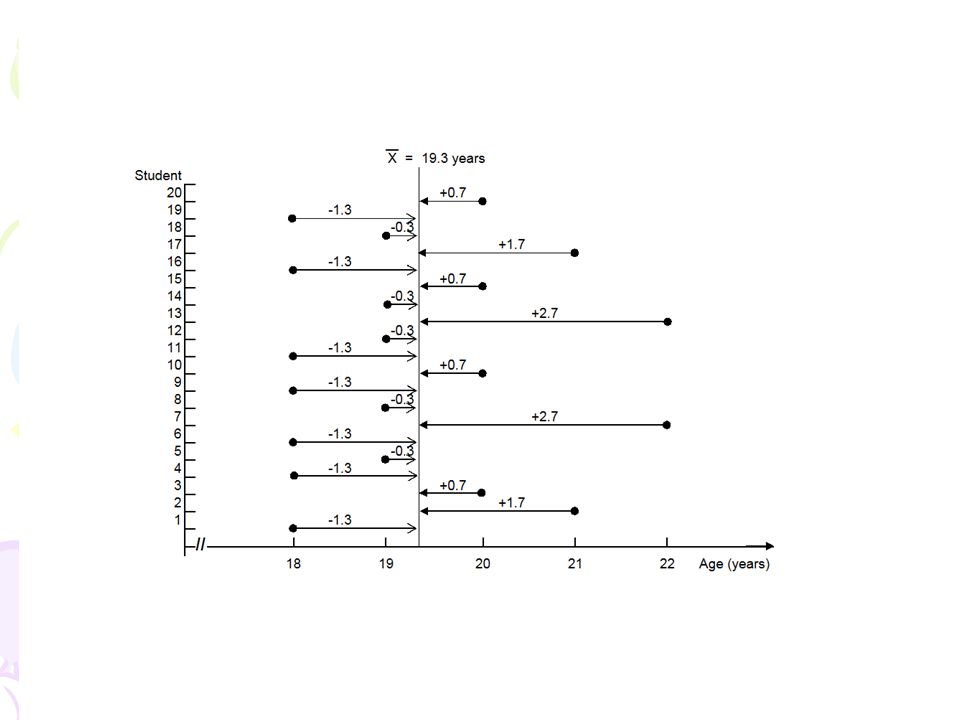
Choosing a measure of central tendency It is possible to calculate all the measures of central tendency on a variable measured at the interval/ratio level. Table 4.7 Age in years AgeFrequency 187 195 204 212 222 Total20 Mode: 18 Median: 19 Mean: 19.3

89
Variation (dispersion) Measures of dispersion are descriptive statistics that indicate the spread or variety of scores in a distribution The simplest measure of dispersion is the range
 Measures of dispersion are descriptive statistics that indicate the spread or variety of scores in a distribution The simplest measure of dispersion is the range")
90
The range is the difference between the smallest score and the largest score in a distribution. Table 4.8 Annual income Group A ($)Group B ($) X 1 =5000X 1 =20000 X 2 =6500X 2 =28500 X 3 =8000X 3 =35000 X 4 =55000X 4 =36000 X 5 =85000X 5 =40000 The mean income for each group is $31900. Although the two groups have the same mean, there is a major difference between the two The spread or dispersion of scores is very different between the two groups of income. The ranges: R A =85000-5000=$80000 R B =40000-20000=$20000 µ A = (5000+6500+8000+55000+ 85000)/5=31900 µ B = (20000+28500+35000+360 00+40000)/5=31900
Group B ($) X 1 =5000X 1 =20000 X 2 =6500X 2 =28500 X 3 =8000X 3 =35000 X 4 =55000X 4 =36000 X 5 =85000X 5 =40000 The mean income for each group is $ Although the two groups have the same mean, there is a major difference between the two The spread or dispersion of scores is very different between the two groups of income. The ranges: R A = =$80000 R B = =$20000 µ A = ( )/5=31900 µ B = ( )/5=")
91
The interquartile range and deciles The interquartile range is the difference between the upper limits of the first quartile and third quartile. it is the range for the middle 50% of rank-ordered cases. Deciles are the set of cases that is rank- ordered, and ‘split’ into 10 groups of equal size (this is commonly used to analyze data on the distribution of income.

92
The standard deviation The standard deviation is essentially the average amount of variation around the mean. It is calculated by taking the difference between each value in a distribution and the man and then dividing the total of the differences by the number of values.

93
Age distribution

95
Calculations of standard diviation ΣX i 2 ’the sum of all the squared scores’ (ΣXi) 2 ’the sum of all the scores squared’ f is the frequency of each value in the distribution.
 2 ’the sum of all the scores squared’ f is the frequency of each value in the distribution.")
96
Part V: Bivariate analysis January 22 09:00-11:00U35

97
Bivariate statistics Statistical procedures used to describe the relationship between two variables The primary focus is on the extent to which they covary, or vary together

98
Standard score (Z-scores) Z-scores are means of answering the question ‘how many standard deviations away from the mean is this observation? If our observation X is from a population with mean μ and standard deviation σ, then If our observation X is from a sample with mean and a standard deviation as s.

99
If a person has got a z-score =1, that means that this result is exactly one standard deviation above the arithmetic mean. Results below the mean give negative z-scores Standard scores maybe useful when we want to compare quantities which are not directly comparable (e.g. a student’s achievement in a Math test and an English tests). The z-scores tell us the result on each test compared to the results of the whole group of students.
. The z-scores tell us the result on each test compared to the results of the whole group of students..")
100
An example In a certain city the mean price of a quart of milk is 63 cents and the standard deviation is 8 cents. The average price of a package of bacon is $1.80 and the standard deviation is 15 cents. If we pay $0.89 for a quart of milk and $2.19 for a package of bacon at a 24-hour convenience store, which is relatively more expensive? To answer this, we compute Z- scores for each Our Z-scores show us that we are overpaying quite a bit more for the milk than we are for the bacon

101
The rule the Empirical rule (or the Chebychev's rule), the Z-score of a given observation also provides insight on how ``typical'' this observation is to the population. by empirical rule, if data follow a bell- shaped curve (a normal distribution), then approximately 95% of the data should have the Z-score between -2 and 2.
, then approximately 95% of the data should have the Z-score between -2 and 2..")
102
Covariation between two variables Researchers are usually more interested in relations between variables than in the distributions of single variables If we want to see the relation between two variables and we have measured both variables, we may express the size of this relation numerically, by means of a coefficient of correlation

103
Bivariante correlation statistics Dichotomous/dichotomo us Phi-correlation (φ) Nominal/nominal (not dichotomous) Cramer’s V Ordinal/ordinal (few categories) Kendall’s tau b (or gamma) Ordina/ordinal (many categories) Spearman’s rho or Kendall’s tau b Nominal/intervalEta-coreelation Interval/intervalPearson’s product- moment correlation
 Nominal/nominal (not dichotomous) Cramer’s V Ordinal/ordinal (few categories) Kendall’s tau b (or gamma) Ordina/ordinal (many categories) Spearman’s rho or Kendall’s tau b Nominal/intervalEta-coreelation Interval/intervalPearson’s product- moment correlation")
104
Pearson’s correlation There is a whole family of correlation coefficients for various situations, depending among other things on the level of measurement of the variables The most often used coefficient of correlation between two variables is Pearson’s product-moment correlation Pearson’s correlation coefficient measures the strength and direction of a linear relationship between two variables

105
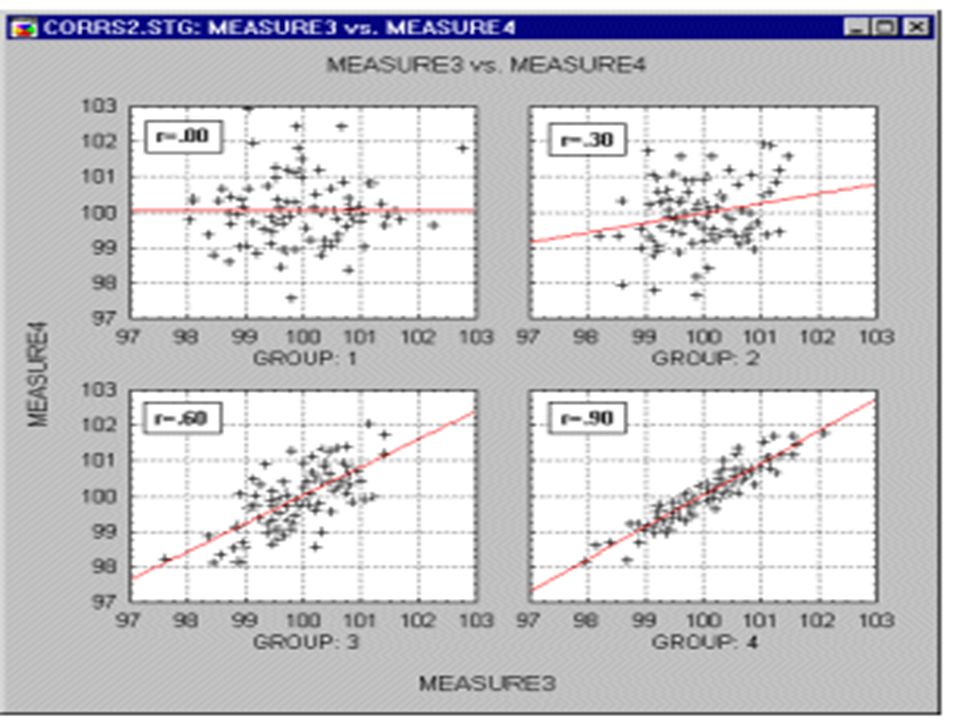
Pearson’s r the population correlation coefficient is ρ and the sample correlation coefficient is denoted by r. Pearson’s r will always range between -1 and +1, regardless of the actual units in which the variables are measured. The value of -1.00 represents a perfect negative correlation while a value of +1.00 represents a perfect positive correlation. A value of 0.00 represents a lack of correlation.

106
As visually…

108
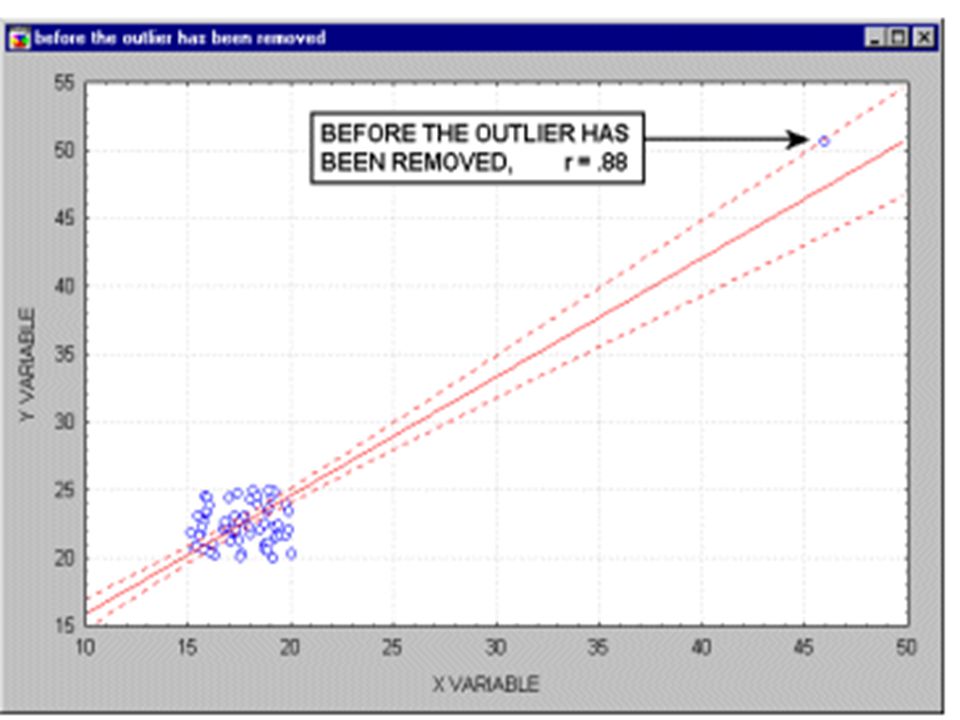
If the correlation coefficient is squared, then the resulting value (r 2, the coefficient of determination) will represent the proportion of common variation in the two variables (i.e., the "strength" or "magnitude" of the relationship). the significance of a correlation coefficient of a particular magnitude will change depending on the size of the sample from which it was computed. many researchers follow a rule of thumb that if your sample size is 50 or more then serious biases are unlikely, and if your sample size is over 100 then you should not be concerned at all with the normality assumptions. But outliers….

110
If the sample size is small

111
outliers represent a random error that we would like to be able to control. Unfortunately, there is no widely accepted method to remove outliers automatically, thus what we are left with is to identify any outliers by examining a scatterplot of each important correlation.scatterplot Nevertheless, outliers may not only artificially increase the value of a correlation coefficient, but they can also decrease the value of a "legitimate" correlation.

Similar presentations