Download presentation
Presentation is loading. Please wait.

1
Using Performance Data to Improve Governor Effectiveness Julie Johnson Assistant Director of Schools (Primary) Diocese of Shrewsbury Department of Education
 Diocese of Shrewsbury Department of Education")
2
Aims for today’s session Understand the Ofsted expectations for Governors in relation to performance data Know the six key questions that school governors should ask about the Ofsted Data Dashboard Be familiar with the key analyses in Data Dashboard Understand what Data Dashboard is telling you about your school Know the changes in RAISEonline for 2105 data Diocese of Shrewsbury Department of Education

3
Ofsted & Governors Inspectors will consider P138 the effectiveness of the actions leaders take to secure and sustain improvements to teaching, learning and assessment and how effectively governors hold them to account for this P138 how effectively leaders monitor the progress of pupils to ensure that none falls behind and underachieve, and how effectively governors hold them to account for this Sources of evidence P140 Inspectors will obtain a range of evidence from meetings with leaders and governors Inspectors will use documentary evidence provided by the school, evaluating the impact of leaders’ and governors’ work, both currently and over time, in conjunction with first-hand evidence

4
Governance Inspectors will consider whether Governors P145 provide support for an effective headteacher or are hindering school improvement because of a lack of understanding of the issues facing the school P145 understand the impact of teaching, learning and assessment on the progress of pupils currently in the school P145 ensure that assessment information from leaders provides governors with sufficient and accurate information to ask probing questions about outcomes for pupils

5
Data Dashboard

15
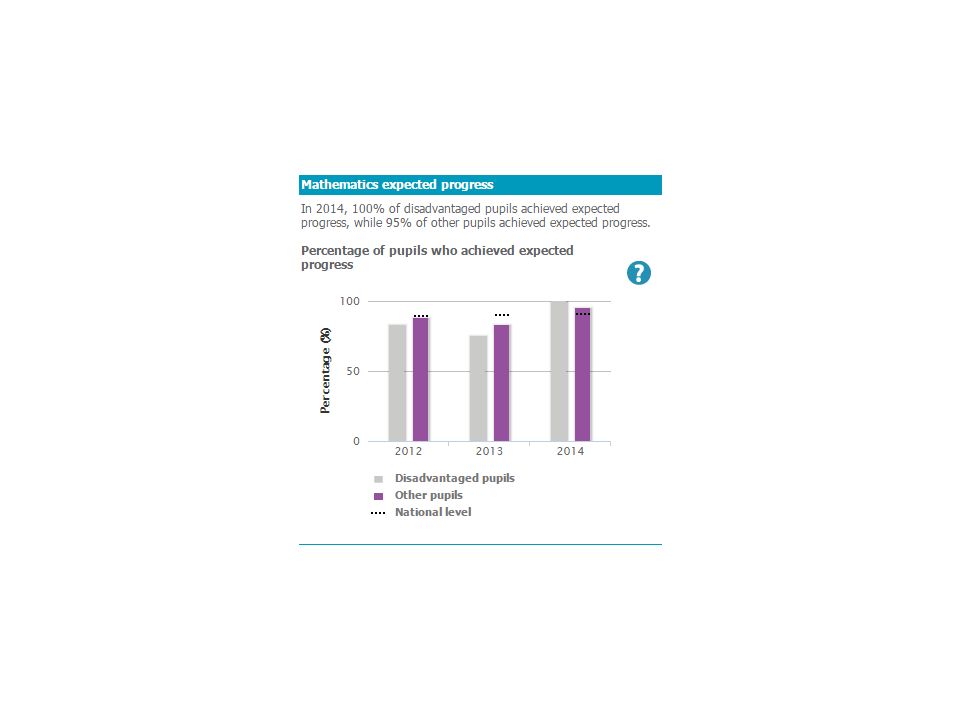
Inspection Dashboard The inspection dashboard is designed to show at a glance how well previous cohorts demonstrated characteristics of good or better performance. It contains a brief overview of published data for the last three years. It shows progress first, including from the main starting points. It includes the key groups: disadvantaged pupils, those who have special educational needs (SEN), girls and boys. Achievement of disadvantaged pupils is compared with the national performance of other (non-disadvantaged) pupils. Cohort sizes are shown; data for very small groups should be treated with caution. The front page summarises strengths and weaknesses based on only the 2014 data shown in the dashboard. The strengths give an indication of some features of good or better performance in 2014, highlighting consistency across starting points, subjects or groups. 2014 National Floor Standards School Level 4+ RWM 65% 73% EP reading 94% 84% EP writing 96% 96% EP mathematics 93% 96% Floor standards met? √ Strengths in 2014 KS2 value added was broadly average or above in all subjects. KS2 value added in all subjects was broadly average or above for disadvantaged pupils and those who have special educational needs. From at least 5 out of every 6 starting points, the proportion of disadvantaged KS2 pupils making and exceeding expected progress in reading, in writing & in mathematics was similar to that of other pupils nationally. The proportion of disadvantaged KS2 pupils that attained at least Level 4 was equal to or above the national figure for other pupils in reading. Weaknesses in 2014 The average point score for KS1 pupils was significantly below average and in the lowest 10% in reading, writing & mathematics. Fewer than half of the children achieved a good level of development in the Early Years Foundation Stage Profile. Attendance was low (in the lowest 10% of all mainstream schools nationally). Attendance was low for the group(s): FSM, girls, SEN with statement, SEN without statement, no SEN (in the lowest 10% of all mainstream schools nationally).
, girls and boys. Achievement of disadvantaged pupils is compared with the national performance of other (non-disadvantaged) pupils. Cohort sizes are shown; data for very small groups should be treated with caution. The front page summarises strengths and weaknesses based on only the 2014 data shown in the dashboard. The strengths give an indication of some features of good or better performance in 2014, highlighting consistency across starting points, subjects or groups National Floor Standards School Level 4+ RWM 65% 73% EP reading 94% 84% EP writing 96% 96% EP mathematics 93% 96% Floor standards met. √ Strengths in 2014 KS2 value added was broadly average or above in all subjects. KS2 value added in all subjects was broadly average or above for disadvantaged pupils and those who have special educational needs. From at least 5 out of every 6 starting points, the proportion of disadvantaged KS2 pupils making and exceeding expected progress in reading, in writing & in mathematics was similar to that of other pupils nationally. The proportion of disadvantaged KS2 pupils that attained at least Level 4 was equal to or above the national figure for other pupils in reading. Weaknesses in 2014 The average point score for KS1 pupils was significantly below average and in the lowest 10% in reading, writing & mathematics. Fewer than half of the children achieved a good level of development in the Early Years Foundation Stage Profile. Attendance was low (in the lowest 10% of all mainstream schools nationally). Attendance was low for the group(s): FSM, girls, SEN with statement, SEN without statement, no SEN (in the lowest 10% of all mainstream schools nationally)..")
16
Six key questions for governors Is this the picture you were expecting? Are standards rising in reading, writing and maths at KS1 and KS2? How is your school performing compared with other schools with a similar intake of pupils? Are there differences between groups of pupils? Are pupils making the levels of progress expected of them? Has attendance improved over the last three years? Diocese of Shrewsbury Department of Education

17
Data Dashboard Over to you! Can you answer the six questions for your school? If not, what questions do you need to ask your Headteacher and Leadership Team?

18
Other Sources of Data For Governors RAISEonline (DfE/Ofsted) Attainment, progress, attendance and school context Understand strengths and areas for improvement Compare school performance to national averages Fischer Family Trust (FFT) Estimates of future school and pupil attainment based on pupils’ prior attainment Used to inform target setting Internal school analyses Tracking pupil progress, term by term Teacher assessment – latest estimate of likely pupil performance Diocese of Shrewsbury Department of Education
 Attainment, progress, attendance and school context Understand strengths and areas for improvement Compare school performance to national averages Fischer Family Trust (FFT) Estimates of future school and pupil attainment based on pupils’ prior attainment Used to inform target setting Internal school analyses Tracking pupil progress, term by term Teacher assessment – latest estimate of likely pupil performance Diocese of Shrewsbury Department of Education")
19
RAISEonline Changes for 2015 include- Key Stage 1 Phonics Year 1 and Year 2 Trend Data Key Stage 2 Question Level Analysis SEND Exclusion Data New Data Dashboard

20
Key Stage 1 phonics Year 1 and Year 2 trend data The Year 2 phonics report will now show the percentage of all Year 2 pupils that have reached the expected standard whether it was in Year 1 or in Year 2. A new report will be introduced for those pupils who did not meet the expected standard in Year 1 or took the test for the first time in Year 2. This report will show the Year 2 marks alongside their Year 1 marks. Finally, a new three-year trend report will be available to show Year 1 phonics outcomes.

21
Key Stage 2 Question level analysis 2014/15 (Primary schools) Question level analysis (QLA) data will be populated for the following Key Stage 2 tests this year: Mathematics Level 3 to 5 (paper 1, paper 2 and mental mathematics) Mathematics Level 6 (paper 1 and paper 2) Reading (Level 3 to 5 and Level 6 papers) English grammar, punctuation and spelling (Level 3 to 5 and Level 6 papers) These Key Stage 2 tests were electronically marked at question/item level and will be loaded directly into RAISEonline for all schools alongside the respective national data.
 Question level analysis (QLA) data will be populated for the following Key Stage 2 tests this year: Mathematics Level 3 to 5 (paper 1, paper 2 and mental mathematics) Mathematics Level 6 (paper 1 and paper 2) Reading (Level 3 to 5 and Level 6 papers) English grammar, punctuation and spelling (Level 3 to 5 and Level 6 papers) These Key Stage 2 tests were electronically marked at question/item level and will be loaded directly into RAISEonline for all schools alongside the respective national data.")
22
All Key Stages Special Educational Needs (SEN) On 1 September 2014 a range of SEND reforms were introduced as part of the Children and Families Act. Following the changes to SEN school census codes, RAISEonline will adopt the following categories: no SEN SEN support (which replaces School Action and School Action Plus) SEN with statement or EHC plan. All Key Stages Exclusion Data For 2015, a new category will be added to the existing RAISEonline exclusion reports to show the percentage of pupils with more than one fixed-term exclusion.
 SEN with statement or EHC plan. All Key Stages Exclusion Data For 2015, a new category will be added to the existing RAISEonline exclusion reports to show the percentage of pupils with more than one fixed-term exclusion..")
23
Using School Performance Data No single source of data or analysis can provide a comprehensive overview of school performance It’s not the source that matters (as long as it’s accurate), it’s the question you ask of the data New Ofsted framework places a greater emphasis on data for all year groups and for groups of pupils When several sources say the same thing, it’s a basis for action When several sources give conflicting messages, it’s a cause for investigation Diocese of Shrewsbury Department of Education
, it’s the question you ask of the data New Ofsted framework places a greater emphasis on data for all year groups and for groups of pupils When several sources say the same thing, it’s a basis for action When several sources give conflicting messages, it’s a cause for investigation Diocese of Shrewsbury Department of Education")
Similar presentations


 a)Southwark schools seem to be doing well. Since September there have been 12 inspections and all outcomes have.>")

 to improve effectiveness John Mc Cann Assistant Director of Schools Diocese of Shrewsbury Department.>")


 Cornwall Council.>")


 Primary School School Development Priorities 2015-16.>")

