Download presentation
Presentation is loading. Please wait.

1
Clinical Presentation Curriculum A Guide to Intermediary Metabolism Jack Blazyk, Ph.D. 2003-2004

2
2

3
In an actively functioning pathway, the G for ALL reactions is NEGATIVE Allosteric Regulation Covalent Modification (e.g., reversible phosphorylation) OR Genetic Regulation Thermodynamics Enzyme Regulation 3
 OR Genetic Regulation Thermodynamics Enzyme Regulation 3")
4
High-Energy Phosphates Enol Example Phosphoenolpyruvate (PEP) Acyl Example 1,3-Bisphosphoglycerate Amino Example Creatine phosphate Pyro (Phosphoanhydride) Example Adenosine triphosphate (ATP) Hydrolysis of Phosphates Enol-15 Acyl-10 Amino-10 Pyro-7 Adenosine Pool ATP ADP AMP Hydrolysis of ATP 4
 Acyl Example 1,3-Bisphosphoglycerate Amino Example Creatine phosphate Pyro (Phosphoanhydride) Example Adenosine triphosphate (ATP) Hydrolysis of Phosphates Enol-15 Acyl-10 Amino-10 Pyro-7 Adenosine Pool ATP ADP AMP Hydrolysis of ATP 4")
5
NAD + + 2e - + H + NADH OxidizedReduced Nicotinamide Adenine Dinucleotide Electron Transfer NADP + + 2e - + H + NADPH OxidizedReduced Nicotinamide Adenine Dinucleotide Phosphate FAD + 2e - + 2H + FADH 2 OxidizedReduced Flavin Adenine Dinucleotide Coenzyme A ADP + Pantothenic Acid + SH CoA - SH CoA - S ~ C – CH 3 O Acetyl-CoA Acyl Group Transfer 5

6
4. C 4 C 4 + 4e - Citric Acid Cycle or Tricarboxylic acid (TCA) Cycle or Krebs Cycle Located in mitochondrial matrix Citrate - COO - Citric Acid 1. C 2 + C 4 C 6 3. C 5 C 4 + CO 2 + ~P + 2e - 2. C 6 C 5 + CO 2 + 2e - Oxidative Decarboxylations Sneak Preview 6
 Cycle or Krebs Cycle Located in mitochondrial matrix Citrate - COO - Citric Acid 1. C 2 + C 4 C 6 3. C 5 C 4 + CO 2 + ~P + 2e - 2. C 6 C 5 + CO 2 + 2e - Oxidative Decarboxylations Sneak Preview 6.")
7
Citrate SynthaseAconitase Isocitrate Dehydrogenase -KG Dehydrogenase Oxidative Decarboxylations Succinate ThiokinaseSuccinate Dehydrogenase FumaraseMalate Dehydrogenase CH 3 - C - S - CoA 3 H 2 O 3 NAD + 1 FAD GDP + P i O In CoA - SH 2 CO 2 3 NADH + 3 H + 1 FADH 2 GTP + H 2 O Out 7

8
Tap-Off Points Malate NADP + PEP Carboxykinase Malic Enzyme Anaplerotic Pathway Pyruvate Carboxylase PyruvateOxaloacetate ATP + CO 2 ADP + P i Allosterically activated by Acetyl-CoA Biotin (a water-soluble B vitamin) is a coenzyme NADPH + H + + CO 2 Pyruvate 8
 is a coenzyme NADPH + H + + CO 2 Pyruvate 8")
9
Oxidative Phosphorylation Electron Transport Chain = Respiratory Chain 4 Membrane-Bound Complexes I – NADH-Q Reductase II – Succinate-Q Reductase III – Cytochrome Reductase IV – Cytochrome Oxidase 2 Mobile Electron Carriers Ubiquinone (Coenzyme Q) Cytochrome c Complex I NADH-Q Reductase Transfers electrons from NADH to Q NADH + H + + Q NAD + + QH 2 Flavin Mononucleotide (FMN) Iron-sulfur (Fe-S) proteins Complex II Succinate-Q Reductase Transfers electrons from Succinate to Q Succinate + Q Fumarate + QH 2 Flavin Adenine Dinucleotide (FAD) Iron-sulfur (Fe-S) proteins Complex III Cytochrome Reductase Transfers electrons from QH 2 to Cyt c QH 2 + 2Cyt c (Fe +3 ) Q + 2H + + 2Cyt c (Fe +2 ) Cytochrome b (2 types) Iron-sulfur (Fe-S) proteins Cytochrome c 1 Complex IV Cytochrome Oxidase Transfers electrons from Cyt c to O 2 2Cyt c(Fe +2 ) + ½O 2 + 2H + 2Cyt c(Fe +3 ) + H 2 O Cytochrome a Cytochrome a 3 Copper (Cu) 9
 Cytochrome c Complex I NADH-Q Reductase Transfers electrons from NADH to Q NADH + H + + Q NAD + + QH 2 Flavin Mononucleotide (FMN) Iron-sulfur (Fe-S) proteins Complex II Succinate-Q Reductase Transfers electrons from Succinate to Q Succinate + Q Fumarate + QH 2 Flavin Adenine Dinucleotide (FAD) Iron-sulfur (Fe-S) proteins Complex III Cytochrome Reductase Transfers electrons from QH 2 to Cyt c QH 2 + 2Cyt c (Fe +3 ) Q + 2H + + 2Cyt c (Fe +2 ) Cytochrome b (2 types) Iron-sulfur (Fe-S) proteins Cytochrome c 1 Complex IV Cytochrome Oxidase Transfers electrons from Cyt c to O 2 2Cyt c(Fe +2 ) + ½O 2 + 2H + 2Cyt c(Fe +3 ) + H 2 O Cytochrome a Cytochrome a 3 Copper (Cu) 9")
10
Chemiosmotic Mechanism Proposed by Peter Mitchell Proton Motive Force PMF = pH + 10

11
ATP Production via CAC and Ox Phos 3 NADH ~9 ATP 1 FADH 2 ~2 ATP 1 GTP 1 ATP ~12 ATP per Acetyl-CoA GTP + ADP GDP + ATP Regulation of CAC and Ox Phos Availability of Acetyl-CoA Availability of O 2 Energy Charge = Respiratory Control [ATP] + ½ [ADP] [ATP] + [ADP] + [AMP] X X Electron Transport Inhibitors CO CN - N 3 - Rotenone 11
![ATP Production via CAC and Ox Phos 3 NADH ~9 ATP 1 FADH 2 ~2 ATP 1 GTP 1 ATP ~12 ATP per Acetyl-CoA GTP + ADP GDP + ATP Regulation of CAC and Ox Phos Availability of Acetyl-CoA Availability of O 2 Energy Charge = Respiratory Control [ATP] + ½ [ADP] [ATP] + [ADP] + [AMP] X X Electron Transport Inhibitors CO CN - N 3 - Rotenone 11](http://images.slideplayer.com/26/8796316/slides/slide_11.jpg "ATP Production via CAC and Ox Phos 3 NADH ~9 ATP 1 FADH 2 ~2 ATP 1 GTP 1 ATP ~12 ATP per Acetyl-CoA GTP + ADP GDP + ATP Regulation of CAC and Ox Phos Availability of Acetyl-CoA Availability of O 2 Energy Charge = Respiratory Control [ATP] + ½ [ADP] [ATP] + [ADP] + [AMP] X X Electron Transport Inhibitors CO CN - N 3 - Rotenone 11")
12
Oxidative Phosphorylation Inhibitors Oligomycin Atractyloside X X Uncouplers 2,4-Dinitrophenol + H + NO 2 O - NO 2 OH H+H+ H+H+ H+H+ X 12

13
13

14
14

15
15

16
16

17
17

18
18

19
19

20
20

21
21

22
22

23
23

24
24

25
25

26
26

27
27

28
28

29
29

30
30

31
31

32
32

33
33

34
34

35
35

36
36

37
37

38
38

39
39 R-COOH

40
40 Fatty Acid Oxidation

41
41

42
42

43
43 Fatty Acid Biosynthesis

44
44 Regulation

45
45

46
46 Triglyceride Metabolism

47
47 Lipogenesis Lipolysis

48
48

49
49 Amino Acid Metabolism

50
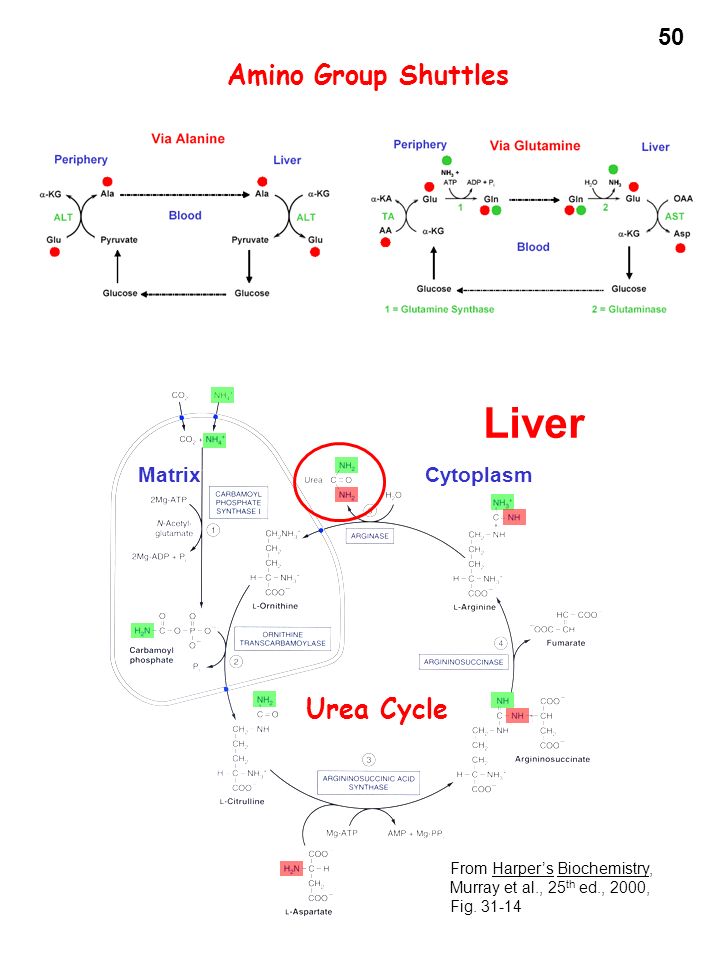
50 Amino Group Shuttles MatrixCytoplasm Liver Urea Cycle From Harper’s Biochemistry, Murray et al., 25 th ed., 2000, Fig. 31-14
51
51

52
Well-Fed Conditions Glycolysis Glycogenesis Pentose Shunt Fatty Acid Synthesis Cholesterol Synthesis Triglyceride Synthesis 52

53
Glycolysis Pentose Shunt Fatty Acid Synthesis Cholesterol Synthesis Triglyceride Synthesis Well-Fed Conditions 53

54
Well-Fed Conditions Glycogenesis 54

55
Insulin RBC Liver Muscle Adipose Brain Gut Portal Vein Lymphatics Glucose Glycogen Glucose CO 2 + H 2 O Protein TG Urea Pancreas Glucose TG Pyruvate Lactate Chylomicrons VLDL Glycogen CO 2 + H 2 O Well-Fed State 55

56
Gluconeogenesis Fatty Acid Oxidation Ketone Body Synthesis Glycogenolysis Fasting Conditions 56

57
Fatty Acid Oxidation Triglyceride Breakdown No Uptake Fasting Conditions 57

58
No Uptake Fatty Acid Oxidation Ketone Body Utilization Fasting Conditions 58

59
Early Fasting State Glucagon RBC Liver Muscle Adipose Brain Gut Portal Vein Lymphatics Glycogen Glucose CO 2 + H 2 O Pancreas Pyruvate CO 2 + H 2 O FA Lactate 59

60
Extended Fasting State Glucagon RBC Liver Muscle Adipose Brain Gut Portal Vein Lymphatics CO 2 + H 2 O Pancreas Pyruvate CO 2 + H 2 O KB Lactate FA Glycerol FA CO 2 + H 2 O Protein Cortisol Glucose Urea 60

Similar presentations


