Download presentation
Presentation is loading. Please wait.

1
Section 4.2 Building Linear Models from Data

2
OBJECTIVE 1

3
(a) Draw a scatter diagram of the data, treating on-base percentage as the independent variable. (b) Use a graphing utility to draw a scatter diagram. (c) Describe what happens to runs scored as the on-base percentage increases.
 Use a graphing utility to draw a scatter diagram. (c) Describe what happens to runs scored as the on-base percentage increases..")
4
OBJECTIVE 2

8
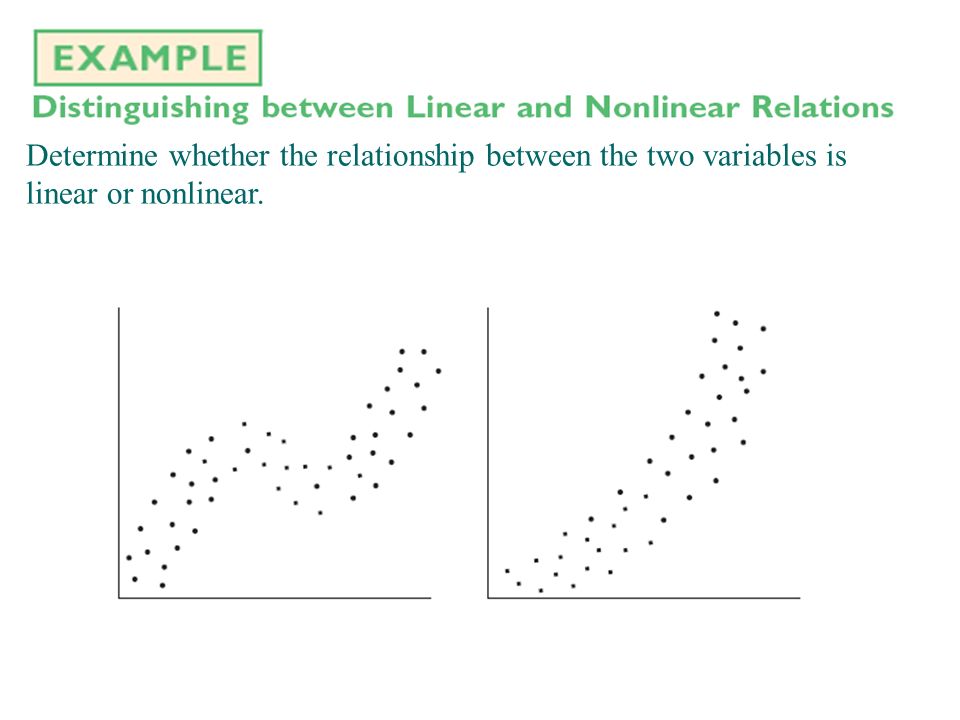
Determine whether the relationship between the two variables is linear or nonlinear.

10
(a)Select two points and find an equation of the line containing the points. (b) Graph the line on the scatter diagram obtained in the previous example.
 Graph the line on the scatter diagram obtained in the previous example..")
11
OBJECTIVE 3

12
(a) Use a graphing utility to find the line of best fit that models the relation between on-base percentage and runs scored. (b) Graph the line of best fit on the scatter diagram obtained in the previous example. (c) Interpret the slope. (d) Use the line of best fit to predict the number of runs a team will score if their on-base percentage is 33.5.
 Graph the line of best fit on the scatter diagram obtained in the previous example. (c) Interpret the slope. (d) Use the line of best fit to predict the number of runs a team will score if their on-base percentage is")
Similar presentations


>")


 Investigate relationships between quantities by using points on scatter plots.>")


=mx+b The graph of a linear function is a line with a slope m and y-intercept.>")

 and.>")

