Download presentation
Presentation is loading. Please wait.

1
The Lisbon Growth and Jobs Strategy: methodologies to track and evaluate progress with structural reforms Conference on “Accomplishing the goals of the renewed Lisbon strategy: problems and solutions” Bratislava, 10 & 11 June 2008 Declan COSTELLO and Alexandr HOBZA European Commission Directorate General for Economic and Financial Affairs

2
A political imperative “Monitoring and assessing reforms is an important factor for the success of the Lisbon strategy. This calls for a clear and transparent approach based on suitable methods.” “Monitoring and assessing reforms is an important factor for the success of the Lisbon strategy. This calls for a clear and transparent approach based on suitable methods.” ECOFIN Council, February 2007 “… invites the Commission to continue working with Member States to further develop a clear and transparent methodology for the monitoring and evaluation of Lisbon reforms”. “… invites the Commission to continue working with Member States to further develop a clear and transparent methodology for the monitoring and evaluation of Lisbon reforms”. European Council, March 2008

3
The benefits of robust and transparent evaluation frameworks credibility of political recommendations (CSRs and PTWs) depends on having robust and transparent underpinnings which is comparable across countries, policy areas and time credibility of political recommendations (CSRs and PTWs) depends on having robust and transparent underpinnings which is comparable across countries, policy areas and time cross-country comparative analysis facilities peer review, sharing of best practices and mutual learning cross-country comparative analysis facilities peer review, sharing of best practices and mutual learning the success of the euro the success of the euro
 depends on having robust and transparent underpinnings which is comparable across countries, policy areas and time credibility of political recommendations (CSRs and PTWs) depends on having robust and transparent underpinnings which is comparable across countries, policy areas and time cross-country comparative analysis facilities peer review, sharing of best practices and mutual learning cross-country comparative analysis facilities peer review, sharing of best practices and mutual learning the success of the euro the success of the euro")
4
Overview of work on evaluation methodologies based on partnership Tracking what is actually happening: using standised reporting tables and databases on structural reforms under way in Member States Tracking what is actually happening: using standised reporting tables and databases on structural reforms under way in Member States Systematically identifying challenges and evaluating policy responses: developing frameworks for identifying underperforming policy areas and their impact on growth Systematically identifying challenges and evaluating policy responses: developing frameworks for identifying underperforming policy areas and their impact on growth Quantifying the impact of reforms on growth and jobs and the EU value-added: modelling tools and econometric studies Quantifying the impact of reforms on growth and jobs and the EU value-added: modelling tools and econometric studies

5
The “partnership” approach in action Work is carried out by Commission together with the Lisbon Methodology Working Group (LIME) attached to the EPC Close collaboration of all EMCO and HLG Involvement of lead Commission services
 attached to the EPC Close collaboration of all EMCO and HLG Involvement of lead Commission services")
6
Improved information on structural reforms

7
Two main instruments Standardised reporting tables attached to Implementation reports : what is happening in “real time”, especially responses to CSRs and PTWs Standardised reporting tables attached to Implementation reports : what is happening in “real time”, especially responses to CSRs and PTWs Databases such as LABREF/MICREF: systematically tracking enacted reforms over time Databases such as LABREF/MICREF: systematically tracking enacted reforms over time

8
Breakdown of reforms in 2007 Implementation Reports

9
Using LABREF to track patterns of labour market reforms

10
Systematically identifying challenges and evaluating policy responses Systematically identifying challenges and evaluating policy responses

11
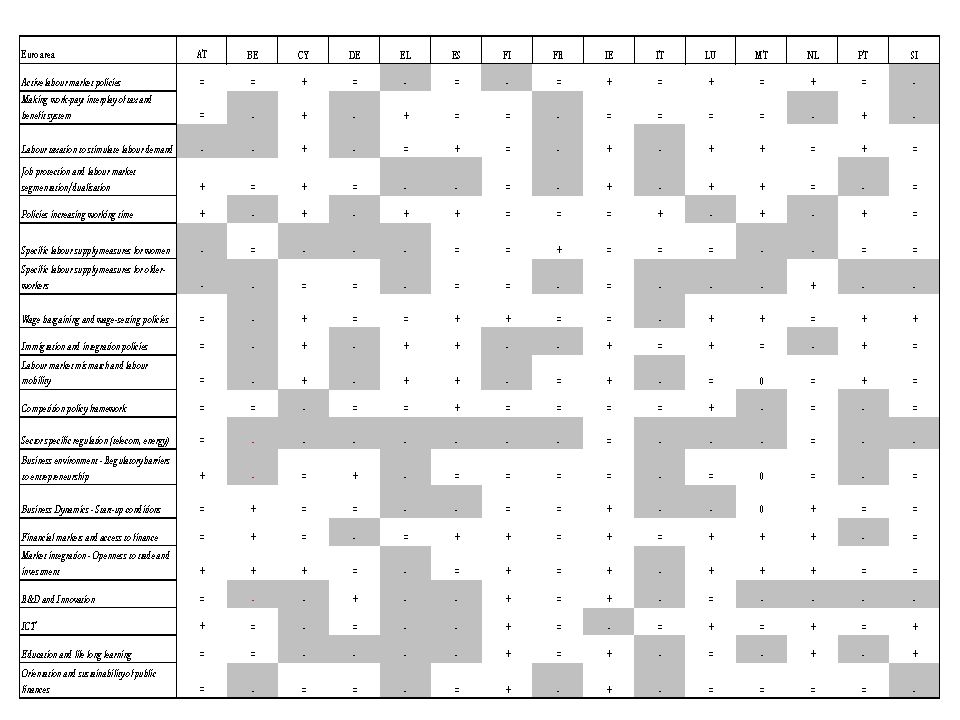
The LIME Assessment Framework (LAF) ANALYSISANALYSIS OUTPUTOUTPUT GDP Analyses of 12 GDP components in level and changes Relative performance (+ = -) of GDP components Screening Examines links (identified in literature survey) between performance in policy areas and relevant GDP components Underperforming policy areas qualified with links to GDP components Policy Performance Evidence-based analysis of 20 policy areas affecting GDP. Indicator-based assessment which is then qualified with country- specific information Relative performance (+ = -) of policy areas
 of policy areas.")
12
Factor driving growth in Slovakia since 2000 Table 1: Relative performance of GDP components vis-à-vis the EU15 both in level and growth (scores)
")
13
Overview of performance in policy areas in Slovakia

15
But is only work in progress Useful step forward, and may be helpful as national authorities prepare NRPs, Useful step forward, and may be helpful as national authorities prepare NRPs, Limitations due to data and some policy areas of Lisbon strategy not yet covered, e.g. environment Limitations due to data and some policy areas of Lisbon strategy not yet covered, e.g. environment Does not provide a framework for assessing the adequacy of policy response which is a key factor in the decision to recommend CSRs and PTWs Does not provide a framework for assessing the adequacy of policy response which is a key factor in the decision to recommend CSRs and PTWs

16
Modelling the effects of structural reforms

17
The benefits of reforms at Member State level Reform areaAssumptions of the simulationsResults Labour and product markets Changes in policy variables (e.g. tax wedge, taxes, unemployment benefits and regulation of PMs) since 1995. 2% increase in EU15 GDP and 1.4 p.p. reduction in structural unemployment Effective retirement age One year increase in retirement age1.5% increase in EU15 GDP by 2025 and 2.5% by 2050 Enlarged Internal Market Gains from greater integration and enlargement (e.g. higher competition and more trade) over 1992-2006 2.2 increase in EU25 GDP and 1.4 increase in employment Administrative burden 25% reduction in administrative burden by 2010 1.3% increase in GDP by 2025 Increased R&D spending Reaching national R&D expenditure targets by 2010 2.6 to 4.4% increase in EU25 GDP (25-30% due to spillovers) Link: http://ec.europa.eu/economy_finance/publications/publication_summary9585_en.htmhttp://ec.europa.eu/economy_finance/publications/publication_summary9585_en.htm
 since % increase in EU15 GDP and 1.4 p.p. reduction in structural unemployment Effective retirement age One year increase in retirement age1.5% increase in EU15 GDP by 2025 and 2.5% by 2050 Enlarged Internal Market Gains from greater integration and enlargement (e.g. higher competition and more trade) over increase in EU25 GDP and 1.4 increase in employment Administrative burden 25% reduction in administrative burden by % increase in GDP by 2025 Increased R&D spending Reaching national R&D expenditure targets by to 4.4% increase in EU25 GDP (25-30% due to spillovers) Link:")
18
The benefits of reforms at EU level (CLP) Reform measureModelAssumptions of the simulations M-T impact on EU GDP Financial market integration QUEST III Reduction of costs of lending by 50 bp 0.75% in 2020 and 1% after 20 years WorldScan0.5% Mutual recognition of venture capital QUEST III Removal of regulatory and tax obstacles to cross-border VC, generating additional 20 billion euros of VC a year 0.75% in 2020 and 1% after 20 years WorldScan0.6% EU contribution to reduction of administrative burdens QUEST III 25% reduction in administrative burden from EU legislation (35% of the overall burden) leading to lower fixed costs, greater competition and labour efficiency 0.3% - 0.6% WorldScan0.6% Unbundling electricity markets QUEST III 10% decline in energy prices due to productivity increases and greater competition 0.2% - 0.4% WorldScan0.3% “Blue card” for entry of highly skilled workers QUEST III Inflow of highly-skilled workers from outside of EU by 74300 between 2012-2020 0.2% in 2020 and 0.25% after 20 years WorldScan0.2% in EU25
 Reform measureModelAssumptions of the simulations M-T impact on EU GDP Financial market integration QUEST III Reduction of costs of lending by 50 bp 0.75% in 2020 and 1% after 20 years WorldScan0.5% Mutual recognition of venture capital QUEST III Removal of regulatory and tax obstacles to cross-border VC, generating additional 20 billion euros of VC a year 0.75% in 2020 and 1% after 20 years WorldScan0.6% EU contribution to reduction of administrative burdens QUEST III 25% reduction in administrative burden from EU legislation (35% of the overall burden) leading to lower fixed costs, greater competition and labour efficiency 0.3% - 0.6% WorldScan0.6% Unbundling electricity markets QUEST III 10% decline in energy prices due to productivity increases and greater competition 0.2% - 0.4% WorldScan0.3% Blue card for entry of highly skilled workers QUEST III Inflow of highly-skilled workers from outside of EU by between % in 2020 and 0.25% after 20 years WorldScan0.2% in EU25")
19
The benefits of coordinating reforms Policy areaModelSimulation assumptions Overall effect Spillovers* R&D WorldScan Increasing R&D intensity from 1.86% to 2.7% in 2010 (partially paid through R&D subsidy financed by transfers from households). 3.3%50% QUEST III Increasing R&D intensity from 1.86% to 2.54% in 10 years through a R&D subsidy (financed from consumption tax). 4.8%20% Skills WorldScan Achieving skill targets set by 2003 European Council. Input into simulation (effects on labour efficiency from these policies and demographic developments) were modelled in a special model. 2.1%*5% Admin. burden WorldScan Reduction in administrative burden by 25% modelled as a labour efficiency shock. 1.9%5% NiGEM Reduction in administrative burden by 25% modelled as a shock to mark-up of prices over unit costs. 1.1%10% * Average spillovers as a percentage of the overall effect Link: http://ec.europa.eu/economy_finance/publications/publication_summary10844_en.htmhttp://ec.europa.eu/economy_finance/publications/publication_summary10844_en.htm
. 4.8%20% Skills WorldScan Achieving skill targets set by 2003 European Council. Input into simulation (effects on labour efficiency from these policies and demographic developments) were modelled in a special model. 2.1%*5% Admin. burden WorldScan Reduction in administrative burden by 25% modelled as a labour efficiency shock. 1.9%5% NiGEM Reduction in administrative burden by 25% modelled as a shock to mark-up of prices over unit costs. 1.1%10% * Average spillovers as a percentage of the overall effect Link:")
Similar presentations


 increases, scarcities => prices rise => impact on European economy 20th cent.: 12-fold.>")


