Download presentation
Presentation is loading. Please wait.

1
FlexBRT Project Briefing

2
Background Feasibility Study began in 1999 1999 – $750,000 TEA-21 Grant to study an ITS Circulator in North Orange County/South Seminole County area Maitland, Altamonte Springs, Orange County & Seminole County contributed $60,000 each as local match

3
Feasibility Study Evaluated use of ITS components to provide smart transit service in North Orange/South Seminole area Conclusion: Improved roadway LOS and high ridership Regional partners advanced study to next phase: PD&E/PE Identified as a Regional Priority by FDOT, LYNX and METROPLAN ORLANDO

4
PD&E Study Purpose Define FlexBRT Operation Define No Build and Baseline Alternatives No Build - existing bus services, occurs regardless Baseline – 2 fixed route circulators @ 12 min headways Determine Physical Improvements Determine Environmental Impacts Compare Alternatives Support Project Clearance

5
FlexBRT Concept Flexible – routes to meet demand Transit ITS support – smart vehicles, routing, scheduling User controls trips Easy fare payment system Stations connect activity centers – to/from where people are already going No fixed schedules No fixed routes Portland, ME Traditional BRT FlexBRT ITS = Intelligent Transportation System

6
Service Area and Stations 38 stations 8 remote kiosks 10 future stations SR436 SR434 SR414 I-4

7
On-vehicle systems Automated reservation, scheduling, vehicle assignment Vehicle location/computerized dispatch Easy Payment system and boarding pass High capacity, high speed, reliable wireless communications Portable technology – can be used throughout Central Florida (why FTA likes the FlexBRT) ITS Driven
 ITS Driven")
8
Operations Analysis Objective to Optimize: Number of Vehicles O&M Costs Ridership Productivity Wait/Travel Times Cost-effectiveness Ran 36 Scenarios Select best scenario

9
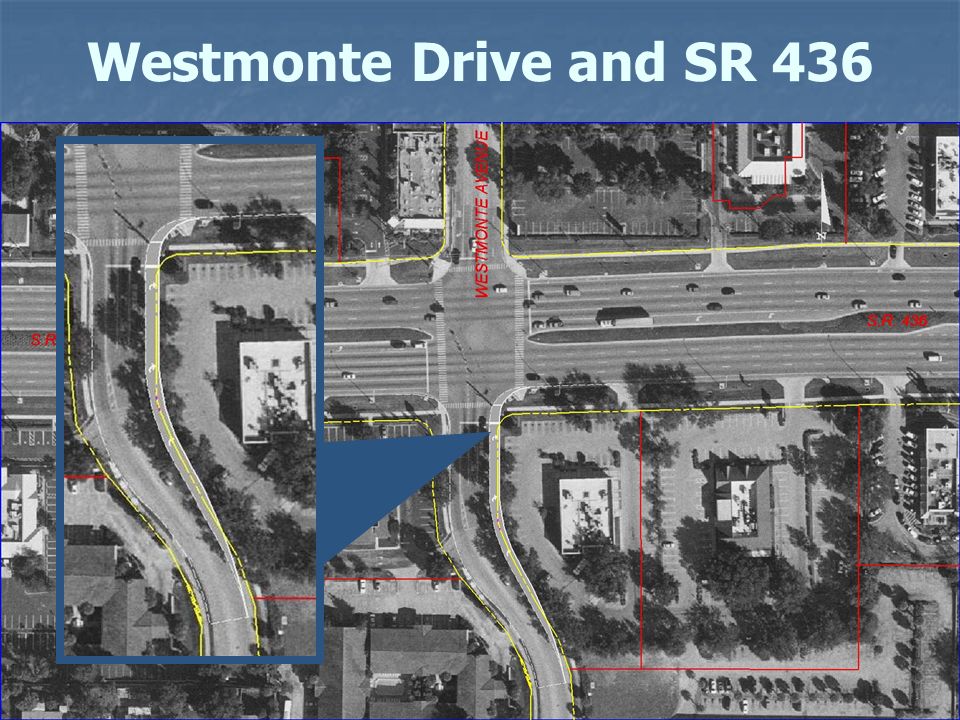
Roadway Improvements Total Project Boston Avenue at SR 436$322,047 Essex Avenue at SR 436$491,218 Cranes Roost Drive at Central Parkway$44,164 Central Parkway at Douglas Avenue$101,663 Douglas Avenue at Central Parkway$234,589 Central Parkway at Centre Pointe Circle$103,377 Westmonte Drive at SR 436$711,244 West Town Parkway Extension$356,588 Construction and ROW$2,364,890 Contingency$689,222 Total Roadway$3,054,112

10
Westmonte Drive and SR 436

12
Total Project Costs Project Cost Elements Roadway Improvements$3,054,112 Stations$2,316,000 Vehicles$8,910,000 ITS Components$4,421,758 Total Capital$18,701,870 Total Fees$4,848,911 Total Project$23,550,781 O&M Costs Vehicle Operations$4,089,900 ITS$241,300 Stations$62,400 Total O&M Costs$4,393,600

13
Comparison of Alternatives Evaluation Criteria Alternative in 2020 No Build (Existing LYNX Routes) BaselineBuild Peak Vehicle Requirement477877 Annual Ridership5,069,3385,632,8386,155,881 Annual Vehicle-Revenue Hours 214,356366,290289,263 Productivity (Riders/VRH)23.6515.3821.28 Annual O&M Cost$11,703,840$19,999,440$16,097,440 Annual Cost per Trip$2.31$3.55$2.61 Annual Revenue$6,336,672$7,041,046$7,694,851 Annual O&M Subsidy$5,367,168$12,958,394$8,402,589 Annual O&M Subsidy/Rider $1.06$2.30$1.36
 BaselineBuild Peak Vehicle Requirement Annual Ridership5,069,3385,632,8386,155,881 Annual Vehicle-Revenue Hours 214,356366,290289,263 Productivity (Riders/VRH) Annual O&M Cost$11,703,840$19,999,440$16,097,440 Annual Cost per Trip$2.31$3.55$2.61 Annual Revenue$6,336,672$7,041,046$7,694,851 Annual O&M Subsidy$5,367,168$12,958,394$8,402,589 Annual O&M Subsidy/Rider $1.06$2.30$1.36")
14
FlexBRT vs. Traditional Transit BaselineFlexBRT Ridership563,5001,086,543 Vehicle-Revenue Hours151,93474,907 Productivity (Riders/VRH)3.7114.51 O&M Cost per Trip$14.72$4.04 O&M Subsidy/Trip$13.47$2.79
 O&M Cost per Trip$14.72$4.04 O&M Subsidy/Trip$13.47$2.79.")
15
FlexBRT makes economic sense… 92% 92% higher ridership, generated on… 51% 51% fewer revenue miles, producing… 291% 291% greater productivity, that costs… 28% 28% less per rider, which is a… 79% 79% reduction in the subsidy from local governments PER rider!! Bang for the Buck

16
Funding Federal State Local One of region’s priority projects

17
Though a Federal Demonstration Project, made conservative estimates for Federal participation FTA Letter of No Prejudice – can go up to 80% Federal Funding Capital Funding Breakdown

18
Federal Appropriations 1999 - TEA-21 (1 of only 3 funded nationally) Two additional federal appropriations State Appropriations Two state appropriations CommittedIn- Place 100% Local Funding Committed and In- Place CommittedIn- Place 100% Private Funding Committed and In- Place Capital Funding
 Two additional federal appropriations State Appropriations Two state appropriations CommittedIn- Place 100% Local Funding Committed and In- Place CommittedIn- Place 100% Private Funding Committed and In- Place Capital Funding")
19
Operations & Maintenance Funding 125 Private Property Owners Contractually Committed to Funding Proportionate Share of on-going O&M Cost Contribution is Not Capped Altamonte Springs CRA Potential FDOT Start-up Funding (3- Year Limit) Eligible for Funding Through Mechanisms Under Review By TFTF
 Eligible for Funding Through Mechanisms Under Review By TFTF")
20
Has national significance – FTA sees it as model for extremely efficient transit alternatives Successfully competes for funding General Accounting Office concluded BRT should be supported as a cost-effective transit solution Public / Private Partnerships – Local Funding In- place before we began project Portable – Applicable in other parts of Central Florida 79% Very cost-effective – 79% less subsidy per rider by using Flex + BRT + ITS Cost Feasible – Actually Doable FlexBRT’s Regional Significance

21
Schedule PER complete Jan 2004 File CATEX Feb 2004 Public Hearing March 23, 2004 Final PER May 2004 Identify IOS of FlexBRT Final Design Fall 2004 Open FlexBRT 2007/2008

22
Thank You

Similar presentations