Download presentation
Presentation is loading. Please wait.

1
MnDOT-ACEC Annual Conference March 5, 2012

2
Capital planning and programming at MnDOT Major considerations A more transparent and collaborative approach 20-year State Highway Investment Plan ‘13-’32 20-year State Highway Investment Plan ‘13-’32 Corridor Investment Management Strategy (CIMS) Corridor Investment Management Strategy (CIMS)
 Corridor Investment Management Strategy (CIMS)")
4
20-year State Highway Investment Plan Establishes investment needs on the trunk highway system Sets statewide investment direction allocating resources across competing priorities State Highway Investment Plan Annual Update Tracks plan implementation Is MnDOT spending its resources in ways that are consistent with the investment direction?

5
10-year Statewide Total ($ Millions ) Preservation$5,291 (75%) Safety297 (4%) Mobility 761 (11%) C/ED 370 (5%) Prog. Del. 378 (5%) $7,100 (100%) **Investment totals and performance projections based on the current STIP and MnDOT’s programmed investments in ’16-’21**
 $7,100 (100%) **Investment totals and performance projections based on the current STIP and MnDOT’s programmed investments in ’16-’21**.")
8
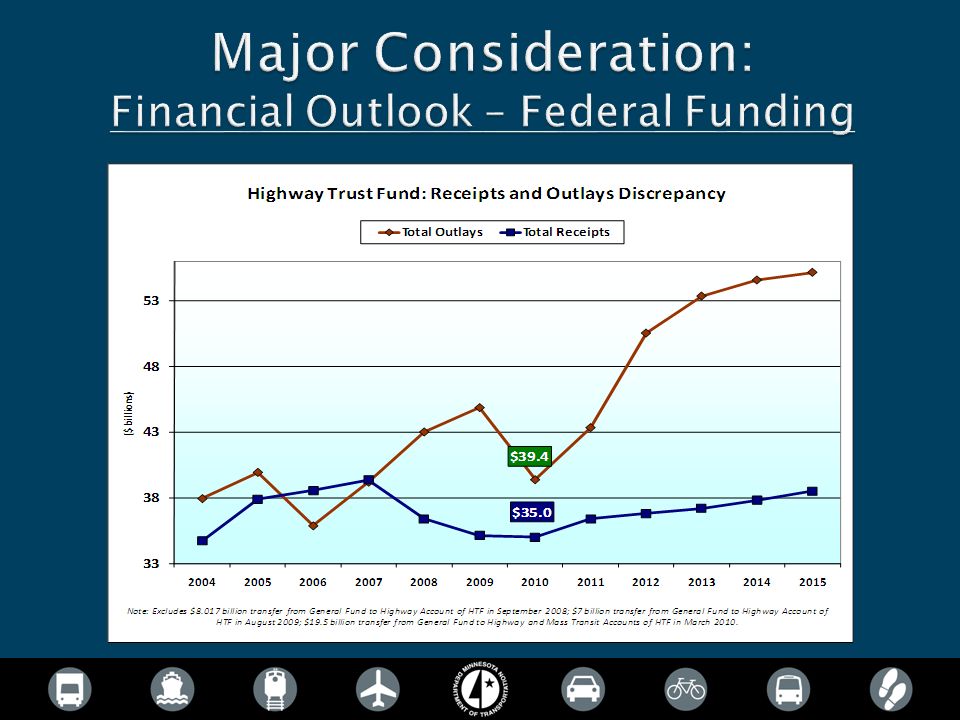
SAFETEA-LU” expired in September 2009 “SAFETEA-LU” expired in September 2009 Temporarily extended eight times through continuing resolutions Temporarily extended eight times through continuing resolutions Current extension expires March 31, 2012 Current extension expires March 31, 2012 Current appropriation extension was recently signed by the president; though Sept 30, 2012 Future Congressional action UNCERTAIN House & Senate – Roughly match current annual spending levels House & Senate – Roughly match current annual spending levels Reauthorization vs extension Reauthorization vs extension

11
Leverage public investments Ensure accessibility Build to a maintainable scale Ensure regional connections Integrate safety Emphasize reliable and predictable options Strategically fix the system Use partnerships

12
20-year State Highway Investment Plan ‘13-’32 Corridor Investment Management Strategy (CIMS)
")
14
Overview 2010 Legislature: update required every 4 years Draft to legislature due January 2013 3 Time Periods – 2013-2016 STIP (programmed projects) – 2017-2022 MRP (potential improvements) – 2023-2032 LRP (investments by major category) Consultant contract in place
 – MRP (potential improvements) – LRP (investments by major category) Consultant contract in place")
15
Key Objectives Identify costs to meet performance-driven investment needs in the areas of infrastructure preservation, traveler safety, and mobility Address developing needs (e.g., regional/local priorities & pedestrian/bicycle) Set investment direction for projected revenue Identify investments and resulting performance Identify capital, maintenance, and operations strategies that guide highway investments
 Set investment direction for projected revenue Identify investments and resulting performance Identify capital, maintenance, and operations strategies that guide highway investments")
17
Plan Development: 5-Step Process Objective: Improve collaboration & transparency in all steps…

18
Step 1: Identify Investment Needs Objective: Define costs to meet performance-driven needs Preservation – Pavement & bridge: update cost models – Other infrastructure: determine scope & approach (e.g., hydraulics, ITS, Complete Streets, signs, ADA) Safety: risk-based safety plans, low cost/high benefit Mobility: – Interregional Corridors: meet corridor speed targets – Twin Cities: low cost/high benefit, managed lanes, active traffic management, strategic capacity
 Safety: risk-based safety plans, low cost/high benefit Mobility: – Interregional Corridors: meet corridor speed targets – Twin Cities: low cost/high benefit, managed lanes, active traffic management, strategic capacity")
19
Step 1: Identify Investment Needs Objective: Address developing needs Estimate costs and/or strategies related to (for e.g.) ADA, pedestrians and bicycles Refine local and regional priorities. The 2009 Plan did not systematically identify local priorities and public involvement was limited.

20
Step 2: Project Future Revenues Preliminary estimate = ~$16 - $16.5 B over 20 years Preliminary estimate = ~$16 - $16.5 B over 20 years Assumes Federal funding maintained at current level Assumes Federal funding maintained at current level How has revenue changed since 2009? (~$15 B over 20 years) How has revenue changed since 2009? (~$15 B over 20 years) – Some revenue increase due to phased fuel tax increase and MVEST share change – Some revenue decrease due to sustained flattening in gas consumption and improved vehicle efficiency However, inflation forecast is higher over 20 years. Projects will cost more to construct. However, inflation forecast is higher over 20 years. Projects will cost more to construct.
 How has revenue changed since (~$15 B over 20 years) – Some revenue increase due to phased fuel tax increase and MVEST share change – Some revenue decrease due to sustained flattening in gas consumption and improved vehicle efficiency However, inflation forecast is higher over 20 years. Projects will cost more to construct. However, inflation forecast is higher over 20 years. Projects will cost more to construct..")
21
Step 3: Evaluate Investment Options 2009 Plan: Mainly internal evaluation that considered: Legislative direction (e.g., Chapter 152 Bridge Program) Legislative direction (e.g., Chapter 152 Bridge Program) Performance trends Performance trends Stakeholder input Stakeholder input 2013 Plan: New approach to involve stakeholders in evaluating alternative scenarios Alternative funding prioritization across & within categories of preservation, traveler safety, mobility, and regional/local priorities Alternative funding prioritization across & within categories of preservation, traveler safety, mobility, and regional/local priorities Evaluate risks of each alternative by examining impact on system performance Evaluate risks of each alternative by examining impact on system performance
 Legislative direction (e.g., Chapter 152 Bridge Program) Performance trends Performance trends Stakeholder input Stakeholder input 2013 Plan: New approach to involve stakeholders in evaluating alternative scenarios Alternative funding prioritization across & within categories of preservation, traveler safety, mobility, and regional/local priorities Alternative funding prioritization across & within categories of preservation, traveler safety, mobility, and regional/local priorities Evaluate risks of each alternative by examining impact on system performance Evaluate risks of each alternative by examining impact on system performance")
23
Example Investment Scenarios Current Investment Direction Alternative 1: Preservation Focus Alternative 2: Safety/Mobility Focus Alternative 3: Regional/Local Focus Performance Area Expected Outcome / Risk (2022) (examples) SafetyExpanding countermeasures further reduce fatal & A-type crashes Bridge PreservationConditions maintained due to targeted investments and preventative maintenance Pavement Preservation X% of roads in good condition. Y% of roads in poor condition Other InfrastructureAddress high risk culverts. Replace infrastructure as it fails. GM MobilityIRC performance continues at similar levels through 2022 TC MobilitySystem congestion miles increase as the economy stabilizes Regional/Local Priorities Many local priorities are not addressed

24
Example Investment Scenarios Alternative 1: Preservation Focus Alternative 2: Safety/Mobility Focus Alternative 3: Regional/Local Focus

25
Step 4: Develop Investment Plan Integrate public/stakeholder evaluation of investment scenarios and risks Integrate public/stakeholder evaluation of investment scenarios and risks Finalize investment direction Finalize investment direction Districts define projects in STIP, potential improvements in MRP, and establish funding in major categories in LRP Districts define projects in STIP, potential improvements in MRP, and establish funding in major categories in LRP Evaluate impact of final investment plan on system performance Evaluate impact of final investment plan on system performance

26
Step 5: Identify Options for Additional Funding 2009 Plan Low key consideration considered internally. Low key consideration considered internally. Based on an assumed increase addressing 5% of unmet needs over 10 years = $2.5B (12.5 cent gas tax increase) Based on an assumed increase addressing 5% of unmet needs over 10 years = $2.5B (12.5 cent gas tax increase) 2013 Plan Incorporate public feedback on draft investment plan as well as input from Step 3 evaluation of alternative scenarios Incorporate public feedback on draft investment plan as well as input from Step 3 evaluation of alternative scenarios Evaluate risk associated with final investment direction and plan Evaluate risk associated with final investment direction and plan
 Based on an assumed increase addressing 5% of unmet needs over 10 years = $2.5B (12.5 cent gas tax increase) 2013 Plan Incorporate public feedback on draft investment plan as well as input from Step 3 evaluation of alternative scenarios Incorporate public feedback on draft investment plan as well as input from Step 3 evaluation of alternative scenarios Evaluate risk associated with final investment direction and plan Evaluate risk associated with final investment direction and plan.")
28
Corridor Investment Management Strategy (CIMS) **Under development** What is CIMS? CIMS is a planning and programming process designed to promote sustainable solutions on Minnesota’s transportation corridors Key Outcomes: More leveraging of public investment to achieve multiple purposes More collaboration between MnDOT, its local partners, and the business community Greater flexibility in MnDOT’s approach to corridor investment Greater transparency and accountability in MnDOT decision- making

29
CIMS Outreach – Interim Approach May 2012 Meetings Fall 2012 10-Year Corridor “work-plan”

30
CIMS Timeline

31
For further information contact: Brian McLafferty MnDOT – Office of Capital Programs and Performance Measures brian.mclafferty@state.mn.us 651-366-3747 Ryan Wilson MnDOT – Office of Capital Programs and Performance Measures ryan.wilson@state.mn.us 651-366-3537

Similar presentations


 Interviews.>")


 Kit Baker, Chair ( Citizen’s Transportation Advisory Committee ) Desiree’ Winkler, P.E. ( Transportation.>")


 Program Kevin J. Haas, P.E. Traffic Investigations Engineer, ODOT February 26, 2015.>")
