Download presentation
Presentation is loading. Please wait.

1
Dynamics and Photochemistry of N2+ Ion in the Polar Ionosphere Manabu Yamada, S. Watanabe ( Hokkaido Univ. ) N. Yoshida, Y. Takahashi ( Tohoku Univ. ) Y. Ogawa and R. Fujii ( STEL, Nagoya Univ. )
 N. Yoshida, Y. Takahashi ( Tohoku Univ. ) Y. Ogawa and R. Fujii ( STEL, Nagoya Univ. ).")
2
Molecular Ions observed by satellites In situ observation DE1 satellite, Akebono satellite, etc. Optical observation MSX satellite Molecular ions were observed at high altitudes of several thousands km. DE1 satellite observed molecular ions at several R E. (Craven et al., 1985)
.")
3
An example of molecular ion observation by SMS onboard Akebono satellite . (left) Mass spectrogram (right) Summary plots of Mass Scan measurement log(count) Many events occurred around Cusp region. N 2 + ion was transversely heated in some events .

4
Why molecular ions exist at several thousands km altitudes? Where is the source? (Altitude, MLT) How to move from low altitudes? There are methods to observe ions near 1000 km altitudes where ions are heated/accelerated. Rocket/Satellite . Radar : It is difficult to identify ion species .
 How to move from low altitudes. There are methods to observe ions near 1000 km altitudes where ions are heated/accelerated. Rocket/Satellite . Radar : It is difficult to identify ion species ..")
5
Possibility of N 2 + ground based observation. Romick et al. [1999] Using MSX satellite, they observed solar resonance fluorescence of N 2 + ion above 450 km at the Northern polar cap. Romick et al. [1999]

6
A new method of ion upflow observation Optical ground based observation of N 2 + 1st negative bands resonant scattering. We may monitor cusp structure. We may understand structure of ion heating/acceleration region and mechanisms of molecular ion upflow.

7
Observation Period: 25 Nov. 2000 ~ 9 Dec. 2000 Location: Longyearbyen Auroral station Geographic coordinate 78 ゚,12′,086″N,15 ゚,49′,893″E Invariant latitude 75 ゚ 18′N List of all observation MLT=UT+4.09 [hour] =LT+3.02 [hour]

8
2000/11/28- 2000/12/01- observation

9
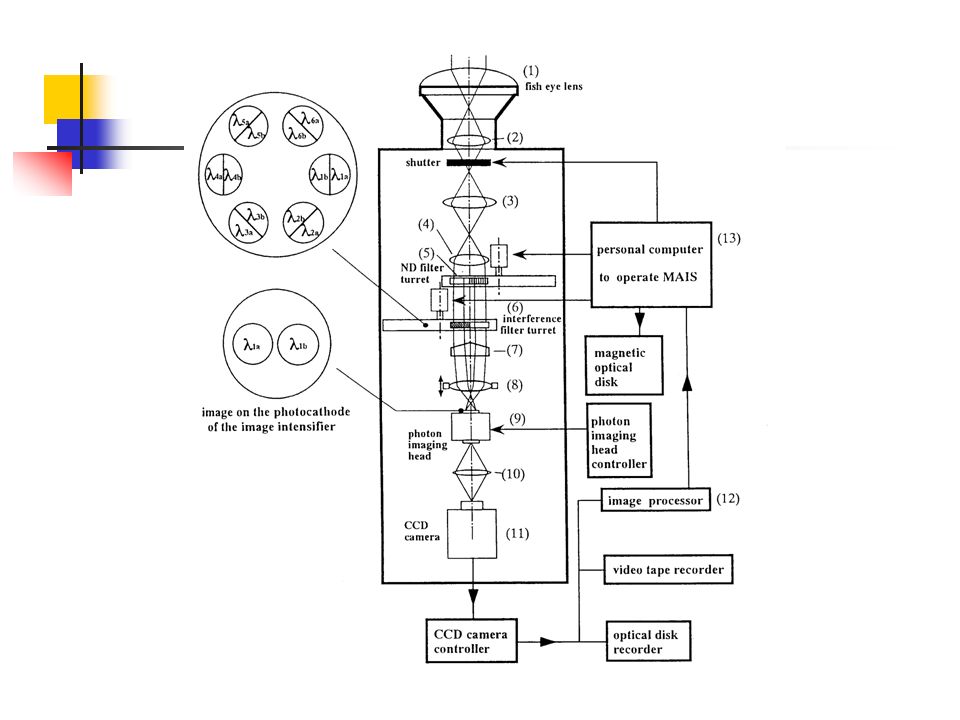
MAIS ( Multicolor All-sky Imaging System ) Simultaneous observation of 2 wave lengths (6 channels) 427.8nm (N 2 + 1st negative) 557.7nm (OI) Exposure: 1min.
 Simultaneous observation of 2 wave lengths (6 channels) 427.8nm (N 2 + 1st negative) 557.7nm (OI) Exposure: 1min.")
10
Calculation 1. Pick up geomagnetic meridian data. 2. Estimate the distance until the aurora using a peak of 557.7 emission. 3. Obtain altitude profile of N 2 + emission. Estimation of altitude profile Assumption 1. 557.7nm and 427.8nm are emitted at same magnetic field line. 2. The peak of 557.7nm emission is 110km. ① 110km ② ③ Θ peak B

11
T1T1 Estimation of N 2 + produced by EUV From data obtained at day time, we can know relation between solar zenith angle and intensity at the zenith. To differentiate the data, intensities of N 2 + emission at each altitude are estimated. To estimate intensity profile of N2+ emission. Intensity of N 2 + emission decreases 4 order with the increase of altitudes from 100km to 200km. T2T2

12
Summary N 2 + 1 st negative bands emission at several hundred km altitudes in aurora region could be observed from ground. We may be able to monitor ion dynamics in the topside ionosphere using N 2 + 1st negative bands emission. To observe N 2 + emission in the cusp region Improve method of analysis and instrument of observation.

14
Acknowledgements We are indebted to the director and staff of EISCAT for operating the facility and supplying the data. EISCAT is an International Association supported by Finland (SA), France (CNRS), the Federal Republic of Germany (MPG), Japan (NIPR), Norway (NFR), Sweden (NFR) and the United Kingdom (PPARC).
, France (CNRS), the Federal Republic of Germany (MPG), Japan (NIPR), Norway (NFR), Sweden (NFR) and the United Kingdom (PPARC)..")
Similar presentations
 used to study the convection in the Earth's ionosphere at altitudes between 90 and 400 km and at magnetic.>")


, M.F. Marcucci (1), S. Massetti (1), P. Francia (3), U. Villante (3) (1) Istituto di Fisica dello Spazio Interplanetario (IFSI),>")


, A. Kadokura (1), Y. Ebihara (1), H. Deguchi (1),>")
 B >")


