Download presentation
Presentation is loading. Please wait.

1
SCIFER2 UV Emissions Allison Jaynes, UNH Dartmouth CASCADES2 Meeting 10/30/09 Allison Jaynes, UNH Dartmouth CASCADES2 Meeting 10/30/09 (Images, movie and lots of time provided by Fred Sigernes, UNIS)
")
2
Overview Neutral upwelling is the observed phenomenon of neutral particle densities occurring in the polar cusp region and associated with auroral activity. The basic driving mechanism is thought to be Joule heating, with other more complicated processes being currently explored. SCIFER2 launched from Svalbard, Norway on January 18, 2008, flying into the cusp over poleward moving auroral forms, reaching maximum altitudes of 1500 km, carrying a PMT with a narrow passband of 120-200 nm. PMT voltage data was analyzed to detect spikes in UV photon emissions that could possibly indicate sunlight resonantly scattered from the neutrals, especially at the 130 nm atomic oxygen spectral line. Resulting voltage data and all-sky imager data was analyzed in correlation with attitude solutions from the NASA Wallops Flight Facility to compare peaks in UV emissions with azimuthal direction. This was done to determine if the peaks were related to visible auroral forms as captured by the imager. We have ruled out visible aurora due to the geometry of our events. Fluorescence is ruled out due to the unlikely event that fluorescent emissions would occur periodically and in alignment with auroral forms. Neutral upwelling is the observed phenomenon of neutral particle densities occurring in the polar cusp region and associated with auroral activity. The basic driving mechanism is thought to be Joule heating, with other more complicated processes being currently explored. SCIFER2 launched from Svalbard, Norway on January 18, 2008, flying into the cusp over poleward moving auroral forms, reaching maximum altitudes of 1500 km, carrying a PMT with a narrow passband of 120-200 nm. PMT voltage data was analyzed to detect spikes in UV photon emissions that could possibly indicate sunlight resonantly scattered from the neutrals, especially at the 130 nm atomic oxygen spectral line. Resulting voltage data and all-sky imager data was analyzed in correlation with attitude solutions from the NASA Wallops Flight Facility to compare peaks in UV emissions with azimuthal direction. This was done to determine if the peaks were related to visible auroral forms as captured by the imager. We have ruled out visible aurora due to the geometry of our events. Fluorescence is ruled out due to the unlikely event that fluorescent emissions would occur periodically and in alignment with auroral forms.

3
Geometry

4
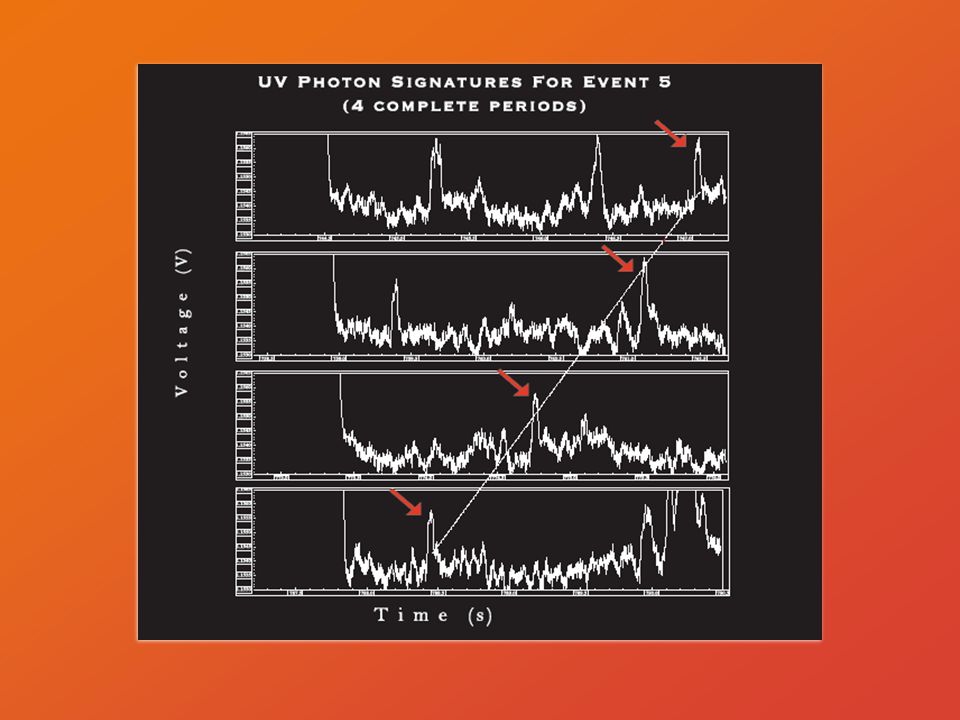
Event #5

6
Preliminary Results Since the UV peaks appear to be so closely related to the visible aurora, yet the PMT is pointing high above the actual aurora, the conclusion is that the signatures are a result of resonantly scattered UV emissions corresponding to the 130 nm atomic oxygen wavelength. 6 out of 12 total events appear to correlate directly with visual aurora as determined by analyzing all-sky imager data. By examining azimuthal angle as a function of time, we can plot the direction in which the PMT was pointing at each time stamp on the all-sky images. This gives a visual confirmation that the PMT is tracking an auroral form, although pointing at an altitude higher than the extent of the visible aurora. A possible explanation for why some events do not correlate with the visual images is related to the actual field of view of the ground-based imager. It only sees a certain portion of the sky, through which SCIFER2 flew, so there was aurora at places it could not see. It is probable that the events that do not correlate are simply cases where the PMT is seeing the presence of neutrals at a point that is off camera for the all-sky imager. These events are usually pointed to a direction of ~ -60 to -90 degrees. At this azimuthal direction, the rocket is quite close to the edge of the field of view of the imager. It is possible that aurora was occurring in the vicinity, but off screen. The PMT appears to be looking at nothing, when in fact it may be picking up signatures from aurora for which we have no visual data. Since the UV peaks appear to be so closely related to the visible aurora, yet the PMT is pointing high above the actual aurora, the conclusion is that the signatures are a result of resonantly scattered UV emissions corresponding to the 130 nm atomic oxygen wavelength. 6 out of 12 total events appear to correlate directly with visual aurora as determined by analyzing all-sky imager data. By examining azimuthal angle as a function of time, we can plot the direction in which the PMT was pointing at each time stamp on the all-sky images. This gives a visual confirmation that the PMT is tracking an auroral form, although pointing at an altitude higher than the extent of the visible aurora. A possible explanation for why some events do not correlate with the visual images is related to the actual field of view of the ground-based imager. It only sees a certain portion of the sky, through which SCIFER2 flew, so there was aurora at places it could not see. It is probable that the events that do not correlate are simply cases where the PMT is seeing the presence of neutrals at a point that is off camera for the all-sky imager. These events are usually pointed to a direction of ~ -60 to -90 degrees. At this azimuthal direction, the rocket is quite close to the edge of the field of view of the imager. It is possible that aurora was occurring in the vicinity, but off screen. The PMT appears to be looking at nothing, when in fact it may be picking up signatures from aurora for which we have no visual data.

7
Fred’s Movie All-sky movie with pointing angle

8
Further Analysis Determine the particle density using the following three steps: 1) Convert instrument output voltage to absolute voltage (and therefore photons) taking into account the PMT gain, quantum efficiency and electronics gain. 2) Obtain expression for geometric factor using FOV, solid angle and PMT photosensitive surface area, in units of photons/cm^2 sr s. 3) Convert photons/cm^2 sr s to N/cm^3, the atomic oxygen density. This is the difficult piece that will take some analysis to complete. Involves resonantly scattered sunlight. Correlate neutral oxygen signals with absolute brightness of visible aurora: Using pixel to brightness calibration (already known), need to integrate total brightness "seen" by PMT which corresponds to the field of view wedge shown as an example in the figure below. Determine the particle density using the following three steps: 1) Convert instrument output voltage to absolute voltage (and therefore photons) taking into account the PMT gain, quantum efficiency and electronics gain. 2) Obtain expression for geometric factor using FOV, solid angle and PMT photosensitive surface area, in units of photons/cm^2 sr s. 3) Convert photons/cm^2 sr s to N/cm^3, the atomic oxygen density. This is the difficult piece that will take some analysis to complete. Involves resonantly scattered sunlight. Correlate neutral oxygen signals with absolute brightness of visible aurora: Using pixel to brightness calibration (already known), need to integrate total brightness "seen" by PMT which corresponds to the field of view wedge shown as an example in the figure below.
 Obtain expression for geometric factor using FOV, solid angle and PMT photosensitive surface area, in units of photons/cm^2 sr s. 3) Convert photons/cm^2 sr s to N/cm^3, the atomic oxygen density. This is the difficult piece that will take some analysis to complete. Involves resonantly scattered sunlight. Correlate neutral oxygen signals with absolute brightness of visible aurora: Using pixel to brightness calibration (already known), need to integrate total brightness seen by PMT which corresponds to the field of view wedge shown as an example in the figure below. Determine the particle density using the following three steps: 1) Convert instrument output voltage to absolute voltage (and therefore photons) taking into account the PMT gain, quantum efficiency and electronics gain. 2) Obtain expression for geometric factor using FOV, solid angle and PMT photosensitive surface area, in units of photons/cm^2 sr s. 3) Convert photons/cm^2 sr s to N/cm^3, the atomic oxygen density. This is the difficult piece that will take some analysis to complete. Involves resonantly scattered sunlight. Correlate neutral oxygen signals with absolute brightness of visible aurora: Using pixel to brightness calibration (already known), need to integrate total brightness seen by PMT which corresponds to the field of view wedge shown as an example in the figure below..")
9
Issues Sampling rate for all-sky imager and PMT/pointing angle are quite different: 2 s versus 1 ms. This creates a hiccup in the data. Only pointing angles and PMT data from once every 2 seconds can be used to correlate to the all-sky data. Geometry of footprint versus actual position of rocket is a little tricky to compute. We need to find the actual total brightness of aurora below the wedge seen by the PMT with a certain FOV. Any good ideas?? Sampling rate for all-sky imager and PMT/pointing angle are quite different: 2 s versus 1 ms. This creates a hiccup in the data. Only pointing angles and PMT data from once every 2 seconds can be used to correlate to the all-sky data. Geometry of footprint versus actual position of rocket is a little tricky to compute. We need to find the actual total brightness of aurora below the wedge seen by the PMT with a certain FOV. Any good ideas??

Similar presentations


>")


 All these slide presentations are at:>")