Download presentation
Presentation is loading. Please wait.

1
ELECTROCARDIOGRAM An electrocardiogram (EKG or ECG) is a graphic representation of the heart’s electrical activity.
 is a graphic representation of the heart’s electrical activity.")
2
Endocardium Myocardium Epicardium

3
Cells of the Heart Muscle
Cardio Myocytes Polarized: inside is negative at rest; outside is positive Depolarized: voltage channels open and allow sodium in which reverses polarity due to shift in electrolyte concentration. Repolarized: Cell returns to initial polarized state K+ (potassium) on the inside with a positive charge. Na+ (sodium) (both electrolytes) positive charge as well. Negative ions from protein are attracted to the positive charge located extracellular and migrate to the membrane of the cell. The potential difference of + to – in the cell. Upon depolarization, the voltage channels open and make the cell permeable to Na+. The Na+ passively enter through the membrane wall because it is attracted to – side of membrane. Also, due to concentration gradient, when the channels open, Na+ tends to fall in or bounce in due to a high concentration extracellularly. Now more + internally so the charge changes to +. K+ has exited due to high concentration of + internally and looking for – which is now external. Not an absolute value; taking the potential difference.
 on the inside with a positive charge. Na+ (sodium) (both electrolytes) positive charge as well. Negative ions from protein are attracted to the positive charge located extracellular and migrate to the membrane of the cell. The potential difference of + to – in the cell. Upon depolarization, the voltage channels open and make the cell permeable to Na+. The Na+ passively enter through the membrane wall because it is attracted to – side of membrane. Also, due to concentration gradient, when the channels open, Na+ tends to fall in or bounce in due to a high concentration extracellularly. Now more + internally so the charge changes to +. K+ has exited due to high concentration of + internally and looking for – which is now external. Not an absolute value; taking the potential difference.")
4
Action Potential Nervous system (neurons) and muscle cells carry action potential When administering an EKG, the action potential measured is some skeletal and mainly cardiac. EKG measures action potential in all cells in the chest range (one lead on lt shoulder, one on rt shoulder, one on left side) There is action potential in skeletal muscle as well as cardiac so patients need to hold still to get an accurate cardiac reading.
 There is action potential in skeletal muscle as well as cardiac so patients need to hold still to get an accurate cardiac reading.")
5
Properties of Cardiac Cells
Automaticity Excitability Conductivity Contractility The heart can initiate its own impulse (automaticity), respond to the impulse(excitability), and transmit this impulse (conductivity). Contractility-mechanical property Automaticity: ability to initiate an impulse or stimulus Excitability: Ability to respond to impulse Conductivity: Ability to transmit impulses to other areas Contractility: ability to respond to this electrical impulse with pump action.
, respond to the impulse(excitability), and transmit this impulse (conductivity). Contractility-mechanical property. Automaticity: ability to initiate an impulse or stimulus. Excitability: Ability to respond to impulse. Conductivity: Ability to transmit impulses to other areas. Contractility: ability to respond to this electrical impulse with pump action.")
6
Purkinje Fibers

7
COMPONENTS Isoelectric Line Cardiac Cycle EKG paper

8
CARDIAC CYCLE One complete heart beat
Depolarization – Cells stimulated & polarity changes Repolarization – Cells return to their normal state.

9
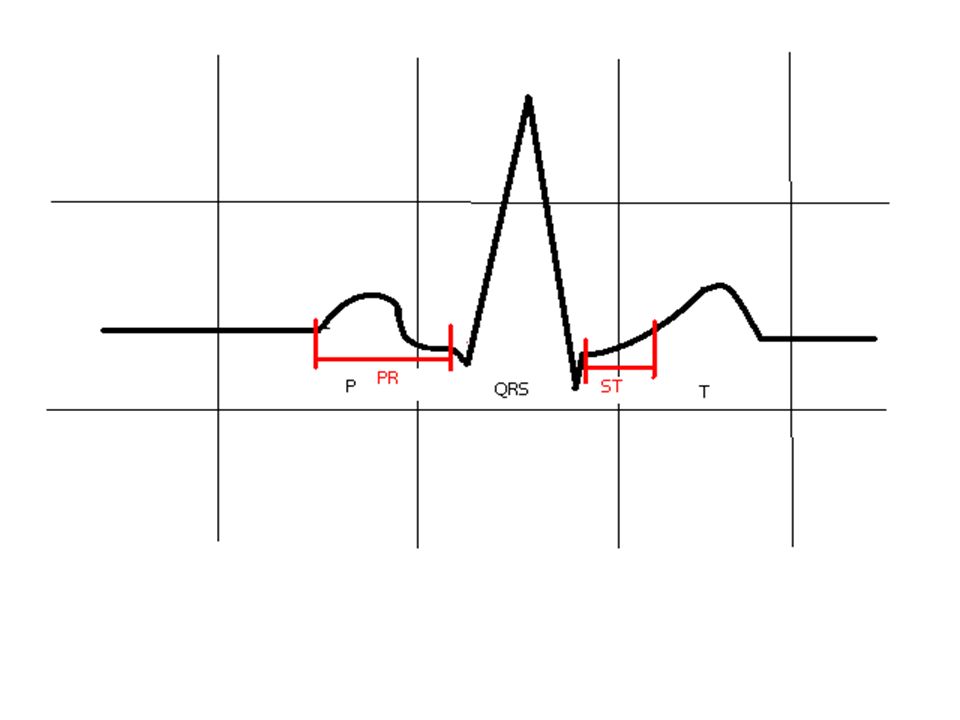
SINE WAVE P Wave QRS Complex T Wave U Wave PR Interval QT Segment
ST Segment P wave: atrial depolarization Q: First negative deflection R: Positive during Ventricular depolarization QRS: Ventricular Depolar T wave: Repolarization of venticle U wave: Unknown but could be repolarization of Purkinje fibers P-R Interval: Measure of AV conduction time. Deplolarization of atria, AV node, Bundle branches, Purkinje fibers. QT Interval: Time of Ventric depolarization and repolariz. Beginning of QRS to end of T. ST Segment: Interval between end of QRS to beginning of T. Elevation or depression may represent Myocardial injury

12
Normal Parameters P-R Interval: .12-.20 QRS Complex: .08-.12
Q-T Interval:

13
EKG PAPER Paper is heat and pressure sensitive Horizontal – rate
1mm .2sec 5mm .o4 sec Paper is heat and pressure sensitive Horizontal – rate Vertical - voltage

14
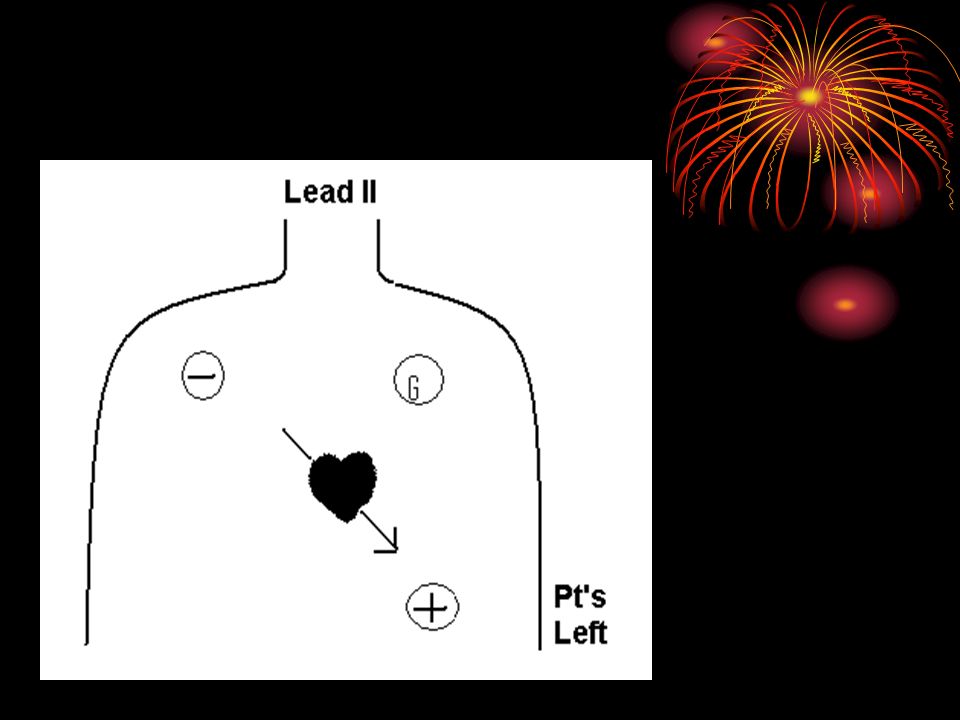
Lead Placement Lead I: Ventricular Depolarization toward positive electrode. QRS positively deflected Lead II: Same as Lead I Lead III: Ventricular Depolarization between + and - so deflection + and -. Ekg machine has the capability of measuring electrical potential using a 12 lead system. Leads provide different views or angles of the heart’s electrical activity. Standard 12 lead EKG has 5 electrodes. One on each extremity and a 5th as a floating electrode…or used for recording from the chest wall. 3 kinds: Standard limb leads, augmented leads, and precordial or chest leads. Each lead made up of – and + electrode. These electrodes sense the magnitude and direction of electrical forces (amplitude and +/- on isoelectric line). QRS is recorded as + or – depending on the movement of depolarization toward or away from certain electrodes. Electrodes can change their polarity. The machine is programmed to do this when you select a lead channel. Standard limb (I, II, III) record frontal plane activity. Records the difference of electrical potential between 2 selected electrodes. Rt Arm always -, while left leg always +. Left arm is + in Lead I and – in Lead III Augmented leads designed to increase the amplitude of the deflections by 50% over those recorded by standard limb. Precordial identified by letter V1-V6. 6 views of the hearts activity.. There is a single positive electrode which is moved to all six positions on the chest wall. Each electrode still has + and -. As depolarization moves from rt to left in the chest wall toward a positive electrode, the QRS deflection moves from negative to positive. In otherwords, V1 V2 appear more negative, V3 and V4 are both + and -, while V5 and V6 are positive. Leads I and aVl look at lateral surface of lt ventricle; Leads II, III and aVF look at inferiour surface of lt vent; Leads V1-V4 look at anteroseptal; Leads V5 and V6 look at apical surface of lt vent. Bedside monitoring is a 3 lead system made up of + and – electrodes and a ground (G) lectrode. They are arranged on the chest to simulate leads I, II, or III. They can also be arranged to simulate V1-6. However, precordial (chest) leads are unipolar (though negative electrode is imaginary) soand our bedside system is bipolar so modifications have to be made. These are referred to as Modified chest leads MCL1, MCL6, etc.
. QRS is recorded as + or – depending on the movement of depolarization toward or away from certain electrodes. Electrodes can change their polarity. The machine is programmed to do this when you select a lead channel. Standard limb (I, II, III) record frontal plane activity. Records the difference of electrical potential between 2 selected electrodes. Rt Arm always -, while left leg always +. Left arm is + in Lead I and – in Lead III. Augmented leads designed to increase the amplitude of the deflections by 50% over those recorded by standard limb. Precordial identified by letter V1-V6. 6 views of the hearts activity.. There is a single positive electrode which is moved to all six positions on the chest wall. Each electrode still has + and -. As depolarization moves from rt to left in the chest wall toward a positive electrode, the QRS deflection moves from negative to positive. In otherwords, V1 V2 appear more negative, V3 and V4 are both + and -, while V5 and V6 are positive. Leads I and aVl look at lateral surface of lt ventricle; Leads II, III and aVF look at inferiour surface of lt vent; Leads V1-V4 look at anteroseptal; Leads V5 and V6 look at apical surface of lt vent. Bedside monitoring is a 3 lead system made up of + and – electrodes and a ground (G) lectrode. They are arranged on the chest to simulate leads I, II, or III. They can also be arranged to simulate V1-6. However, precordial (chest) leads are unipolar (though negative electrode is imaginary) soand our bedside system is bipolar so modifications have to be made. These are referred to as Modified chest leads MCL1, MCL6, etc.")
16
SINUS HEART RHYTHMS Normal Sinus Sinus Bradycardia Sinus Tachycardia

17
VENTRICULAR ARRYTHMIAS
Premature Ventricular Contraction (PVC) Ventricular Tachycardia (V-Tach) Ventricular Fibrillation (V-Fib) Asystole
 Ventricular Tachycardia (V-Tach) Ventricular Fibrillation (V-Fib) Asystole.")
Similar presentations


>")


>")

 node Atrioventricular (AV) node.>")


