Download presentation
Presentation is loading. Please wait.

1
Normal sinus rhythm Debs Farr 2011

2
Course Objectives To recognize the normal rhythm of the heart - “Normal Sinus Rhythm.” Understand normal conduction of the heart

3
1887 British physiologist Augustus D
1887 British physiologist Augustus D. Waller of St Mary's Medical School, London publishes the first human electrocardiogram. It is recorded with a capilliary electrometer from Thomas Goswell, a technician in the laboratory. Waller AD. A demonstration on man of electromotive changes accompanying the heart's beat. J Physiol (London) 1887;8: Dutch physiologist Willem Einthoven sees Waller demonstrate his technique at the First International Congress of Physiologists in Bale. Waller often demonstrated by using his dog "Jimmy" who would patiently stand with paws in glass jars of saline. 1889
 1887;8: Dutch physiologist Willem Einthoven sees Waller demonstrate his technique at the First International Congress of Physiologists in Bale. Waller often demonstrated by using his dog Jimmy who would patiently stand with paws in glass jars of saline")
4
Augustus waller first to His electrocardiograph machine consisted of a Lippmann capillary electrometer fixed to a projector. The trace from the heartbeat was projected onto a photographic plate which was itself fixed to a toy train. This allowed a heartbeat to be recorded in real time. In 1911 he still saw little clinical application for his work. An initial breakthrough came when Willem Einthoven, working in Leiden, Netherlands, used the string galvanometer that he invented in 1903.[8] This device was much more sensitive than both the capillary electrometer that Waller used and the string galvanometer that had been invented separately in 1897 by the French engineer Clément Ader.[9]. Rather than using today's self-adhesive electrodes Einthoven's subjects would immerse each of their limbs into containers of salt solutions from which the ECG was recorded. Einthoven assigned the letters P, Q, R, S and T to the various deflections, and described the electrocardiographic features of a number of cardiovascular disorders. In 1924, he was awarded the Nobel Prize in Medicine for his discovery.- limb leads Many advancements such as Goldbergers chest leads R.E.Mason.,I.Likar ( 1966)
")
5
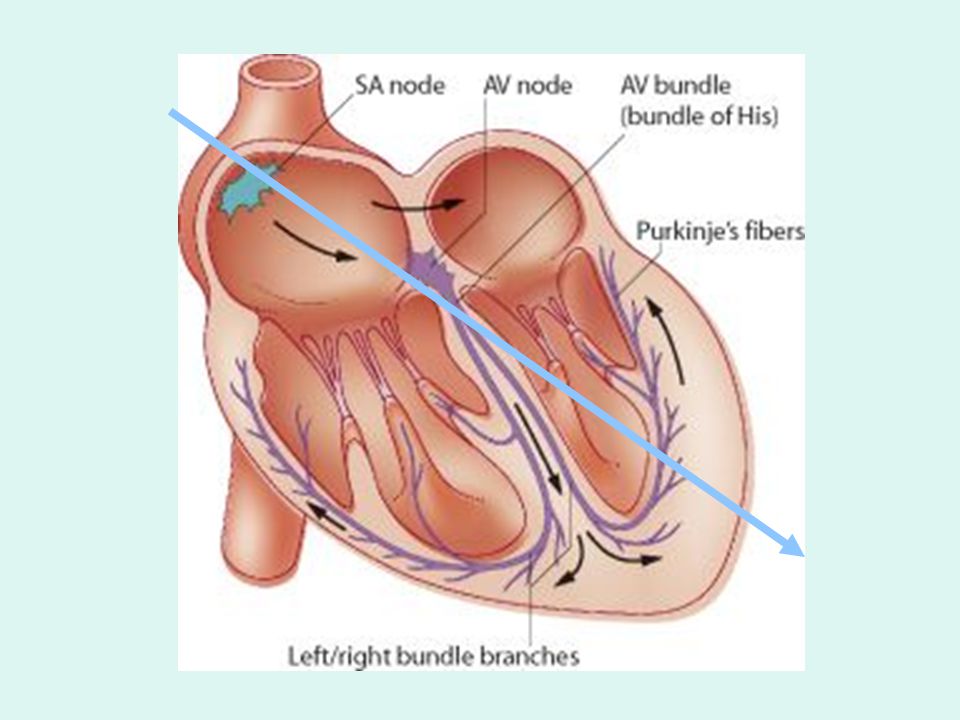
Impulse Conduction & the ECG
Sinoatrial node AV node Bundle of His Bundle Branches Purkinje fibers

6
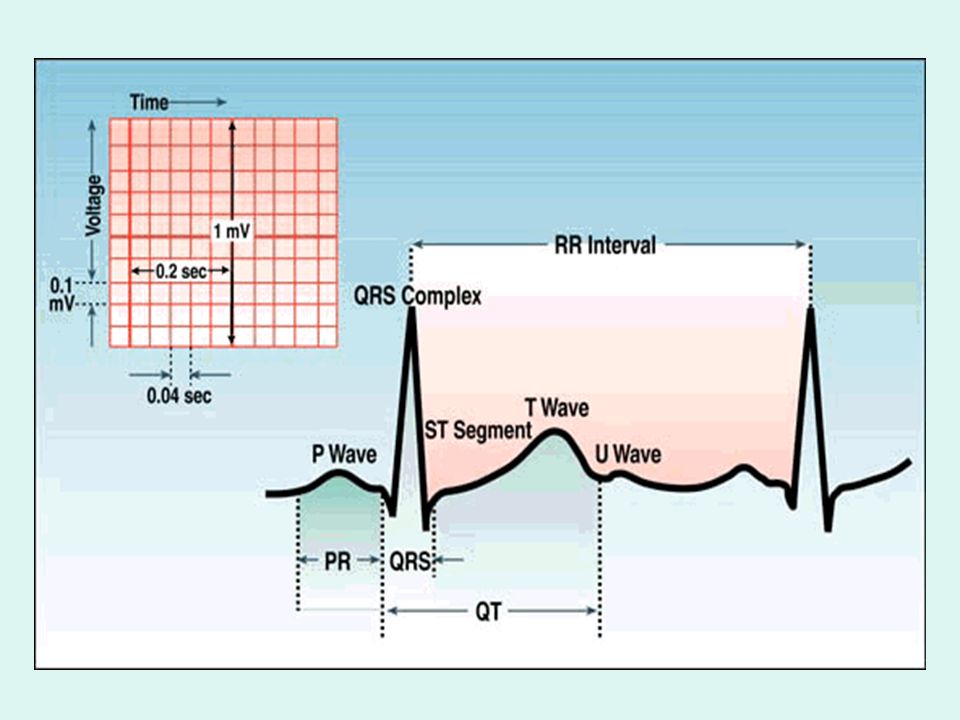
The “PQRST” P wave - Atrial depolarization
QRS - Ventricular depolarization T wave - Ventricular repolarization

7
Atrial depolarization
The PR Interval Atrial depolarization + delay in AV junction (AV node/Bundle of His) (delay allows time for the atria to contract before the ventricles contract)
 (delay allows time for the atria to contract before the ventricles contract)")
9
Qt Inteval QT – Represents time for both ventricular
Depolarisation and repolarisation.

11
Pacemakers of the Heart
SA Node - Dominant pacemaker with an intrinsic rate of beats/minute. AV Node - Back-up pacemaker with an intrinsic rate of beats/minute. Ventricular cells - Back-up pacemaker with an intrinsic rate of bpm.

12
The ECG Paper Horizontally Vertically One small box - 0.04 s
One large box s Vertically One large box mV

13
The ECG Paper (cont) 3 sec 3 sec Every 3 seconds (15 large boxes) is marked by a vertical line. This helps when calculating the heart rate.

14
Calibration

15
Normal Sinus Rhythm “Normal sinus rhythm occurs when the impulse originates in the sino Atrial node and travels through the conduction system in a normal sequence ,at a normal and regular rate” American Heart Association,(2000).homepage:Availablehttp:/
.homepage:Availablehttp:/")
16
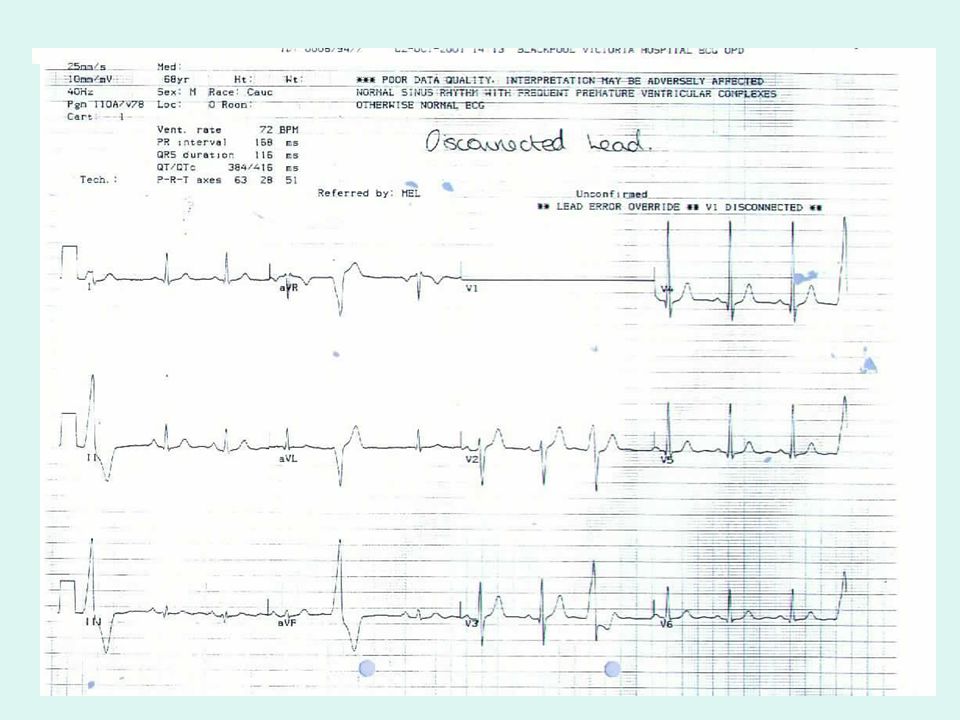
Normal Sinus Rhythm

17
ECG Interpretation A mystery? An enigma? Confusing? Difficult?

18
Criteria - P wave An upright rounded P-wave in leads II, III and AVF, and an inverted P-Wave in AVR which precede each QRS Complex. The P wave does not exceed 2.5mm in height. It does not exceed 3mm in width. A biphid P wave is seen in lead V1.

19
Criteria - PR interval PR Interval 0.12 - 0.20seconds.
Delay at AV node Protect ventricles Allow for ventricular filling

20
Criteria QRS complex Should not exceed 0.12 seconds in duration.
Should not exceed 27mm in height. Sharp narrow complex RS in V1, QRS in V6

21
Criteria T wave The deflection produced by repolarisation of the ventricles. No clearly defined range General rule - T wave should not be more than 1/2 the height of the preceding QRS

22
Criteria - QT interval QTc Interval
Should not exceed 0.42 seconds (QTc). QT interval corrected to the heart rate.
. QT interval corrected to the heart rate.")
23
Correction Calculation
QTc = measured Qt interval cycle length

24
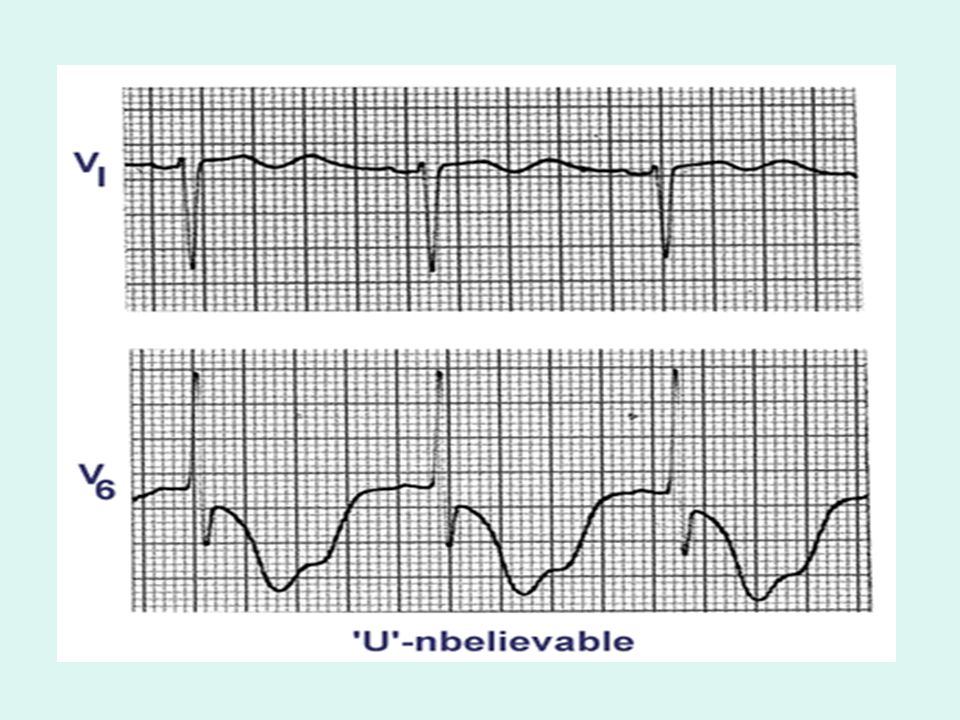
Criteria U wave The origin is uncertain
May represent repolarisation if the IVS May represent slow conduction of ventricular myocardium Prominent U waves are abnormal Usually most visible in V1-V4

25
Nomenclature - QRS The 1st negative deflection - Q
The 1st positive deflection - R The 2nd negative deflection or If a negative follows a positive - S

26
Nomenclature -QRS

27
Nomenclature - QRS

28
Nomenclature - QRS

29
Waves > 0.5mv (5mm) high Waves < 0.5mv (5mm) high
Capital letters e.g. QRS Waves < 0.5mv (5mm) high Lower case e.g. qrs
 high. Lower case e.g. qrs.")
30
Intervals P wave duration measured? PR interval measured?
QRS interval measured? QT interval measured?

31
Amplitudes P wave height measured? QRS height measured?

32
Segments PR segment measured? ST segment measured?

33
Limb leads Measurements - lead II QRS Axis P wave Axis

34
Chest Leads Progression of R waves throughout the chest leads
Transitional Zone Phases of Activation

35
Depolarisation Stages
1 2 3

38
Typical complexes in the Pre-cordial leads
V V V V V V6

39
Progression of R waves throughout the chest leads
Size of the R wave should increase from V1 to V6. V4 Usually at the Apex (Transitional Zone where the first negative wave appears).
.")
40
R Wave Progression

41
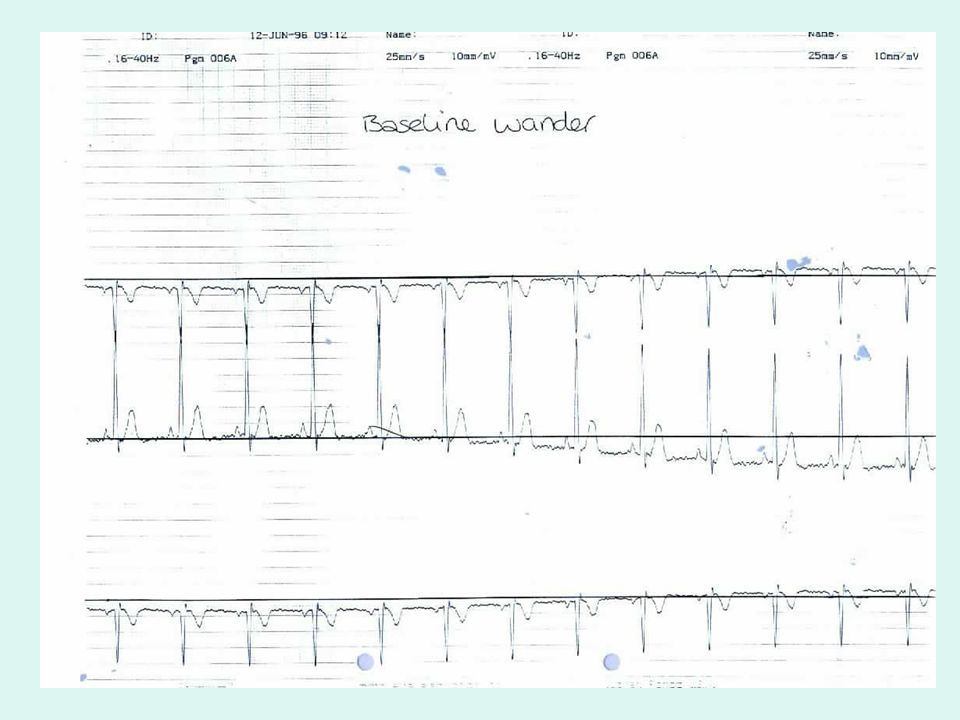
Practical Challenges

45
Sinus Rhythms Sinus Bradycardia Sinus Tachycardia Sinus arrhythmia

46
NSR Parameters Rate 60 - 100 bpm Regularity regular P waves normal
PR interval s QRS duration s QT interval not exceed seconds. U wave

47
Sinus Bradycardia - Rate < 60 b pm
Etiology: SA node is depolarizing slower than normal, impulse is conducted normally (i.e. normal PR and QRS interval).
.")
48
Sinus Tachycardia - Rate > 100 bpm
Etiology: SA node is depolarizing faster than normal, impulse is conducted normally. Remember: sinus tachycardia is a response to physical or psychological stress, not a primary arrhythmia.

49
Sinus arrythmia Rate – variable
Etiology: SA node is depolarizing t a variable rate , impulse is conducted normally (i.e. normal PR and QRS interval).
.")
50
Normal Rhythms !!! *Sinus Arrest*
Considered a ‘Sinus rhythm’ but is abnormal

51
Rhythm 1 Rate? 130 bpm Regularity? regular P waves? normal
PR interval? 0.16 s QRS duration? 0.08 s Interpretation? Sinus Tachycardia

52
Rhythm 2 Rate? 30 bpm Regularity? regular P waves? normal PR interval?
QRS duration? 0.10 s Interpretation? Sinus Bradycardia

53
ECG INTERPRETATION If the normal ECG is known then interpretation of abnormals becomes easier

54
EASY ?

55
References/Bibliography
ctmed

Similar presentations


 node Atrioventricular (AV) node.>")
>")


>")