Download presentation
Presentation is loading. Please wait.

2
Flooding and Property Markets Previous studies Flooding in Australia Brisbane floods 2011 Flooding and media coverage

3
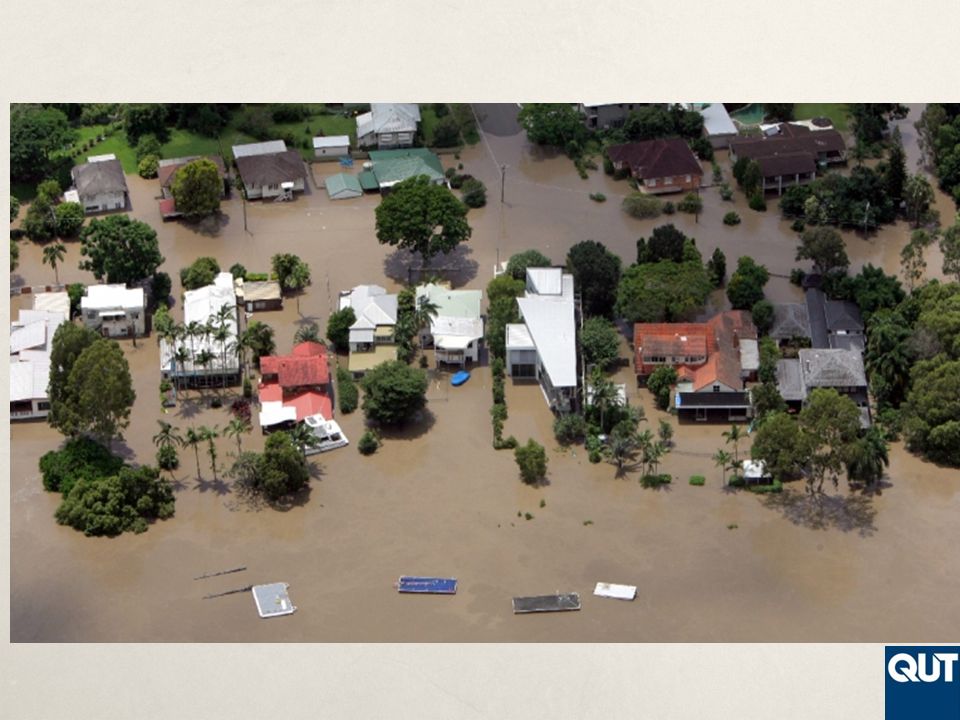
Brisbane 2011

8
Research Methodology Study area Suburb selection Research data Residential market issues Sale listings Rental listings Sales

9
Flood Affected Suburbs SuburbLocationStatusSuburbLocationStatus Albion NorthHigh Milton NorthMiddle Ascot NorthHigh Newmarket NorthMiddle Bulimba SouthHigh Oxley WestLow Chelmer WestHigh Paddington NorthHigh East Brisbane SouthMiddle Redbank plains WestLow Fairfield SouthMiddle Rocklea WestLow Graceville WestMiddle Sherwood WestMiddle Herston NorthMiddle South Brisbane SouthMiddle Indooroopilly WestHigh St lucia NorthHigh Jindalee WestLow Tennyson WestMiddle Kelvin Grove NorthMiddle Toowong WestHigh Macgregor SouthLow Yeronga SouthMiddle

10
Non Flood Affected Suburbs SuburbLocationStatusSuburbLocationStatus Alexandra Hills NorthLow Hamilton NorthHigh Ashgrove NorthHigh Joyner WestLow Bardon NorthHigh Kingston NorthMiddle Bracken Ridge NorthLow Morayfield NorthLow Carindale SouthMiddle Mt Gravatt SouthMiddle Chapel Hill WestHigh North lakes NorthMiddle Clayfield NorthMiddle Sandgate NorthMiddle Cleveland SouthLow Spring Hill NorthHigh Grange WestMiddle Sunnybank Hills SouthMiddle Greenslopes SouthMiddle Wynnum SouthLow

11
Research Results Residential property house sales listings Residential property unit sales listings Residential property house rental listings Residential property unit rental listings Residential property house sales transactions Residential property unit sales transactions

12
Total Flood Property Listings: Units and Houses

13
House Listings: Flood v Non Flood

14
Unit Listings: Flood v Non Flood

15
Flood House Listing Comparison: Suburb Value

16
Comparison Low Value House Listings: Flood v Non Flood

17
Comparison Middle Value House Listings: Flood v Non Flood

18
Comparison Sales Listing High Value Suburbs

19
Rental Listings

20
Total Flood Property Rental Listings: Units and Houses

21
House Rental Listings: Flood v Non Flood

22
Unit Rental Listings: Flood v Non Flood

23
Comparison Low Value House Rental Listings: Flood v Non Flood

24
Comparison Middle Value House Rental Listings: Flood v Non Flood

25
Comparison High Value House Sales: Flood v Non Flood

26
Sales

27
Total Residential Property Sales

28
House Sales: Flood v Non Flood

29
Comparison Low Value House Sales: Flood v Non Flood

30
Comparison Middle Value House Sales: Flood v Non Flood

31
Comparison High Value House Sales: Flood v Non Flood

32
Sales to Listing Percentage: Low Value Suburbs

33
Sales to Listing Percentage: Middle Value Suburbs

34
Sales to Listing Percentage: High Value Suburbs

35
Conclusions The number of sale listings falls immediately following the flood for affected suburbs, with the fall in house listings greater than the fall in unit listings. Non affected suburbs show an increase in sales listings immediately after a flood. After the initial major fall in listings, the listings in the flood affected suburbs increase at a greater rate compared to the non flood suburbs Listings in the lower value suburbs decline for a 5 week period, 4 weeks for the middle value suburbs and only 3 weeks for the high value suburbs, with the increase considerably greater than equivalent non flood suburbs

36
Conclusions Rental listings in the flood affected suburbs decline significantly in the 3 to 5 weeks following the flood, especially for units. Flood victims appear to prefer to rent in the same location. Those flood victims who leave the area tend to rent units rather than houses, particularly the high value market. In the week following the flood there was no change in the number of sales in the non flood suburbs, but a decrease of 40% in the flood affected suburbs. After a month, sales in the flood affected suburbs increased by 60%, compared to 20% for non affected suburbs

37
Conclusions The impact on property sales is greater in the low and middle value suburbs compared to the higher value suburbs. This could be a factor of insurance Lower value suburbs have the greatest variation in sales to listings, especially for the first 6 weeks flowing the flood, at which point the markets tend to trend in similar way

Similar presentations