Download presentation
Presentation is loading. Please wait.

2
Sampling Sources: -EPIET Introductory course, Thomas Grein, Denis Coulombier, Philippe Sudre, Mike Catchpole -IDEA Brigitte Helynck, Philippe Malfait, Institut de veille sanitaire Modified: Denise Antona, EPIET 2003

3
Objectives of presentation Definition of sampling Why do we use samples? Concept of representativeness Main methods of sampling Sampling error Sample size calculation

4
Definition of sampling Procedure by which some members of a given population are selected as representatives of the entire population

5
Definition of sampling terms Sampling unit –Subject under observation on which information is collected Sampling fraction –Ratio between the sample size and the population size Sampling frame –Any list of all the sampling units in the population Sampling scheme –Method of selecting sampling units from sampling frame

6
Why do we use samples ? Get information from large populations –At minimal cost –At maximum speed –At increased accuracy –Using enhanced tools

7
Sampling Precision Cost

8
What we need to know Concepts –Representativeness –Sampling methods –Choice of the right design Calculations –Sampling error –Design effect –Sample size

9
Sampling and representativeness Sample Target Population Sampling Population Target Population Sampling Population Sample

10
Representativeness Person Demographic characteristics (age, sex…) Exposure/susceptibility Place (ex : u rban vs. rural) Time Seasonality Day of the week Time of the day Ensure representativeness before starting, confirm once completed !!!!!!
 Time Seasonality Day of the week Time of the day Ensure representativeness before starting, confirm once completed !!!!!!.")
11
Types of samples Non-probability samples Probability samples

12
Non probability samples Quotas Sample reflects population structure Time/resources constraints Convenience samples (purposive units) Biased Best or worst scenario Probability of being chosen : unknown
 Biased Best or worst scenario Probability of being chosen : unknown")
13
Probability samples Random sampling Each subject has a known probability of being chosen Reduces possibility of selection bias Allows application of statistical theory to results

14
Sampling error No sample is the exact mirror image of the population Magnitude of error can be measured in probability samples Expressed by standard error –of mean, proportion, differences, etc Function of –amount of variability in measuring factor of interest –sample size

15
Methods used in probability samples Simple random sampling Systematic sampling Stratified sampling Multistage sampling Multiphase sampling Cluster sampling

16
Quality of an estimate Precision & validity No precision Random error ! Precision but no validity Systematic error (Bias) !
 !.")
17
Simple random sampling Principle –Equal chance of drawing each unit Procedure –Number all units –Randomly draw units

18
Simple random sampling Advantages –Simple –Sampling error easily measured Disadvantages –Need complete list of units –Does not always achieve best representativeness –Units may be scattered

19
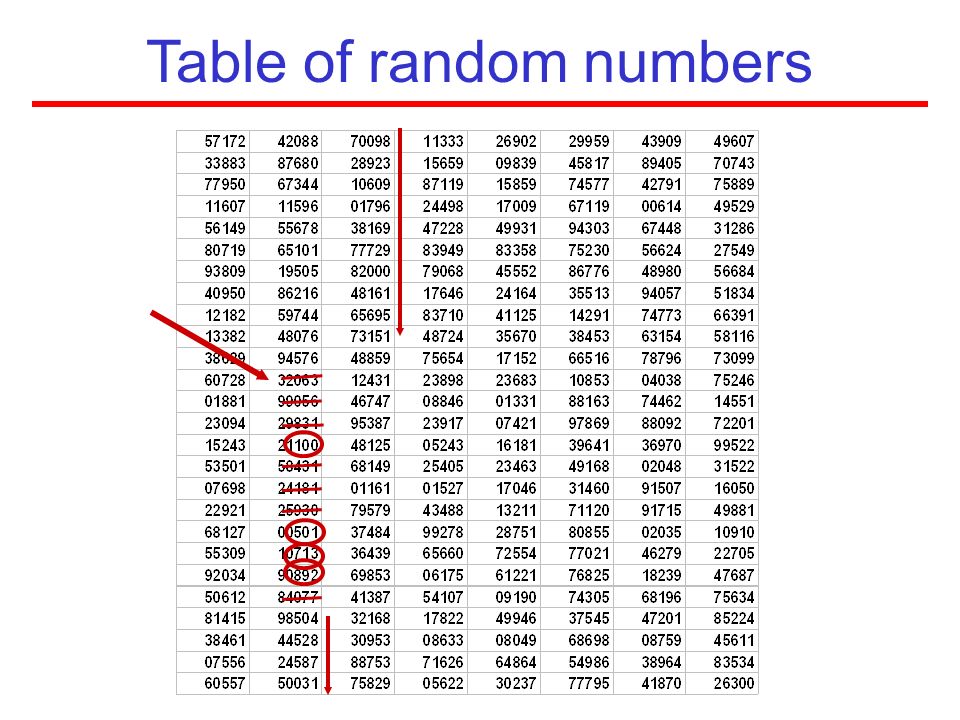
Example: evaluate the prevalence of tooth decay among the 1200 children attending a school List of children attending the school Children numerated from 1 to 1200 Sample size = 100 children Random sampling of 100 numbers between 1 and 1200 How to randomly select? Simple random sampling

21
Table of random numbers

22
EPITABLE: random number listing

24
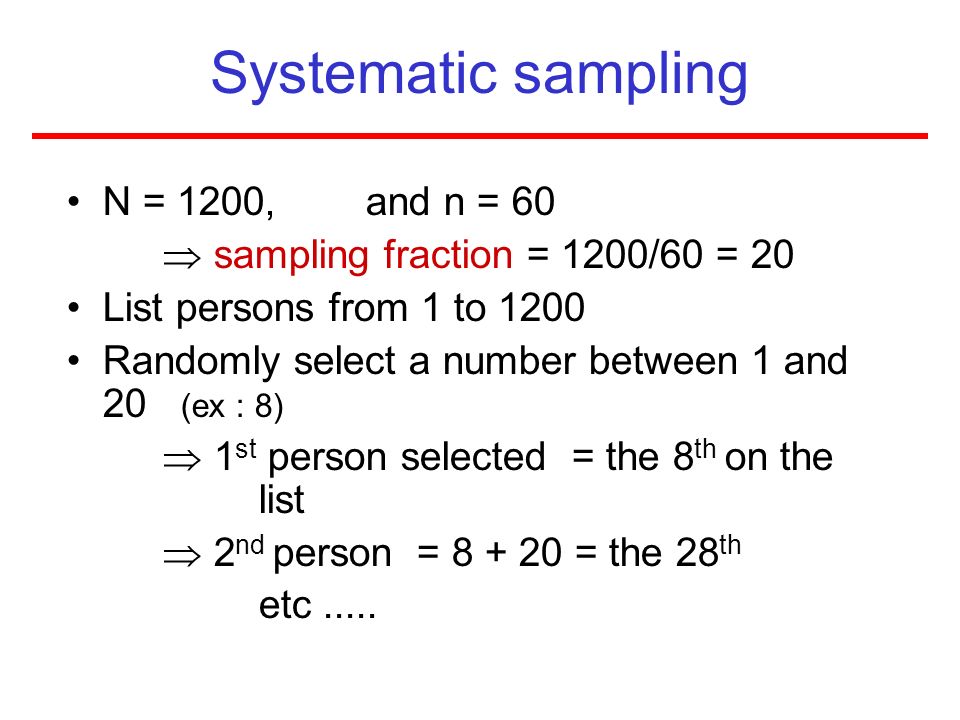
Systematic sampling N = 1200, and n = 60 sampling fraction = 1200/60 = 20 List persons from 1 to 1200 Randomly select a number between 1 and 20 (ex : 8) 1 st person selected = the 8 th on the list 2 nd person = 8 + 20 = the 28 th etc.....
 1 st person selected = the 8 th on the list 2 nd person = = the 28 th etc.....")
25
Systematic sampling

26
1 2 3 4 5 6 7 8 9 10 11 12 13 14 15 31 32 33 34 35 36 37 38 39 40 41 42 43 44 45 16 17 18 19 20 21 22 23 24 25 26 27 28 29 30 46 47 48 49 50 51 52 53 54 55 ……..

27
Systematic sampling

28
Stratified sampling Principle : –Classify population into internally homogeneous subgroups (strata) –Draw sample in each strata –Combine results of all strata
 –Draw sample in each strata –Combine results of all strata")
29
Stratified sampling Advantages –More precise if variable associated with strata –All subgroups represented, allowing separate conclusions about each of them Disadvantages –Sampling error difficult to measure –Loss of precision if very small numbers sampled in individual strata

30
Example: Stratified sampling Determine vaccination coverage in a country One sample drawn in each region Estimates calculated for each stratum Each stratum weighted to obtain estimate for country (average)
")
31
Multiple stage sampling Principle = consecutive samplings example : sampling unit = household –1 rst stage : drawing areas or blocks –2 nd stage : drawing buildings, houses –3 rd stage : drawing households

32
Cluster sampling Principle –Random sample of groups (“clusters”) of units –In selected clusters, all units or proportion (sample) of units included
 of units –In selected clusters, all units or proportion (sample) of units included")
33
Example: Cluster sampling Section 4 Section 5 Section 3 Section 2Section 1

34
Cluster sampling Advantages –Simple as complete list of sampling units within population not required –Less travel/resources required Disadvantages –Imprecise if clusters homogeneous and therefore sample variation greater than population variation (large design effect) –Sampling error difficult to measure
 –Sampling error difficult to measure")
35
EPI cluster sampling To evaluate vaccination coverage: Without list of persons Total population of villages Randomly choose 30 clusters 30 cluster of 7 children each= 210 children

36
Drawing the clusters You need : –Map of the region –Distribution of population (by villages or area) –Age distribution (population 12-23 m :3%) 1600 220 3200 400 800 200 1200 200 1600 400 53000 7300 106000 13000 26500 6600 40000 6600 53000 13200 ABCDEFGHIJABCDEFGHIJ 12-23Pop.Village
 –Age distribution (population m :3%) ABCDEFGHIJABCDEFGHIJ 12-23Pop.Village")
37
Distribution of the clusters ABCDEFGHIJABCDEFGHIJ 1600 220 3200 400 800 200 1200 200 1600 400 1600 1820 5020 5420 6220 6420 7620 7820 9420 9820 Total population = 9820 Compute cumulated population

38
Distribution of the clusters Then compute sampling fraction : K= = 327 Draw a random number (between 1 and 327) Example: 62 Start from the village including “62” and draw the clusters adding the sampling fraction 9820 30 ABCDEFGHIJABCDEFGHIJ 1600 1820 5020 5420 6220 6420 7620 7820 9420 9820 I I I I I I I I I I I I I I I I I I
 Example: 62 Start from the village including 62 and draw the clusters adding the sampling fraction ABCDEFGHIJABCDEFGHIJ I I I I I I I I I I I I I I I I I I")
39
Drawing households and children On the spot Go to the center of the village, choose direction (random) Number the houses in this direction Ex: 21 Draw random number (between 1 and 21) to identify the first house to visit From this house progress until finding the 7 children ( itinerary rules fixed beforehand)
 Number the houses in this direction Ex: 21 Draw random number (between 1 and 21) to identify the first house to visit From this house progress until finding the 7 children ( itinerary rules fixed beforehand)")
40
Design effect Global variance p(1-p) Var srs = ---------- n Cluster variance p= global proportion pi= proportion in each stratum n= number of subjects k= number of strata Σ (pi-p)² Var clus = ------------- k(k-1) Design effect = ------------------ Var srs Var clust srs= simple random sampling
 Var srs = n Cluster variance p= global proportion pi= proportion in each stratum n= number of subjects k= number of strata Σ (pi-p)² Var clus = k(k-1) Design effect = Var srs Var clust srs= simple random sampling")
41
EPITABLE: Calculating design effect

42
Selecting a sampling method Population to be studied –Size/geographical distribution –Heterogeneity with respect to variable Level of precision required Resources available Importance of having a precise estimate of the sampling error

43
Steps in estimating sample size Identify major study variable Determine type of estimate (%, mean, ratio,...) Indicate expected frequency of factor of interest Decide on desired precision of the estimate Decide on acceptable risk that estimate will fall outside its real population value Adjust for estimated design effect Adjust for expected response rate (Adjust for population size? In case of small size population only)
.")
44
Sample size formula in descriptive survey z: alpha risk express in z-score p: expected prevalence q: 1 - p d: absolute precision g: design effect z² * p * q 1.96²*0.15*0.85 n = -------------- ---------------------- = 544 d²0.03² Cluster sampling z² * p * q 2*1.96²*0.15*0.85 n = g*-------------- ------------------------ = 1088 d² 0.03² Simple random / systematic sampling

45
EPITABLE: cluster sample size calculation

46
Place of sampling in descriptive surveys Define objectives Define resources available Identify study population Identify variables to study Define precision required Establish plan of analysis (questionnaire) Create sampling frame Select sample Pilot data collection Collect data Analyse data Communicate results Use results
 Create sampling frame Select sample Pilot data collection Collect data Analyse data Communicate results Use results")
47
Conclusions Probability samples are the best Beware of … –refusals –absentees –“do not know”

48
Conclusions If in doubt… Call a statistician !!!!

Similar presentations


. Estimate a corresponding sample statistic Sample must be representative.>")


