Download presentation
Presentation is loading. Please wait.

1
Impacts of Municipal Conservation and Reuse Strategies in Region C Dan Hardin Director, Water Resource Planning Texas Water Development Board

2
Senate Bill 3 “The Study Commission shall:” (3) determine whether water demand in the Region C Regional Water Planning Area may be reduced through additional conservation and reuse measures so as to postpone the need for additional water supplies
 determine whether water demand in the Region C Regional Water Planning Area may be reduced through additional conservation and reuse measures so as to postpone the need for additional water supplies")
5
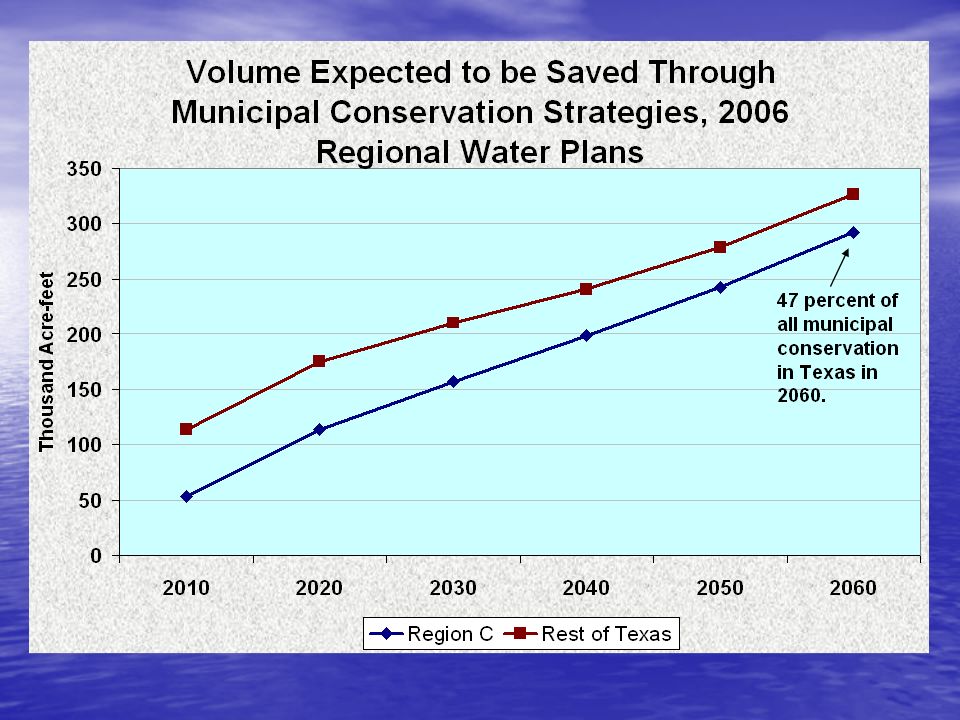
By 2030, Region C expects to meet 33% of its municipal demand through conservation and reuse strategies.

6
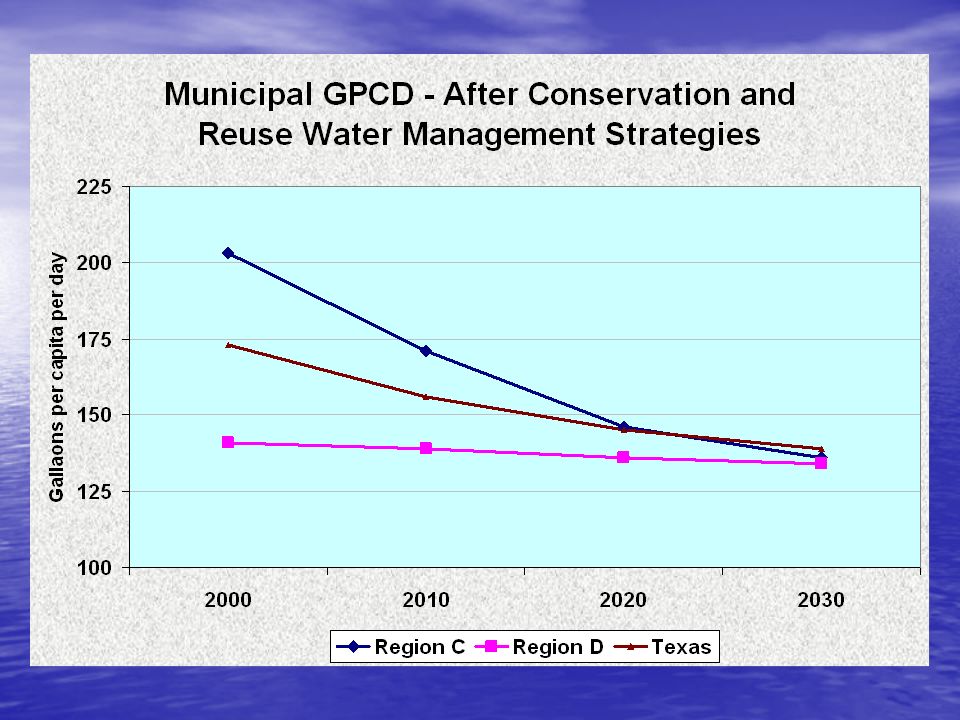
Gallons per capita per day Measure of municipal water use, defined as the average daily total of residential plus commercial plus institutional water use, divided by total resident population. Measure of municipal water use, defined as the average daily total of residential plus commercial plus institutional water use, divided by total resident population. Water is used at home and at place of work. Water is used at home and at place of work. In 2007:DallasSan Antonio In 2007:DallasSan Antonio Total GPCD 240 150 Total GPCD 240 150 Residential GPCD 92 86 Residential GPCD 92 86

7
Influences on Gallons per capita per day All other things equal, GPCD will be higher in regions/cities where the daytime population is augmented by commuters who live in a different region/city. All other things equal, GPCD will be higher in regions/cities where the daytime population is augmented by commuters who live in a different region/city. –Dallas adds 290,000 net commuters on a daily basis (23% of the population), San Antonio adds less than 50,000 (3.8% of the population) –In the western counties of Region D (Delta, Hopkins, Hunt, Lamar, Rains, Van Zandt, Wood), 22% of the total workforce commuted to a job in Region C (2006 data).
, San Antonio adds less than 50,000 (3.8% of the population) –In the western counties of Region D (Delta, Hopkins, Hunt, Lamar, Rains, Van Zandt, Wood), 22% of the total workforce commuted to a job in Region C (2006 data)..")
8
Planning Regions ranked by Municipal GPCD, 2000 P133 P133 D141 D141 L149 L149 H157 H157 I160 I160 M164 M164 B165 B165 N165 N165 K168 K168 O172 O172 G174 G174 E176 E176 F198 F198 C203 C203 J205 J205 A214 A214

9
Current Progress Toward GPCD Goals Region CRegion D Estimated GPCD, 2000203141 Projected GPCD, 2010 (after conservation & reuse)171139 conservation & reuse)171139 Actual GPCD, 2007172150
 conservation & reuse) Actual GPCD,")
10
Planning Regions ranked by Municipal GPCD, 2030 (after savings from conservation and reuse strategies) P123 P123 L127 L127 E128 E128 K129 K129 D134 D134 C136 C136 H137 H137 M142 M142 I146 I146 G154 G154 N155 N155 O156 O156 B157 B157 A169 A169 F171 F171 J176 J176
 P123 P123 L127 L127 E128 E128 K129 K129 D134 D134 C136 C136 H137 H137 M142 M142 I146 I146 G154 G154 N155 N155 O156 O156 B157 B157 A169 A169 F171 F171 J176 J176")
12
Is More Conservation Enough? Would additional conservation by Region C be sufficient to eliminate all municipal needs? Would additional conservation by Region C be sufficient to eliminate all municipal needs? Needs – Projected water demands in excess of existing supplies that would be physically and legally available during a repeat of the drought of record. Needs – Projected water demands in excess of existing supplies that would be physically and legally available during a repeat of the drought of record.

13
Contribution of Conservation and Reuse to Region C Municipal Needs Municipal Needs Conservation and Reuse Remaining Needs 2010291,008268,26422,744 2020578,142522,91955,223 2030829,235678,715150,520 20401,082,239730,054352,185 20501,380,144788,689591,455 20601,737,037848,379888,658

14
Further Savings if Region C GPCD Equal to Region D Remaining Needs Additional Savings, “Equal” GPCD Still Remaining Needs 201022,744237,481 202055,22389,235 2030150,52020,373130,147 2040352,18534,434317,751 2050591,45577,693513,762 2060888,658146,603742,055

15
What Part of Remaining Needs Could be Met if Region C GPCD was Equal to Region D GPCD? 2030 – 13.5% 2030 – 13.5% 2040 – 9.8% 2040 – 9.8% 2050 – 13.1% 2050 – 13.1% 2060 – 16.5% 2060 – 16.5% Even if Region C’s GPCD were reduced to the same level as Region D, there would be remaining unmet municipal needs in Region C of nearly 750,000 acre-feet in 2060.

Similar presentations


![Western Resource Advocates Linda Stitzer westernresources.org] GUAC Meeting 9/18/2012.](/12/3500887/big_thumb.jpg "Western Resource Advocates Linda Stitzer westernresources.org] GUAC Meeting 9/18/2012.>")
>")


 Trends in Texas>")


