Download presentation
Presentation is loading. Please wait.

1
Encoding and Simple Manipulation
Sound: Introduction Encoding and Simple Manipulation

2
Sound is made when something vibrates
Air molecules oscillate back and forth from their equilibrium position, affecting their neighbors

3
Sound waves are pressure waves
As molecules oscillate back and forth, areas of high and low pressure occur Called compressions and rarefactions, respectively

4
Sound waves are longitudinal
Motion is parallel to direction of energy transport Representation of sound by a sine wave is merely an attempt to illustrate the sinusoidal nature of the pressure-time fluctuations

5
Sound waves are longitudinal
Plot pressure fluctuations over time encountered by a fixed detector

6
Properties of sound waves
Frequency: cycles per second (Hz) Amplitude: distance from 0
 Amplitude: distance from 0.")
7
Psychoacoustics: Human Perception of Sound
Ear serves as transducer: coverts sound energy to mechanical energy to nerve impulse transmitted to brain

8
Psychoacoustics: Human Perception of Sound
Pitch Loudness Timbre

9
Psychoacoustics: Human Perception of Sound
Pitch – frequency Loudness – amplitude Timbre – combination of various frequencies

10
Pitch Humans hear frequencies between 20 Hz and 20,000 Hz
frequency = pitch

11
Pitch Humans hear frequencies between 20 Hz and 20,000 Hz
frequency = pitch Hearing works on ratios for pitch… We hear difference between 200 Hz and 400 Hz, the same as 500 Hz and 1000 Hz

12
Loudness Perception of volume is related logarithmically to changes in amplitude amplitude = pitch

13
Loudness If one sound is 10x times more intense than another sound, then it has a sound level which is 10*x more decibels than the less intense sound. Intensity is very objective quantity; can be measured with sensitive instrumentation Loudness is more subjective response; will vary with a number of factors (e.g. age, frequency)
")
14
Decibel is a logarithmic measure
A decibel is a ratio between two intensities: 10 * log10(I1/I2) As an absolute measure, it’s in comparison to threshold of audibility 0 dB can’t be heard. Normal speech is 60 dB. A shout is about 80 dB
 As an absolute measure, it’s in comparison to threshold of audibility. 0 dB can’t be heard. Normal speech is 60 dB. A shout is about 80 dB.")
15
Digitizing Sound Analog-to-digital conversion: measure amplitude at an instant as a number Instantaneous measure is called a sample

16
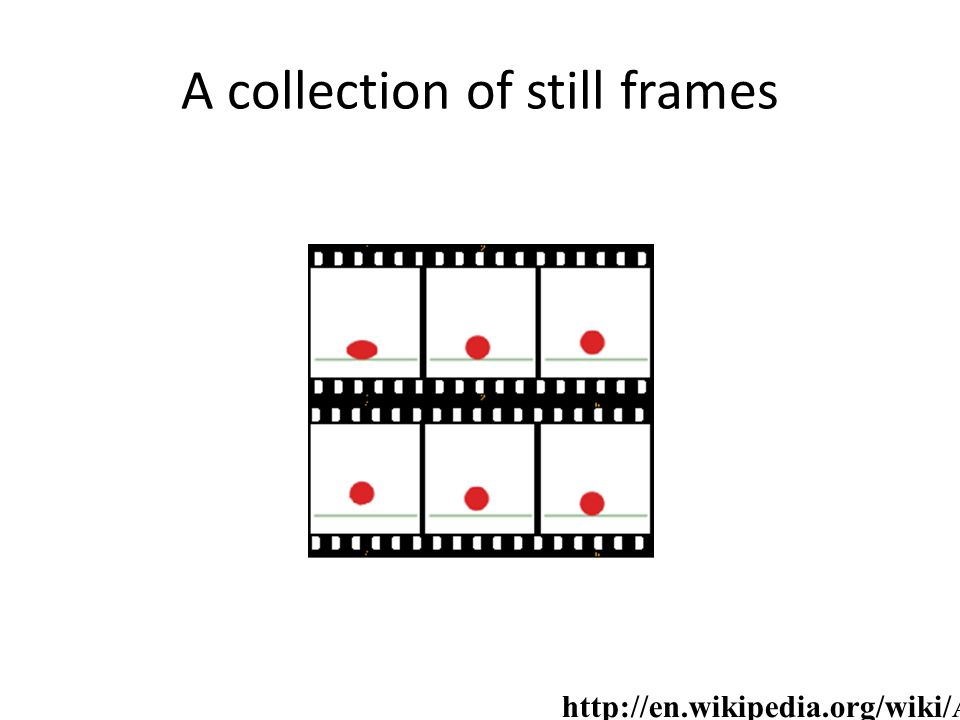
Understanding how computers represent sound
Consider how a film represents motion… Movie is made by taking still photos in rapid sequence at a constant rate, usually twenty-four frames per second When the photos are displayed in sequence at that same rate, it fools us into thinking we are seeing continuous motion, even though we are actually seeing twenty-four discrete images per second

17
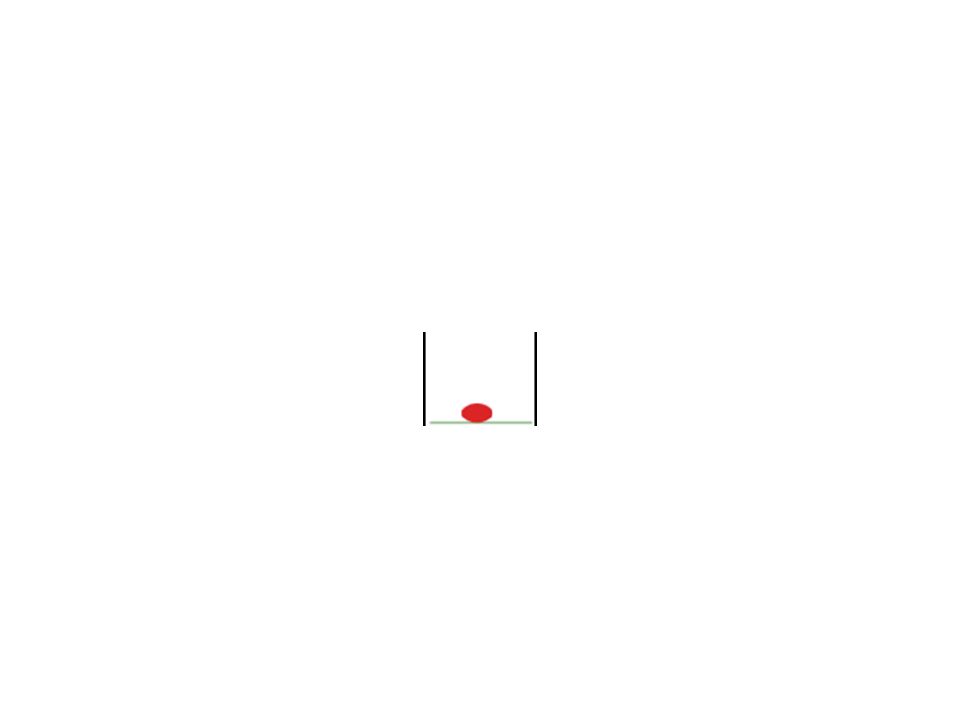
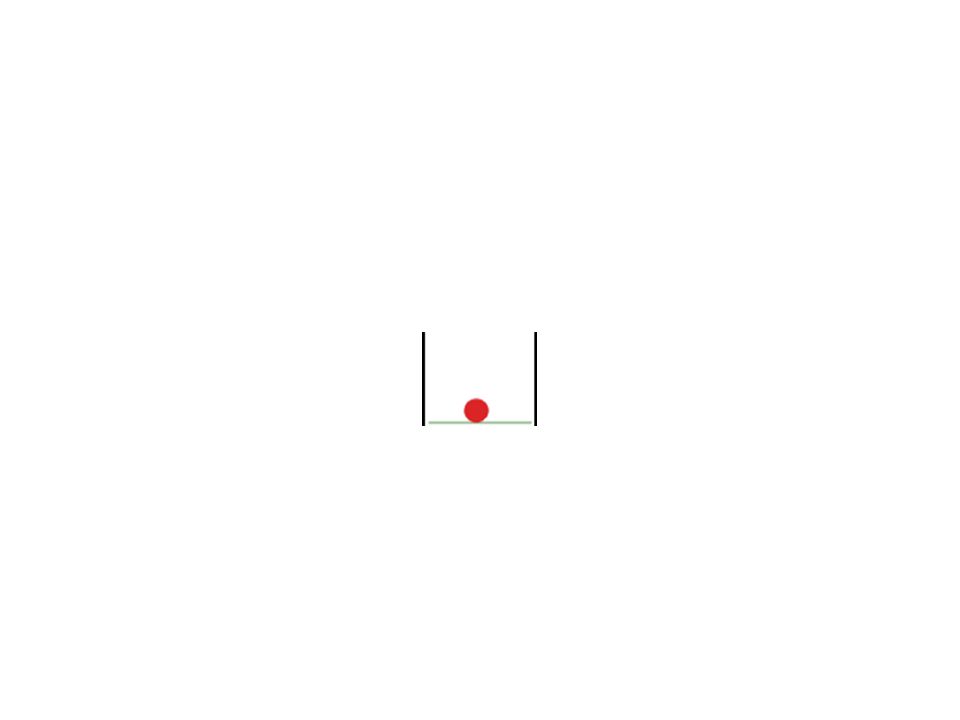
A collection of still frames
30
How computers represent sound
Digital recording of sound works on the same principle We take many discrete samples of the sound wave's instantaneous amplitude, store that information, then later reproduce those amplitudes at the same rate to create the illusion of a continuous wave

31
How often should we take samples?
sampling rate: number of samples taken per second Nyquist Theorem: need to take twice as many samples as the highest frequency we wish to record Sampling rate = 2 * max sound wave frequency

32
How often should we take samples?
sampling rate: number of samples taken per second Nyquist Theorem: need to take twice as many samples as the highest frequency we wish to record Sampling rate = 2 * max sound wave frequency CD quality is 44,100 samples per second what is the max frequency a CD can represent?

33
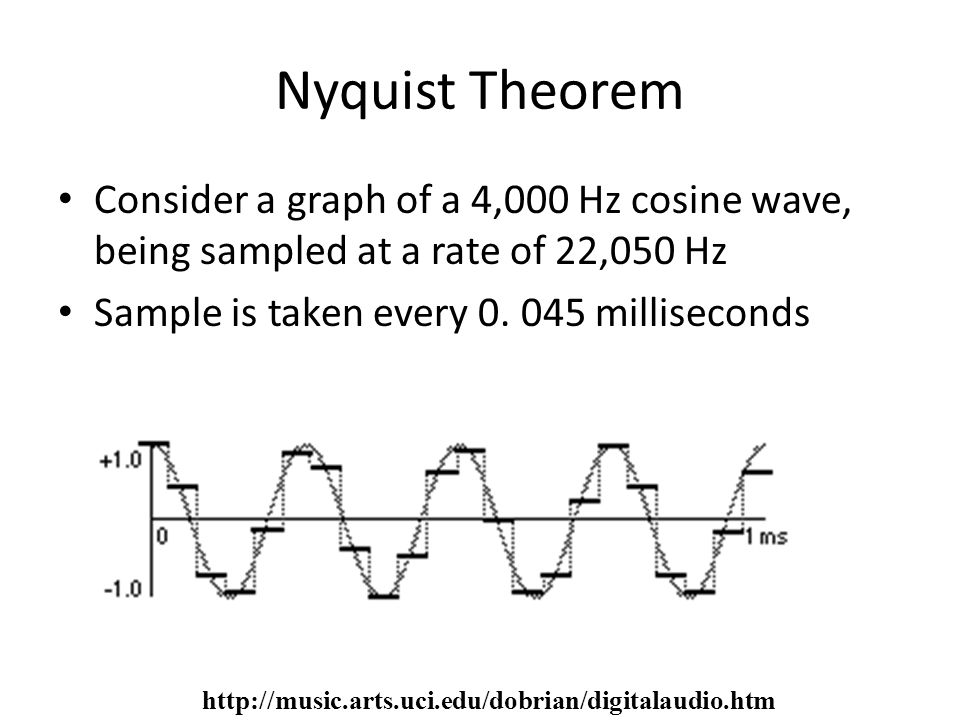
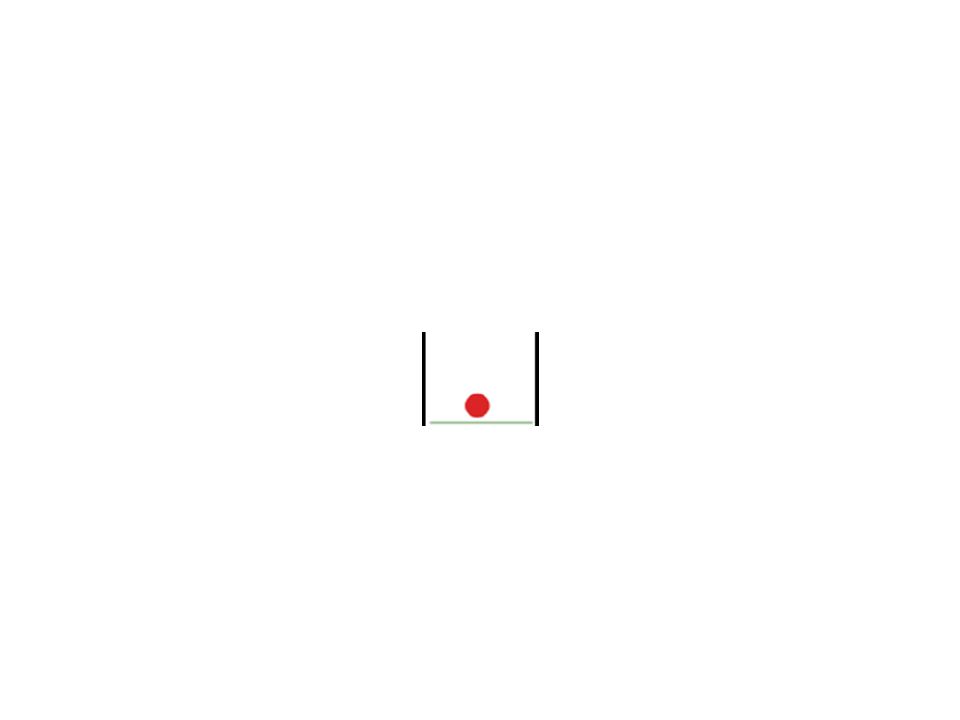
Nyquist Theorem Consider a graph of a 4,000 Hz cosine wave, being sampled at a rate of 22,050 Hz Sample is taken every milliseconds
34
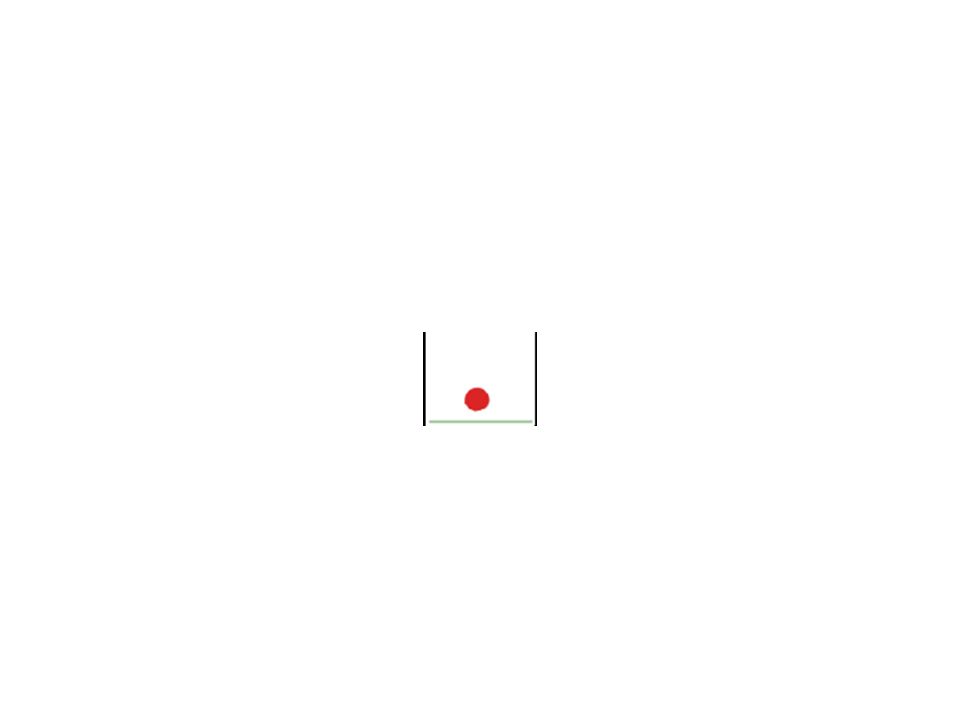
Nyquist Theorem Consider same 4,000 Hz cosine wave sampled at 6,000 Hz
Sample is taken every milliseconds Wave completes more than 1/2 cycle per sample

35
Digitizing sound with the computer: bit depth
The range of possible sample values depends on the number of bits used to store each sample Common bit-depths: 8 and 16

36
16 bits per sample: +/- 32K Each sample can be between -32,768 and 32,767 Why such a bizarre number? Because 32, , = 216 < 0 i.e. 16 bits, or 2 bytes > 0 Compare this to for light intensity (i.e. 8 bits or 1 byte giving us 256 different values)
")
37
Properties of sound Sound wave Frequency Amplitude Wavelength Period
Digitized sound Sampling rate Bit depth Playback rate

Similar presentations


 Introduction to Scientific Computation and Programming CLI Engineering.>")


