Download presentation
Presentation is loading. Please wait.

1
Correlation 11/1/2012

2
Readings Chapter 8 Correlation and Linear Regression (Pollock) (pp. 182-187) Chapter 8 Correlation and Regression (Pollock Workbook)
 Chapter 8 Correlation and Regression (Pollock Workbook).")
3
Homework Due 11/6 – Chapter 7 Pollock Workbook Question 1 – A, B, C, D, E, F Question 2 – A, B, C, D Question 3 -A, B, C, D Question 5 – A, B, C, D, E

4
OPPORTUNITIES TO DISCUSS COURSE CONTENT

5
Office Hours For the Week When – Monday 8-1 – Tuesday 8-12 – And appointment

6
Course Learning Objectives Students will be able to interpret and explain empirical data. As this course fulfills the Computational Skills portion of the University degree plan, students will achieve competency in conducting statistical data analysis using the SPSS software program.

7
HOW TO CONTROL FOR A VARIABLE? Adding a Third Variable

8
A Third Variable the relationship between two variables may be spurious, weak or even too strong "controlling" for a third variable is a method of removing or separating the effects of another variable. This gets at the underlying relationship

9
Why Add the Third Variable Is there an antecedent variable at play? Is the observation different for different groups of people

10
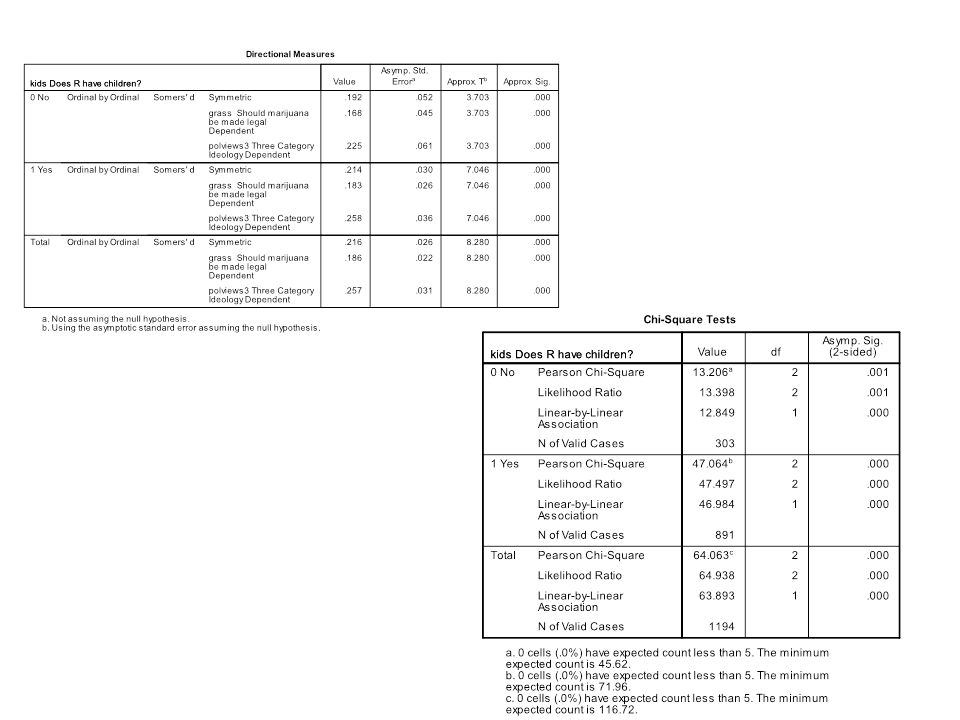
Marijuana and a Third Variable H1: People with children will have different views on legalization than others of the same ideology Cross-tabs – Input Row Variable – Input Column Variable – To control for a variable place it in the area that says Layer 1 of 1.

13
Views on Homosexuality, Party ID and Race DV- homosex2 IV- partyid3 Control- race 2

14
DATA AND DATASETS

15
About the paper Your Topic needs to be approved – 11/16 is the approval date for extra credit on the final No Required length – Different statistical methods – Different sized tables

16
About the paper One Dependent variable At least four independent variables

17
Thinking about your topic In Capstone you try to justify/advocate by using the words “should” or “ought” in your title In this paper you want to explain/describe/predict by using the words “why” or “what” in your title.

18
About your data It must be in SPSS format It must be secondary data You do not want to use time-series data

19
Data Sets Use one from the CD – NES – GSS – States – World

20
Pew Data Center Pew Research Center – http://www.people-press.org/category/datasets/ http://www.people-press.org/category/datasets/ Locate a dataset – Search the codebook for variables – Narrow down the ones you want – Email me I will get the dataset for you

21
Finally Correlations You have been waiting to use this

22
What is correlation? Any relationship between two variables Correlation does not mean causation

23
What Could Be Happening? Variable A influences variable B Variable B influences variable A It is a coincidence Some other variable (C) influences both A and B
 influences both A and B.")
24
Correlation Coefficients Pearson’s Product Movement (Pearson’s r) A way of measuring the goodness of fit between two continuous variables Note the lower case r
 A way of measuring the goodness of fit between two continuous variables Note the lower case r")
25
Rules on Correlations Variables must be continuous. You cannot use ordinal or nominal variables here Small samples >30 can give you odd results

26
Measuring Pearson’s r Measure from -1 to 0 to 1. – -1 means a perfect negative relationship – 0 is the absence of any relationship – +1 is a perfect positive relationship Like Somers’ D, Pearson's "r" scores tell us – Direction – Strength of Association – Statistical significance of the measure

27
PEARSON'S r's are PRE Measures! Squaring the (r) value provides a measure of how much better we can do in predicting the value of the d.v by knowing the independent variable. We call this a r 2 (r-square) value.
 value provides a measure of how much better we can do in predicting the value of the d.v by knowing the independent variable. We call this a r 2 (r-square) value..")
28
Significance and Strength Significance Levels: We use the.05 level Count your Stars (if available) *=significant at.05 **= significant at.01 No Stars= No Significance Relationship strengths of r-square values –.000 to.10 = none- –.11-.20 weak-moderate –.20-.35 moderate –.35-.50 moderate- strong –.50 there is a strong relationship
 *=significant at.05 **= significant at.01 No Stars= No Significance Relationship strengths of r-square values –.000 to.10 = none- – weak-moderate – moderate – moderate- strong –.50 there is a strong relationship")
29
An Example from long ago

30
The Previous Example We Square the correlation value.733 – This gives us a value of.537 (r-square) From this we can say 53.7% (PRE) of the variation in the dependent variable can be explained by the independent variable We cannot, however, say that being Baptist increases the syphilis rate.
 From this we can say 53.7% (PRE) of the variation in the dependent variable can be explained by the independent variable We cannot, however, say that being Baptist increases the syphilis rate.")
31
Another Example Violent Crime Rate, Teen Unemployment Rate, Roadway congestion, Heart Disease

32
Correlations in SPSS Analyze – Correlate – Bivariate You can include multiple variables

33
SCATTERPLOTS

34
A Way of Visualizing a Correlation

35
More on Scatterplots We can think of this line as a prediction line. The closer the dots to the line, the stronger the relationship, the further the dots the weaker the line. If all the data points are right on the regression line, then there is a perfect linear relationship between the two variables. This only graphs a correlation...... this means that it does not mean causality nor should it be used for testing!

36
CO2 and Urban Population

Similar presentations


 (pp.32-33) Chapter 2 Descriptive Statistics (Pollock.>")


 (pp.37-44) Chapter 6. Foundations of Statistical Inference (128-133)>")
![Correlation Question 1 This question asks you to use the Pearson correlation coefficient to measure the association between [educ4] and [empstat]. However,](/19/5827231/big_thumb.jpg "Correlation Question 1 This question asks you to use the Pearson correlation coefficient to measure the association between [educ4] and [empstat]. However,>")


