Download presentation
Presentation is loading. Please wait.

1
Skewness 9/27/2012

2
Readings Chapter 2 Measuring and Describing Variables (Pollock) (pp.37-44) Chapter 6. Foundations of Statistical Inference (128-133) (Pollock) Chapter 3 Transforming Variables (Pollock Workbook)
 (Pollock) Chapter 3 Transforming Variables (Pollock Workbook).")
3
Homework Homework Due: Chapter 2 Pollock Workbook (10/2) – Question 1: A, B, C, D, E – Question 2: B, D, E (this requires a printout) – Question 3: A, B, D – Question 5: A, B, C, D – Question 7: A, B, C, D – Question 8: A, B, C
 – Question 1: A, B, C, D, E – Question 2: B, D, E (this requires a printout) – Question 3: A, B, D – Question 5: A, B, C, D – Question 7: A, B, C, D – Question 8: A, B, C")
4
OPPORTUNITIES TO DISCUSS COURSE CONTENT

5
Office Hours For the Week When – Friday and Monday 11-1 – Tuesday 8-12 – And appointment Santa wears blublockers blublockers

6
Course Learning Objectives Students will learn the research methods commonly used in behavioral sciences and will be able to interpret and explain empirical data. Students will achieve competency in conducting statistical data analysis using the SPSS software program.

7
THE NORMAL CURVE

8
Different Kinds of Distributions

9
Different Kinds of Curves

10
Rectangular

11
Camel Humps Dromedary (one hump)Bactrian (bi-modal)
Bactrian (bi-modal)")
12
The Normal/Bell Shaped curve Symmetrical around the mean It has 1 hump, it is located in the middle, so the mean, median, and mode are all the same!

13
Why we use the normal curve To determine skewness The Normal Distribution curve is the basis for hypothesis/significance testing

14
SKEWNESS

15
What is skewness? an asymmetrical distribution. Skewness is also a measure of symmetry, Most often, the median is used as a measure of central tendency when data sets are skewed.

16
How to describe skewness

17
The Mean or the Median? In a normal distribution, the mean is the preferred measure In a skewed distribution, you go with the median

18
Testing for Skewness In the Descriptives CommandIn the Frequencies Command Click Here

19
Deviate from the norm? 1.Divide the skewness value 2.By the std. error of skewness

20
A distribution is said to be skewed if the magnitude of (Skewness value/ St. Error of Skew) is greater than 2 (in absolute value)
 is greater than 2 (in absolute value).")
21
If the Value is Two or More Median

22
If the Value Is Two or Less Mean

23
Baseball Salaries again Divide the Skewness by its standard error –.800/.427 = 1.87 This value is less than 2 so we use the mean (92 million) What does the positive skew value mean???
 What does the positive skew value mean")
24
Lets Try another One (Per Capita income in the states) Divide the Skewness by its standard error –.817/.337 = 2.42 The value is greater than two, and the skewness value is positive What is the better measure and what might cause this distribution shape?
 Divide the Skewness by its standard error –.817/.337 = 2.42 The value is greater than two, and the skewness value is positive What is the better measure and what might cause this distribution shape")
25
CO2 Emissions by State

26
Percent Hispanic

27
World Urban Population

28
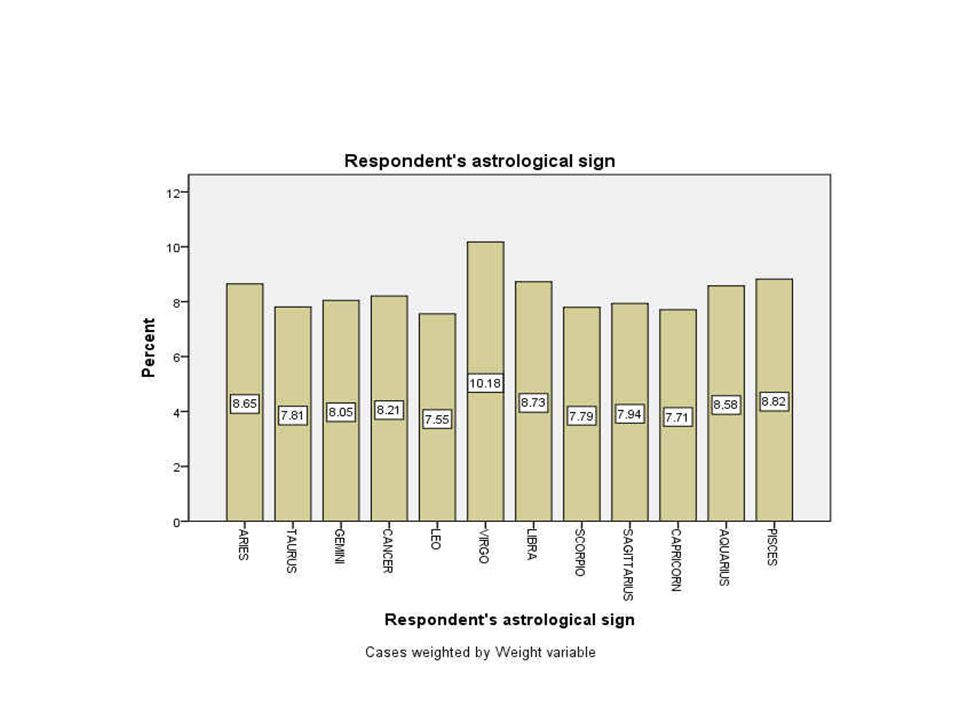
MAKING BAR CHARTS IN SPSS

29
Simple Bar Charts In SPSS OPEN GSS 2008 Analyze – Descriptive Statistics Frequencies

31
STATISTICAL SIGNIFICANCE

32
Statistical Significance A result is called statistically significant if it is unlikely to have occurred by chance You use these to establish parameters, so that you can state probability that a parameter falls within a specified range called the confidence interval (chance or not). Practical significance says if a variable is important or useful for real-world. Practical significance is putting statistics into words that people can use and understand.

33
Curves & Significance Testing

34
What this Tells us Roughly 68% of the scores in a sample fall within one standard deviation of the mean Roughly 95% of the scores fall 2 standard deviations from the mean (the exact # is 1.96 s.d) Roughly 99% of the scores in the sample fall within three standard deviations of the mean
 Roughly 99% of the scores in the sample fall within three standard deviations of the mean")
35
A Practice Example Assuming a normal curve compute the age (value) – For someone who is +1 s.d, from the mean – what number is -1 s.d. from the mean With this is assumption of normality, what % of cases should roughly fall within this range (+/-1 S.D.) What about 2 Standard Deviations, what percent should fall in this range?
 What about 2 Standard Deviations, what percent should fall in this range .")
Similar presentations
 (pp.48-58) Chapter 1 Introduction.>")
 (pp.32-33) Chapter 2 Descriptive Statistics (Pollock.>")


 (pp.37-44) Chapter 6. Foundations of Statistical Inference.>")
 (pp. 58-76) Chapter 5.>")
 (pp. 182-187) Chapter 8 Correlation and Regression (Pollock Workbook)>")
 (pp. 58-76) Chapter 5.>")
