Download presentation
Presentation is loading. Please wait.

1
Guidance

2
What is Guidance? If it helps you to decide on a forecast, then it is guidance.

3
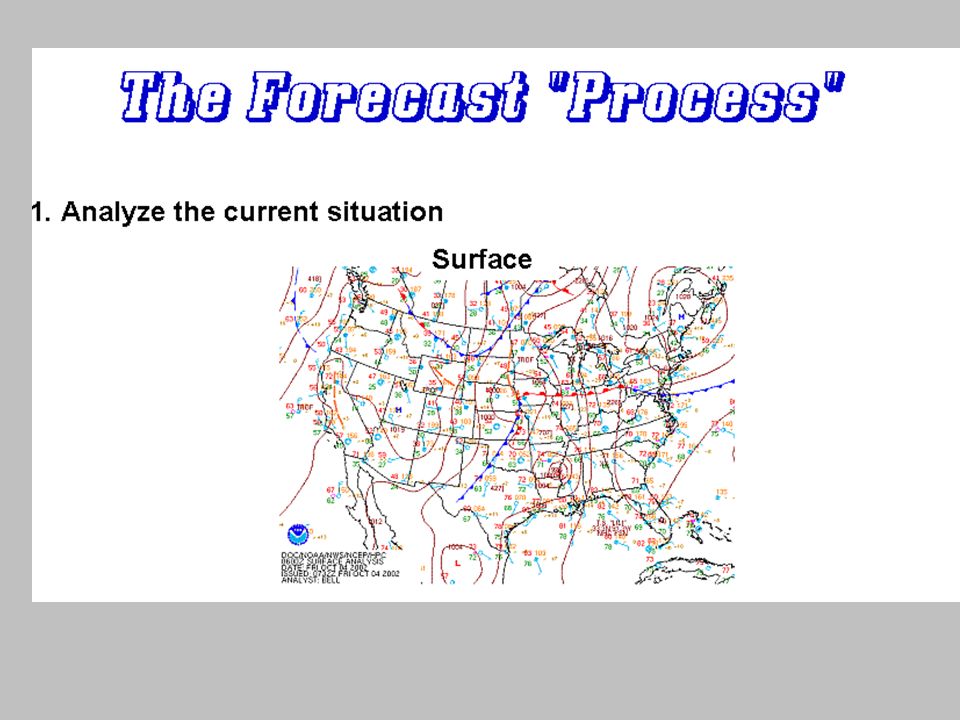
This is the most obvious guidance for predicting where fronts, Highs, Lows, etc. will be. It is the surface prog and this is a manually produced map.

4
This prog is a 48 hour forecast which will verify at the same time as the 24 hour forecast shown in the previous slide. Note the verifying time.

5
Here’s the actual 12Z map. This is called the verification. How good were the 24 and 48 hour progs as guidance products? So, how did forecasters at NCEP decide where to forecast the surface features?

6
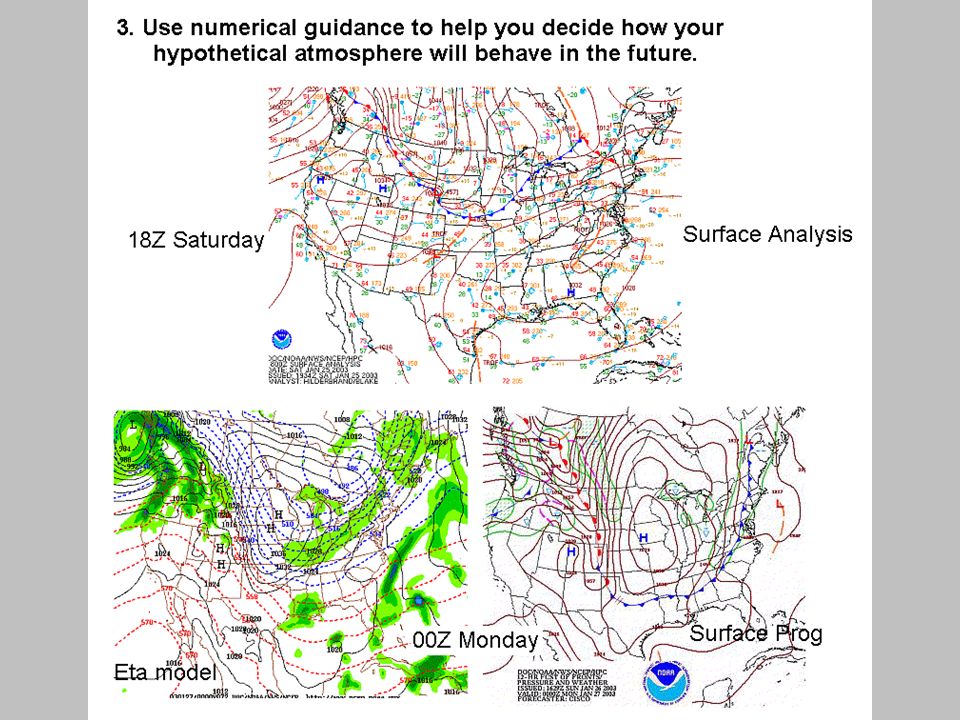
This is computer output from the North American Mesoscale model, or NAM. It is also guidance. Numerical model output is the main guidance for forecasters. You need to learn to use it but don’t ever assume the computer forecast is perfect.

7
Here are two computer forecasts verifying at the same time and date. Your forecast for central New York on Sunday morning is what ? (Do you pick one or average them, i.e., hedge?) By the way, this is the day of the Baseball Hall of Fame induction ceremony. If it rains like the GFS predicts, 75,000 people will get soaked in Cooperstown. So it’s an important forecast! NAM GFS
 By the way, this is the day of the Baseball Hall of Fame induction ceremony. If it rains like the GFS predicts, 75,000 people will get soaked in Cooperstown. So it’s an important forecast. NAM GFS.")
8
By Sunday, both models had converged on the drier NAM forecast. This was what verified.

9
NAM (also GFS, RUC, etc.) output shows many levels and many different types of information.
 output shows many levels and many different types of information.")
10
The NCEP Model Analysis and Guidance page has the NAM and GFS models, along with several others. They are always working to add new ones and improve the service. Keep checking for new products.

11
UCAR’s Research Applications Lab is another good place for guidance products. You can also see lots of analysis products, too using the menu bar. This site is also known as NCAR-RAP.

12
NAM surface loop forecast

13
This is the surface prog for the situation forecasted by the NAM in the previous slide. Notice Pierre, SD is in the warm sector. The observation was 105°F at 00Z

14
By 00Z Friday, the 48 hour surface prog showed that a cold front had passed through South Dakota. We need more guidance to be able to choose specific forecast numbers.

15
MOS FORECASTS GFS MOS (MAV) KPIR GFS MOS GUIDANCE 7/25/2007 0600 UTC DT /JULY 25 /JULY 26 /JULY 27 / HR 12 15 18 21 00 03 06 09 12 15 18 21 00 03 06 09 12 15 18 00 06 X/N 106 73 87 59 89 TMP 74 87 99104102 90 84 77 74 77 82 84 82 73 67 63 61 74 84 87 68 DPT 65 66 64 61 62 66 67 67 66 66 65 62 60 59 58 56 55 57 53 51 53 CLD CL CL CL CL SC CL SC SC BK BK BK BK BK SC CL CL CL CL CL CL CL WDR 13 15 16 16 15 11 15 35 34 35 35 35 36 36 35 33 34 04 04 09 12 WSP 06 10 12 12 14 16 13 15 13 15 16 16 14 08 05 05 05 08 08 09 06 P06 2 7 14 28 18 29 10 8 2 2 3 P12 7 33 38 14 5 Q06 0 0 0 0 0 1 0 0 0 0 0 Q12 0 0 1 0 0 T06 6/ 5 22/15 30/13 20/ 2 8/ 3 15/13 8/14 3/ 2 1/ 2 2/14 T12 40/18 23/ 3 15/14 3/ 3 6/14 CIG 8 8 8 8 8 8 8 8 8 6 6 7 8 8 8 8 8 8 8 8 8 VIS 7 7 7 7 7 7 7 7 7 7 7 7 7 7 7 7 7 7 7 7 7 OBV N N N N N N N N N N N N N N N N N N N N N ------------------------------------------------------------------------ Eta MOS (MET) KPIR ETA MOS GUIDANCE 7/25/2007 0000 UTC DT /JULY 25 /JULY 26 /JULY 27 / HR 06 09 12 15 18 21 00 03 06 09 12 15 18 21 00 03 06 09 12 18 00 X/N 103 74 84 59 85 TMP 81 76 73 86 96101 98 86 81 77 75 80 83 81 76 69 65 62 61 77 81 DPT 68 68 67 69 69 66 66 68 69 70 69 69 67 64 64 62 60 59 58 56 53 CLD CL CL CL CL CL CL FW CL CL CL CL SC BK BK OV OV OV BK SC FW CL WDR 14 15 14 15 15 14 13 12 14 13 11 03 02 01 01 01 36 34 34 02 06 WSP 10 08 06 09 11 14 14 12 11 08 06 10 15 16 15 13 09 10 07 09 07 P06 6 0 2 7 15 15 38 28 17 0 1 P12 7 15 44 39 3 Q06 0 0 0 0 0 0 2 0 0 0 0 Q12 0 0 1 1 0 T06 20/ 7 6/ 6 15/18 24/14 18/ 2 9/ 4 26/18 37/16 23/ 2999/99 T12 22/ 7 24/22 22/ 5 51/20 999/99 CIG 8 8 8 8 8 8 8 8 8 8 8 8 8 7 6 7 8 8 8 8 8 VIS 7 7 7 7 7 7 7 7 7 7 7 7 7 7 7 7 7 7 7 7 7 OBV N N N N N N N N N N N N N N N N N N N N N This is the Model Output Statistics guidance, known as MOS. MOS is a regression using the NAM (WRF) or GFS forecasts to decide on specific numbers. It’s still just guidance. You don’t have to agree. Which model was correct?
 or GFS forecasts to decide on specific numbers. It’s still just guidance. You don’t have to agree. Which model was correct .")
16
Observations for PIERRE, SD (PIR) /1353Z 25 Jul 2007 to 1353Z 26 Jul 2007/ STN TIME PMSL ALTM TMP DEW RH DIR SPD GUS PEAK VIS CLOUDS MIN MAX DD/HHMM hPa inHg F F % deg kt kt ddfff mile F F ==== ======= ====== ====== === === === === === === ===== ==== ======= === === PIR 26/2353 1012.9 29.96 81 66 60 10 17 10.0 FEW028 76 83 PIR 26/2253 1012.8 29.96 82 66 58 360 13 10.0 FEW027 PIR 26/2153 1013.1 29.96 82 66 58 10 15 21 10.0 SCT025 BKN030 PIR 26/2053 1013.0 29.96 82 67 60 330 16 10.0 SCT022 PIR 26/1953 1012.8 29.96 81 67 62 320 15 10.0 FEW021 PIR 26/1853 1012.8 29.96 79 67 67 330 14 21 10.0 FEW019 PIR 26/1753 1013.0 29.97 78 67 69 330 13 10.0 SCT011 72 78 PIR 26/1653 1012.6 29.95 73 66 79 320 12 10.0 OVC015 PIR 26/1553 1011.7 29.93 73 66 79 320 9 10.0 OVC013 PIR 26/1453 1010.3 29.89 73 65 76 50 10 10.0 OVC015 PIR 26/1353 1009.0 29.85 72 65 79 10 19 27 35032 10.0 CLR PIR 26/1253 1008.4 29.84 74 66 76 350 19 30 35032 10.0 CLR PIR 26/1153 1007.9 29.83 75 67 76 340 14 20 34029 10.0 CLR 74 87 PIR 26/1053 1007.5 29.82 76 66 71 320 17 31029 10.0 BKN040 PIR 26/0953 1006.7 29.80 76 67 74 310 19 29 30030 10.0 BKN036 PIR 26/0853 1006.7 29.80 78 63 60 290 22 32 30041 10.0 BKN038 PIR 26/0753 1004.2 29.73 82 70 67 280 26 40 27040 8.0 CLR PIR 26/0653 1003.6 29.71 86 62 45 180 16 10.0 CLR PIR 26/0553 1003.6 29.70 86 63 46 120 11 10.0 CLR 85 105 PIR 26/0453 1003.9 29.71 87 63 45 110 8 10.0 CLR PIR 26/0353 1003.8 29.71 89 63 42 130 12 10.0 CLR PIR 26/0253 1002.9 29.68 92 62 37 130 13 10.0 CLR PIR 26/0153 1002.3 29.67 96 61 31 140 13 14026 10.0 CLR PIR 26/0053 1001.9 29.65 101 61 27 140 18 24 13029 10.0 CLR PIR 25/2353 1001.8 29.65 105 57 21 140 17 23 10.0 CLR 100 109 (Beat old record of 107 set in 1943) PIR 25/2253 1002.2 29.66 108 51 15 230 6 14 10.0 CLR PIR 25/2153 1002.7 29.68 107 54 18 200 10 16 10.0 CLR PIR 25/2100 24 9 52 100 6 PIR 25/1953 1003.8 29.71 106 56 19 170 10 17 10.0 CLR PIR 25/1853 1004.6 29.73 103 59 24 140 12 22 10.0 CLR PIR 25/1753 1005.4 29.76 100 61 28 150 15 23 10.0 CLR 76 100 PIR 25/1653 1005.8 29.77 96 64 35 120 14 20 10.0 CLR PIR 25/1553 1006.0 29.77 91 65 42 130 14 10.0 CLR PIR 25/1453 1006.7 29.79 87 65 48 130 10 10.0 CLR PIR 25/1353 1007.2 29.81 82 66 58 140 9 10.0 CLR Answer: Both! The GFS was closer to 109. Both models did well on the low of 72. The NAM was better on the max of 83 on July 26. Why was July 26 so much cooler than July 25?

17
MOS LINEAR REGRESSION JANUARY 1 - JANUARY 30, 1994 0000 UTC KCMH 18-H NGM 850-1000 MB THICKNESS (M) TODAY'S MAX (°F) 1150120012501300 1350 10 20 30 40 50 60 0 -10 Predictor Predictand
 TODAY S MAX (°F) Predictor Predictand")
18
MOS LINEAR REGRESSION JANUARY 1 - JANUARY 30, 1994 0000 UTC KCMH 18-H NGM 850-1000 MB THICKNESS (M) TODAY'S MAX (°F) 1150120012501300 1350 10 20 30 40 50 60 0 -10 RV=93.1% MAX T = -352 + (0.3 x 850-1000 mb THK)
 TODAY S MAX (°F) RV=93.1% MAX T = (0.3 x mb THK)")
19
REDUCTION OF VARIANCE A measure of the “goodness” of fit and Predictor / Predictand correlation PREDICTOR PREDICTAND MEAN RV Variance - Standard Error = Variance { } UNEXPLAINED VARIANCE *

20
MOS LINEAR REGRESSION JANUARY 1 - JANUARY 30, 1994 0000 UTC KUIL 18-H NGM 850-1000 MB THICKNESS (M) TODAY'S MAX (°F) 1250130013501400 30 40 50 60 RV=26.8% Different site, Different relationship! Same predictor,

21
EXAMPLE REGRESSION EQUATIONS Y = a + bX CMH MAX TEMPERATURE EQUATION CMH PROBABILITY OF PRECIPITATION EQUATION MAX T = -352 + (0.3 x 850 -1000 mb THICKNESS) POP = -0.234 + (0.007 x MEAN RH) + (0.478 x BINARY MEAN RH CUTOFF AT 70%) * * (IF MRH ≥ 70% BINARY MRH = 1; else BINARY MRH = 0)
 POP = (0.007 x MEAN RH) + (0.478 x BINARY MEAN RH CUTOFF AT 70%) * * (IF MRH ≥ 70% BINARY MRH = 1; else BINARY MRH = 0)")
22
PROBABILITY FORECASTS ● POINT PROBABILITIES ● AREAL PROBABILITIES ● CONDITIONAL PROBABILITIES Assessment of probability is EXTREMELY dependent upon how the predictand “event” is defined: Some things to keep in mind -Time period of consideration -Area of occurrence -Dependent upon another event? MOS forecasts can be:

23
PREDICTAND DEFINITION Daytime Maximum Temperature “Daytime” is 0700 AM - 0700 PM LST * Nighttime Minimum Temperature “Nighttime” is 0700 PM - 0800 AM LST * * CONUS – differs in AK Probability of Precipitation Precipitation occurrence is accumulation of ≥ 0.01 inches of liquid-equivalent at a gauge location within a specified period Max/Min and PoP

24
Now approx. 1990 sites

25
Station: PIR Lat: 44.38 Lon:-100.28 Elev: 526 Closest grid pt: 31.9 km. Initialization Time: 07-07-25 0000 UTC PARAMETER/TIME 000 006 012 018 024 030 036 042 048 054 060 066 072 ------------------- ------ ------ ------ ------ ------ ------ ------ ------ ------ ------ ------ ------ ------ DAY / HOUR 25/00 25/06 25/12 25/18 26/00 26/06 26/12 26/18 27/00 27/06 27/12 27/18 28/00 ------------------- ------ ------ ------ ------ ------ ------ ------ ------ ------ ------ ------ ------ ------ TEMPS SFC (2 M) (F) 100 84 78 99 101 86 80 88 73 64 63 82 85 850 MB (C) 28 27 26 26 29 28 25 21 19 15 13 16 19 700 MB (C) 15 15 15 15 14 15 13 13 10 9 9 9 9 500 MB (C) -5 -5 -5 -5 -5 -5 -6 -6 -5 -3 -4 -5 -5 1000-500 THCK 587 585 583 585 587 586 583 582 577 575 573 575 577 MOISTURE 30 M AVG RH 23 39 48 29 23 39 48 50 78 87 77 40 31 850 MB DP/RH 10/32 11/37 10/37 11/39 11/31 12/38 12/46 15/70 17/88 14/94 9/75 8/58 7/46 700 MB DP/RH 1/40 2/41 -1/34 -4/27 5/54 -1/35 2/48 6/63 6/78 8/93 6/79 -1/48 -8/29 500 MB DP/RH -24/21 -25/19 -25/20 -25/18 -22/25 -17/40 -10/74 -9/79 -6/92 -22/22 -30/11 -17/37 -12/58 CONV PRECIP (IN) TOTAL PRECIP (IN) 0.00 0.00 0.00 0.00 0.00 0.00 0.00 0.03 0.07 0.02 0.00 0.00 WIND DD/FFF (Kts) 30 M AVG 15/014 17/017 18/014 17/012 16/011 17/018 22/008 33/006 00/019 00/012 35/011 03/010 05/010 850 MB 16/015 19/020 22/015 17/014 17/012 19/022 24/010 33/004 05/011 03/013 05/020 04/012 05/011 700 MB 13/016 14/018 18/010 24/002 23/006 08/002 19/010 22/016 25/010 01/010 36/009 34/005 31/006 500 MB 31/004 32/006 36/010 34/009 34/009 32/008 29/007 22/018 31/010 33/018 31/016 30/013 30/017 250 MB 33/007 04/017 05/018 05/013 36/013 35/026 36/022 34/020 02/013 31/012 28/022 26/033 27/042 VERTICAL VEL (uB/S) 850 MB -8 6 1 12 -7 9 39 23 8 16 -4 -6 700 MB -44 -6 4 0 1 17 58 -16 -6 -11 -8 -5 500 MB 7 -23 7 -9 49 2 -8 5 1 -9 0 -4 OTHER TROP PRES (MB) 144 138 138 139 129 132 136 137 141 142 142 138 140 MSL PRES (MB) 1006 1007 1008 1006 1003 1005 1007 1009 1013 1015 1016 1016 1013 500 MB HGT (DM) 592 591 590 591 590 590 588 589 588 589 588 590 589 500 MB ABS VORT 12.2 10.7 7.6 9.1 6.0 5.3 3.2 4.2 30.2 10.0 9.1 9.0 11.6 The NAM itself makes predictions, but these are not MOS regressions. These are called grid interpolations or direct model output. You can also use this. As usual, don’t assume it is perfect.
 (F) MB (C) MB (C) MB (C) THCK MOISTURE 30 M AVG RH MB DP/RH 10/32 11/37 10/37 11/39 11/31 12/38 12/46 15/70 17/88 14/94 9/75 8/58 7/ MB DP/RH 1/40 2/41 -1/34 -4/27 5/54 -1/35 2/48 6/63 6/78 8/93 6/79 -1/48 -8/ MB DP/RH -24/21 -25/19 -25/20 -25/18 -22/25 -17/40 -10/74 -9/79 -6/92 -22/22 -30/11 -17/37 -12/58 CONV PRECIP (IN) TOTAL PRECIP (IN) WIND DD/FFF (Kts) 30 M AVG 15/014 17/017 18/014 17/012 16/011 17/018 22/008 33/006 00/019 00/012 35/011 03/010 05/ MB 16/015 19/020 22/015 17/014 17/012 19/022 24/010 33/004 05/011 03/013 05/020 04/012 05/ MB 13/016 14/018 18/010 24/002 23/006 08/002 19/010 22/016 25/010 01/010 36/009 34/005 31/ MB 31/004 32/006 36/010 34/009 34/009 32/008 29/007 22/018 31/010 33/018 31/016 30/013 30/ MB 33/007 04/017 05/018 05/013 36/013 35/026 36/022 34/020 02/013 31/012 28/022 26/033 27/042 VERTICAL VEL (uB/S) 850 MB MB MB OTHER TROP PRES (MB) MSL PRES (MB) MB HGT (DM) MB ABS VORT The NAM itself makes predictions, but these are not MOS regressions. These are called grid interpolations or direct model output. You can also use this. As usual, don’t assume it is perfect..")
26
NWS forecasters produce zone forecasts after consulting the various computer guidance products.

27
Discussion of today’s Guidance products (not this one).
.")
32
4. Use text guidance to make specific numerical forecasts ZFPBGM ZONE FORECAST PRODUCT FOR CENTRAL NEW YORK/NORTHEAST PENNSYLVANIA NATIONAL WEATHER SERVICE BINGHAMTON, NY 233 AM EDT MON JUL 30 2007 NYZ046-057-302045- OTSEGO-DELAWARE- INCLUDING THE CITIES OF...ONEONTA...COOPERSTOWN...WALTON 233 AM EDT MON JUL 30 2007 TODAY MOSTLY CLOUDY WITH AREAS OF FOG EARLY THIS MORNING...THEN BECOMING MOSTLY SUNNY. HIGHS IN THE LOWER 80S. LIGHT AND VARIABLE WINDS...BECOMING NORTHWEST AROUND 10 MPH THIS AFTERNOON. TONIGHT MOSTLY CLEAR. LOWS IN THE MID 50S. NORTHWEST WINDS AROUND 10 MPH IN THE EVENING...BECOMING LIGHT AND VARIABLE. TUESDAY PARTLY SUNNY. HIGHS IN THE LOWER 80S. NORTHWEST WINDS AROUND 10 MPH. Eta MOS (MET) KBGM ETA MOS GUIDANCE 7/30/2007 0000 UTC DT /JULY 30 /JULY 31 /AUG 1 / HR 06 09 12 15 18 21 00 03 06 09 12 15 18 21 00 03 06 09 12 18 00 X/N 80 61 81 61 78 TMP 66 63 65 73 77 78 72 67 65 63 65 73 78 78 73 69 66 63 64 76 72 DPT 59 59 61 63 60 59 59 58 58 58 60 62 61 61 62 62 61 59 59 56 55 CLD CL SC CL SC BK BK SC CL CL SC CL FW BK BK FW CL SC SC CL CL CL WDR 02 36 36 35 35 35 34 34 34 32 29 32 32 32 34 34 33 33 33 34 35 WSP 04 04 04 06 08 08 06 06 05 04 04 07 08 08 06 05 05 05 06 08 06 P06 9 5 4 0 10 4 11 1 8 2 1 P12 8 10 14 14 5 Q06 0 0 0 0 0 0 0 0 0 0 0 Q12 0 0 0 0 0 T06 0/ 0 2/ 0 5/11 0/ 4 0/ 0 8/ 0 16/13 5/ 5 3/ 0999/99 T12 2/ 0 5/11 8/ 0 16/13 999/99 CIG 8 8 8 8 8 8 8 8 8 8 8 8 7 7 8 8 8 8 8 8 8 VIS 7 6 5 7 7 7 7 7 7 7 7 7 7 7 7 7 7 5 7 7 7 OBV N BR BR N N N N N N N N N N N N N N BR N N N You don’t have to agree, even with the official Zone Forecast Product. Notice that this one doesn’t agree with the Eta MOS guidance.
 KBGM ETA MOS GUIDANCE 7/30/ UTC DT /JULY 30 /JULY 31 /AUG 1 / HR X/N TMP DPT CLD CL SC CL SC BK BK SC CL CL SC CL FW BK BK FW CL SC SC CL CL CL WDR WSP P P Q Q T06 0/ 0 2/ 0 5/11 0/ 4 0/ 0 8/ 0 16/13 5/ 5 3/ 0999/99 T12 2/ 0 5/11 8/ 0 16/13 999/99 CIG VIS OBV N BR BR N N N N N N N N N N N N N N BR N N N You don’t have to agree, even with the official Zone Forecast Product. Notice that this one doesn’t agree with the Eta MOS guidance..")
Similar presentations


 Week #2 Forecast November 15, 2010.>")

 Full range of products available at:>")


>")