Download presentation
Presentation is loading. Please wait.

1
Key BC Silviculture Statistics ä Forest Practices Branch BC Forest Service September 8, 2009

2
ObjectivesObjectives ä To share key statistics on silviculture in BC ä Purpose to give context for moving forward and improving BC’s silviculture programs ä To illustrate management levels on TSAs vs other tenures ä To illustrate some reforestation and tending opportunities for the future

11
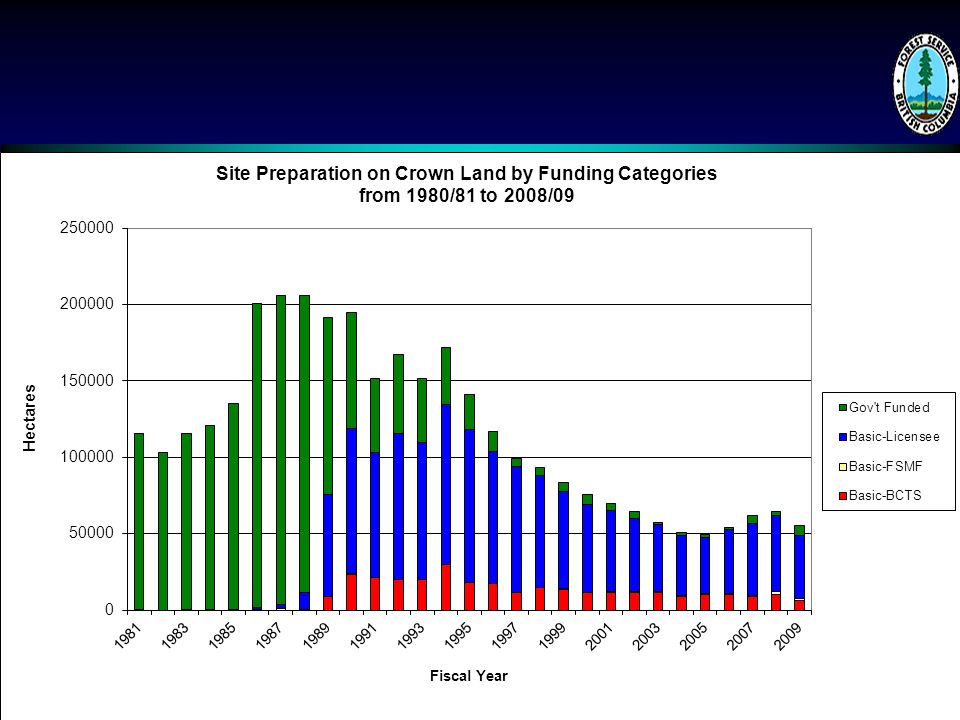
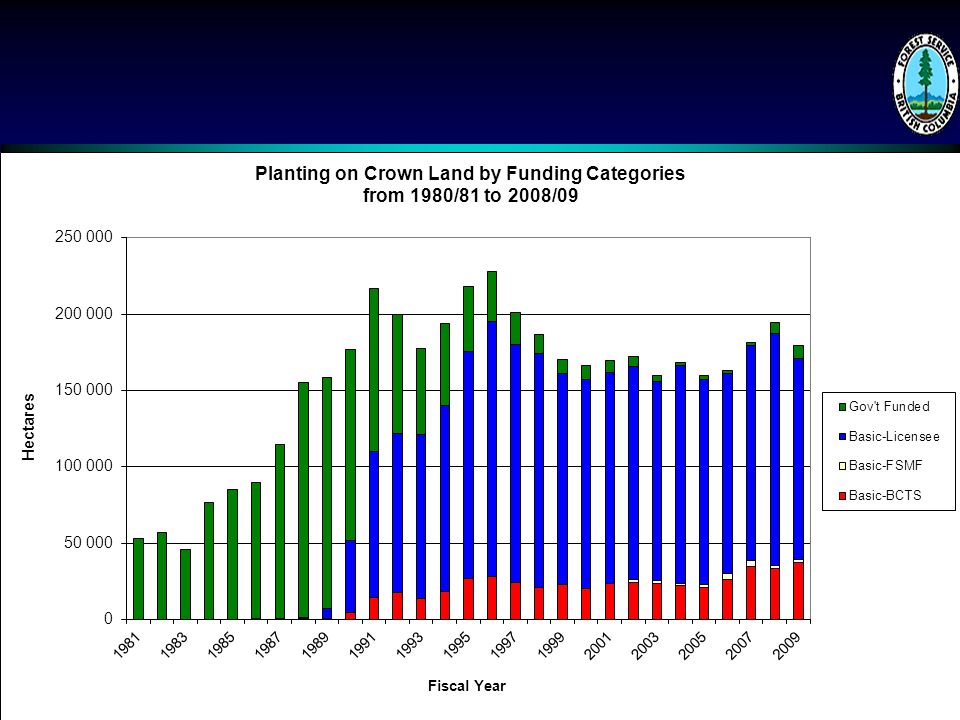
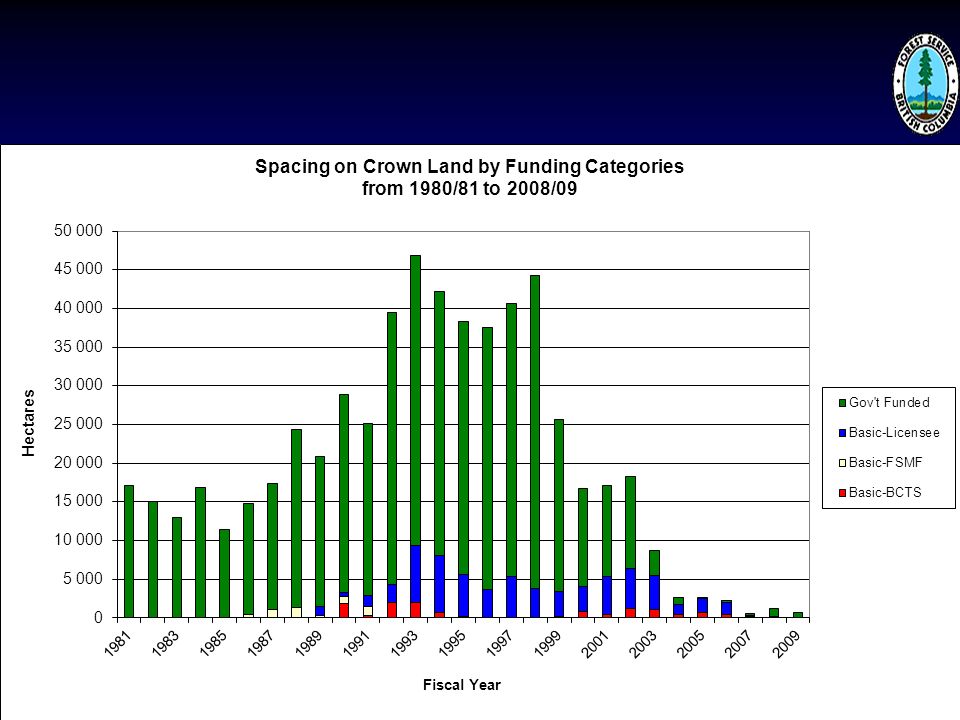
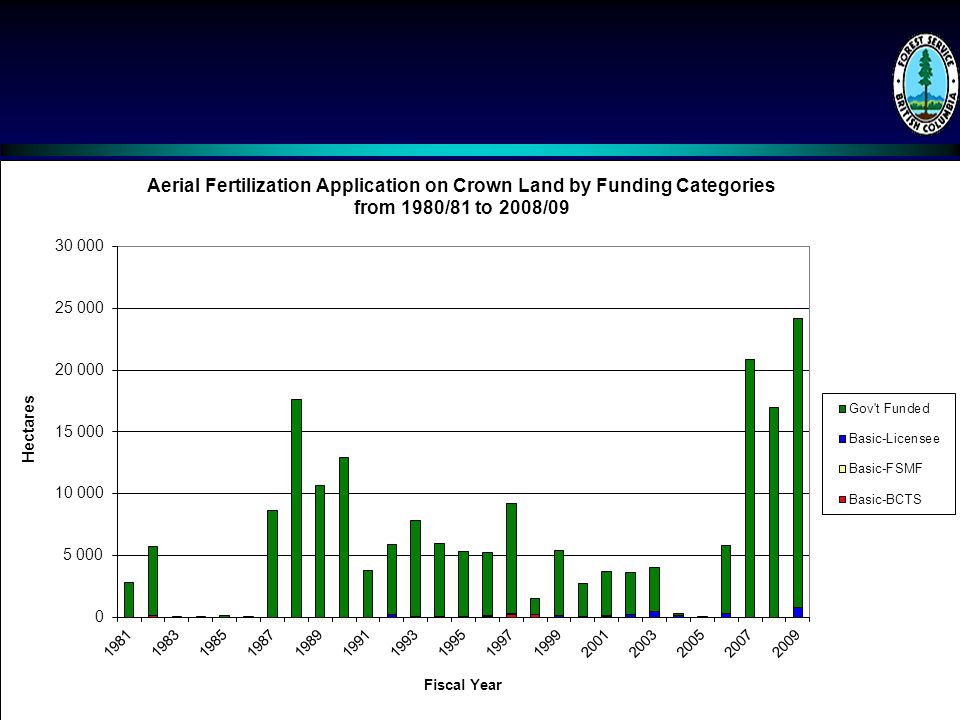
How many silviculture funding sources ä There have been 43 different funding sources used to date ä Only one funding approach has lasted 21 years and delivered $200 million per year in silv funding Assigned Funding Source Code to Fund Category to generalize for graph SILV_FUND _SRCE_CO DEDESCRIPTIONFund CategoryEFFECTIVE_DATEEXPIRY_DATE BCTBC Timber SalesLegal-BCTS2003-04-019999-12-31 CLCatastrophic LossesNon-legal1905-01-012007-09-30 FIDForest Investment Account - FRPA 108Non-legal2003-04-012006-09-14 FILForest Investment Account - licensee administeredNon-legal2003-04-019999-12-31 FIMForest Investment Account - ministry administeredNon-legal2003-04-019999-12-31 FIVForest Investment VoteNon-legal2002-04-029999-12-31 FMCCOMFORNon-legal1905-01-012007-09-30 FMEForest Worker Development Program (non-MOF funded)Non-legal1905-01-012007-09-30 FMYYouth FundNon-legal1905-01-012007-09-30 FRFRDA I & IINon-legal1905-01-012007-09-30 FRPFRPA - Application For ReliefNon-legal2005-08-019999-12-31 FTLForests for Tomorrow Lic AdminNon-legal2005-04-019999-12-31 FTMForests for Tomorrow MOF AdminNon-legal2005-04-019999-12-31 GAOther Agencies or Voluntary WorkNon-legal1905-01-019999-12-31 GACCorrectionsNon-legal1905-01-019999-12-31 GFSForest Stand Management FundLegal-FSMF1905-01-019999-12-31 GJFJob Creation, FederalNon-legal1905-01-019999-12-31 GJJJob Creation, JointNon-legal1905-01-019999-12-31 GJMJob Creation, MOFNon-legal1905-01-019999-12-31 IAIndustrial AppraisalLegal-Licensee1905-01-019999-12-31 IIRIndustrial Incr., RequiredLegal-Licensee1905-01-019999-12-31 IIVIndustrial Incr., VoluntaryNon-legal1905-01-019999-12-31 IOIndustry OutstandingNon-legal1905-01-012008-08-26 IRIndustry RoyaltiesNon-legal1905-01-019999-12-31 LFPLicensee Funded ProgramLegal-Licensee1905-01-019999-12-31 MMinistryNon-legal1905-01-012003-03-31 OOperationalNon-legal1905-01-019999-12-31 RBCForest Renewal B.C.Non-legal1905-01-012007-09-30 RBLForest Renewal B.C. - licensee administeredNon-legal1997-08-132003-03-31 RBMForest Renewal B.C. - ministry administeredNon-legal1997-08-132003-03-31 SSection 88Non-legal1905-01-012007-09-30 SBFBC Timber SalesLegal-BCTS1905-01-012003-03-31 SMFSouth Moresby Forest Replacement AccountNon-legal1905-01-019999-12-31 TSCTree Seed CentreNon-legal2005-09-139999-12-31 VCVProvincial Contingency Vote (Special Use Only)Non-legal2007-08-019999-12-31 VFHForest HealthNon-legal1905-01-012003-03-31 VFPCurrent ReforestationNon-legal1905-01-012003-03-31 VGMinistry OutstandingNon-legal1905-01-012003-03-31 VIProvicial IncrementalNon-legal1905-01-012007-09-30 VOBMinistry Vote, SBEPNon-legal1905-01-012007-09-30 VOIIndustry OutstandingNon-legal1905-01-012003-03-31 VRTAfforestationNon-legal1905-01-012007-09-30 XXXNo Funding SourceNon-legal1905-01-019999-12-31
Non-legal VFHForest HealthNon-legal VFPCurrent ReforestationNon-legal VGMinistry OutstandingNon-legal VIProvicial IncrementalNon-legal VOBMinistry Vote, SBEPNon-legal VOIIndustry OutstandingNon-legal VRTAfforestationNon-legal XXXNo Funding SourceNon-legal")
12
How do basic silviculture cost estimates for appraisals relate to site productivity SITE INDEX Cost Range a 0-12b 13-17c 18-23d 24-28e 29-33f 34-38g >38 Grand Total 0.00%0.01%0.00% 0.01% a 0-5004.51%14.43%18.19%1.33%0.02%0.00% 38.48% b 501-9001.35%6.28%8.73%0.91%0.03%0.00% 17.31%55.79% c 901-13000.75%4.20%6.51%0.59%0.02%0.00% 12.07% d 1301-17000.49%2.81%4.41%0.62%0.05%0.00% 8.39% e 1701-21000.33%2.20%3.36%0.49%0.03%0.00% 6.41%26.88% f 2101-25000.30%1.31%2.34%0.25%0.01%0.00% 4.21% g 2501-29000.14%0.89%1.36%0.22%0.01%0.00% 2.63% h >29000.69%3.62%5.36%0.80%0.02%0.00% 10.48%17.32% Grand Total8.57%35.75%50.27%5.21%0.18%0.01% 100.00% site classlow poor to medmedgood percent area in class44%50.27%5%

13
Does Agency or Tenure currently effect basic silviculture performance

14
Does Agency or Tenure currently effect total silviculture performance

15
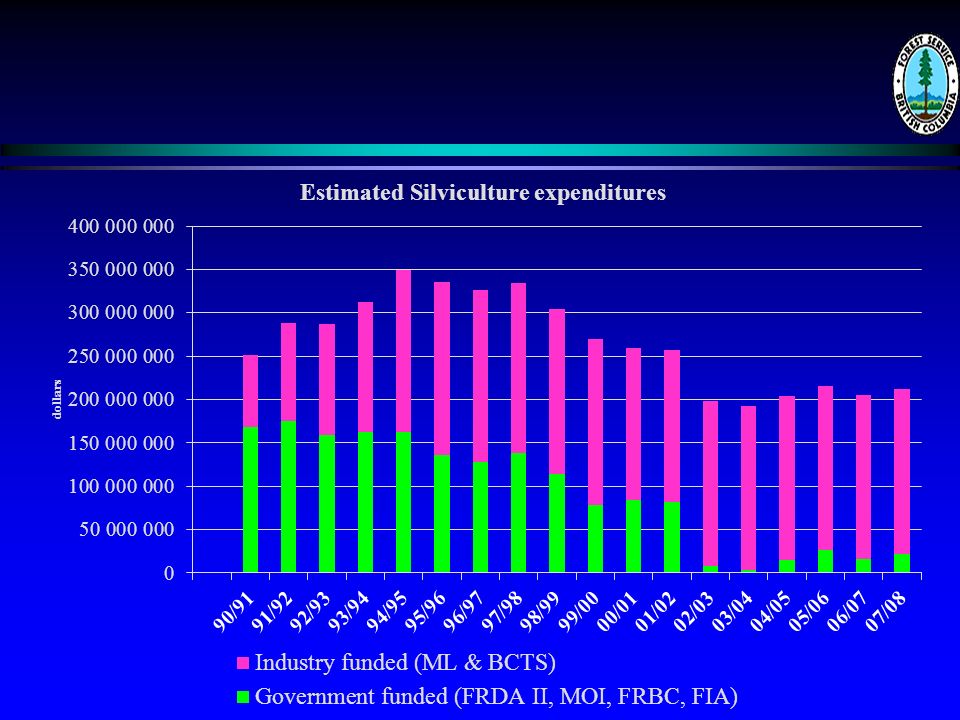
Silviculture is a keystone tool used to maintain the inherited estate for current and future generations ä estimated standing tree value of the estate is $1/4 trillion ä It generates up to $15 billion/year in exports ä It generates up to $1.2 billion/year in stumpage, rents and fees ä Industry and TSP spend ~ $200 million/yr in basic maintenance (silv) – 1.3% of export values ä This year $45 million in incremental enhancements - 0.30% of export values ä
 – 1.3% of export values ä This year $45 million in incremental enhancements % of export values ä")
16
A good foundation to start from 1987 ä In the last few years 82% of harvested areas are planted within 1.7 years ä 22 different tree species planted

17
Basic silviculture - a great industry success story

18
Planting Densities Based on taking sum of planted trees/planted area Data source: RESULTS as of December 11, 2008, PL YrBCTSGOVIND 19951,3831,204 19961,3671,0891,217 19971,3801,0431,327 19981,3061,1361,325 19991,4081,1731,367 20001,3591,1041,314 20011,3471,1981,343 20021,3771,2591,314 20031,4001,2371,267 20041,4101,1701,278 20051,4021,3791,292 20061,3971,3761,296 20071,4591,2571,304 20081,3991,1921,230 average1,3851,2011,291

19
free growing stand densities as reported since January 2006 ä on average at the free growing declaration ä on average at the free growing declaration ä the coast is achieving 86% of target free growing target number of well spaced trees per hectare ä the northern interior is achieving 86% ä the southern interior is achieving 82% ä and BC is achieving 84% of target free growing target number of well spaced trees per hectare ä ä Sites have on average ä 1005 free growing wellspaced trees per hectare and ä 1101 total well spaced trees per ha and ä 5414 TOTAL trees per hectare

20
Total NSR is still missing an estimated 300,000 of SSS and 400,000 of MPB NSR

21
Estimated annual opportunities for treatment Additional Proposed Delivery Current Program Ha treated per year Current funding per year $$ Volume at rotation m3 (80 years) Tonnes CO2* equivalenci es (80 years) Feasible Additiona l Ha treated per year Additional funding per year $$ Additional volume at rotation (80 years) Additional tonnes CO2* equivalencie s (80 years) Cumulative Program Potential Ha treated per year Potential funding per year $$ Potential volume at rotation (80 years) Potential tonnes CO2* equivalencies (80 years) Carbon Sequestration Carbon Gains realized starting 2012 for Fertilization and 2020 for other treatments 36,600$50,878,0005,182,4403,800,80131,979$38,985,5002,719,9281,996,42768,57989,095,0007,902,3685,800,338 Enhancement and Climate Change Adaptation 1,000$5,125,00093,600567,9745,500$11,106,000139,200127,6126,50012,259,600208,800191,417 Improving Forest Health (carbon gains not calculated) NA$ ---NA$5,500,000-NA$5,500,000- ImplementationNA$ 5,102,480-NA$9,090,334-NA$14,192,814- Total Incremental $$37,600$61,105,4805,276,0404,368,77637,479$64,681,8342,859,1282,124,03975,079$121,047,4148,111,1685,991,756 * CO2 Equivalencies in Solid Wood that is Merchantable (possible gains could be higher if total biomass expansion factor). Preliminary Estimates suggest that a similar amount of CO2 will be sequestered in non merchantable branches, roots, soil components, etc

22
Silviculture investment programs ä Need to be developed best on management unit silviculture strategies which are aimed at achieving key mgmt objectives ä Silviculture activities need to be designed to be complementary, integrated and synergistic in impact ä The following are a few examples for coastal type 2 silv strategies

23
Arrowsmith TSA

24
Fraser TSA

25
Strathcona TSA

26
Thanks to ä Mei Ching Tsoi for graphs ä Al Powelson and Ralph Winter for stats ä Kelly Osbourne for financial estimates

Similar presentations