Download presentation
Presentation is loading. Please wait.

1
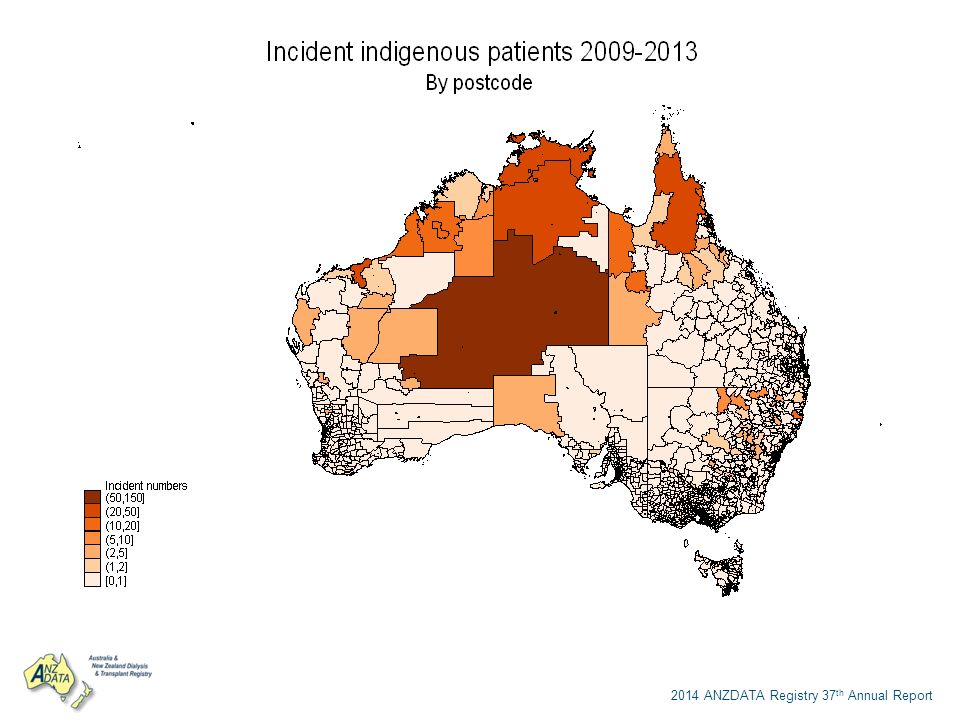
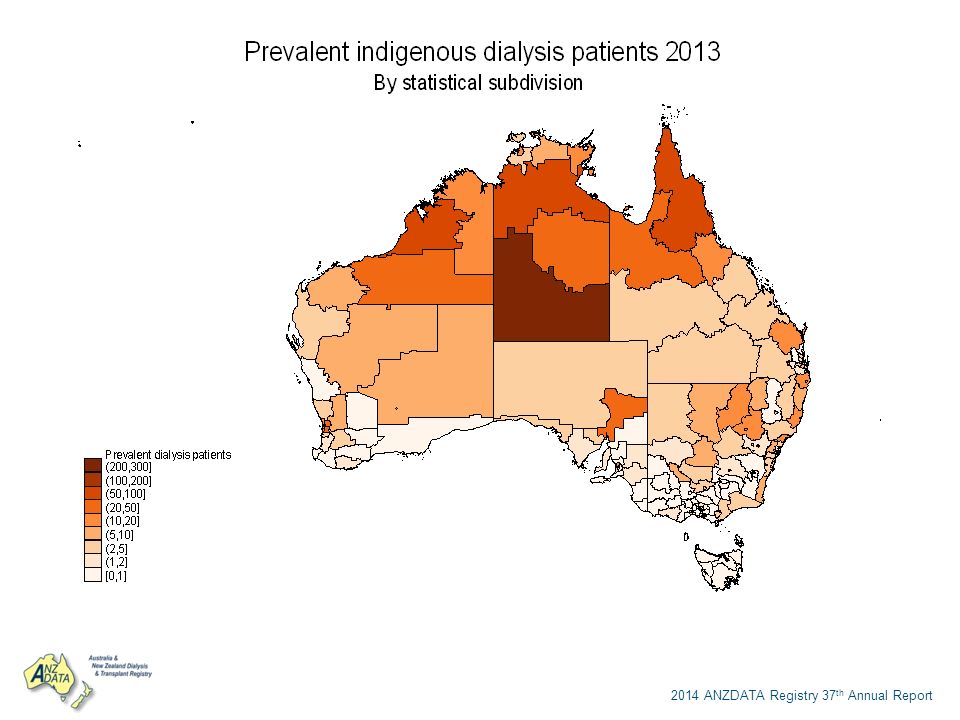
Chapter 12 End Stage Kidney Disease among Indigenous Peoples of Australia and New Zealand 2014 ANZDATA Registry 37th Annual Report Data to 31-Dec-2013 ANZDATA gratefully acknowledges the contributions of the Indigenous Working Group convened by Jaquelyne Hughes and Suetonia Palmer

2
2014 ANZDATA Registry 37 th Annual Report Number of People who commenced Renal Replacement Therapy in Australia and New Zealand YearModality AustraliaNew Zealand Non- indigenous Aboriginal/ TSI Total Non- indigenous Maori Pacific People Total 2009 HD1567158172515812181360 PD554355891235522200 Graft1152117222024 2010 HD1563171173414910681336 PD46436500884728163 Graft1010 142016 2011 HD163322618591568973318 PD52330553914122154 Graft990 1500 2012 HD1608208181613811975332 PD629426711014818167 Graft860 161118 2013 HD1537223176014012688354 PD65741698925922173 Graft860 162119

3
2014 ANZDATA Registry 37 th Annual Report

5
Primary Renal Disease of New Patients 2009 - 2013 Primary Renal Disease AustraliaNew Zealand Non-indigenousAboriginal/TSINon-indigenousMāoriPacific Peoples Glomerulonephritis2564 (23%)115 (10%)354 (27%)124 (15%)97 (19%) Analgesic175 (2%)3 (<1%)12 (1%)2 (<1%)1 (<1%) Polycystic780 (7%)5 (<1%)124 (9%)10 (1%)5 (1%) Reflux285 (3%)24 (2%)33 (3%)8 (1%)6 (1%) Hypertension1620 (14%)90 (8%)198 (15%)43 (5%)29 (6%) Diabetic Nephropathy 3531 (31%)816 (70%)344 (26%)572 (70%)347 (68%) Other1569 (14%)40 (3%)191 (14%)39 (5%)18 (4%) Uncertain620 (6%)50 (4%)57 (4%)18 (2%)9 (2%) Not reported78 (1%)29 (2%)6 (<1%)2 (<1%)0 (0%) Total1122211721319818512
115 (10%)354 (27%)124 (15%)97 (19%) Analgesic175 (2%)3 (<1%)12 (1%)2 (<1%)1 (<1%) Polycystic780 (7%)5 (<1%)124 (9%)10 (1%)5 (1%) Reflux285 (3%)24 (2%)33 (3%)8 (1%)6 (1%) Hypertension1620 (14%)90 (8%)198 (15%)43 (5%)29 (6%) Diabetic Nephropathy 3531 (31%)816 (70%)344 (26%)572 (70%)347 (68%) Other1569 (14%)40 (3%)191 (14%)39 (5%)18 (4%) Uncertain620 (6%)50 (4%)57 (4%)18 (2%)9 (2%) Not reported78 (1%)29 (2%)6 (<1%)2 (<1%)0 (0%) Total")
6
2014 ANZDATA Registry 37 th Annual Report

14
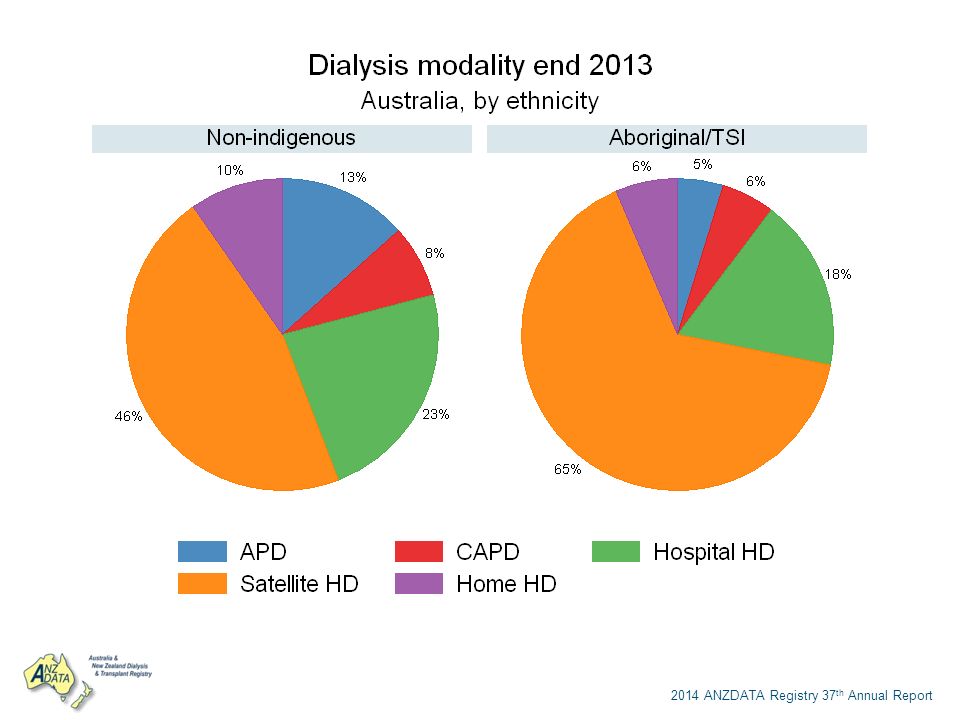
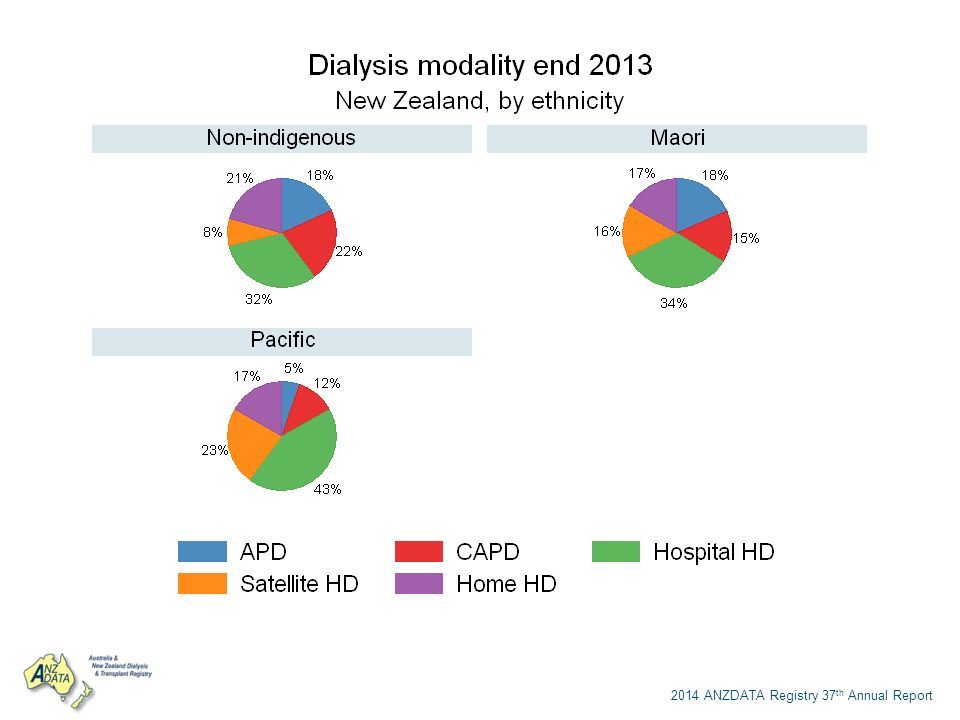
Number of People with End Stage Kidney Disease by Treatment Modality 2009 - 2013 YearModality AustraliaNew Zealand Non-indigenousAboriginal/TSINon-indigenousMāoriPacific People 2009 HD7224 (42%)1041 (77%)605 (27%)496 (58%)380 (66%) % HD at home13%7%33%26%14% PD2061 (12%)142 (11%)452 (20%)238 (28%)110 (19%) Tx7881 (46%)161 (12%)1202 (53%)120 (14%)85 (15%) 2010 HD7550 (42%)1073 (77%)628 (27%)508 (57%)420 (67%) % HD at home12%7%36%26%17% PD1948 (11%)141 (10%)456 (20%)254 (28%)122 (19%) Tx8322 (47%)178 (13%)1228 (53%)130 (15%)86 (14%) 2011 HD7802 (42%)1174 (78%)646 (28%)502 (56%)449 (68%) % HD at home12%7%36%25%16% PD1945 (11%)133 (9%)429 (18%)247 (28%)119 (18%) Tx8664 (47%)191 (13%)1257 (54%)141 (16%)88 (13%) 2012 HD7966 (42%)1274 (79%)668 (28%)532 (58%)489 (71%) % HD at home12%7%38%24%18% PD2094 (11%)144 (9%)425 (18%)242 (26%)111 (16%) Tx9072 (47%)192 (12%)1287 (54%)147 (16%)87 (13%) 2013 HD8142 (41%)1326 (79%)662 (27%)563 (56%)527 (73%) % HD at home12%7%34%25%20% PD2154 (11%)152 (9%)438 (18%)287 (29%)107 (15%) Tx9492 (48%)204 (12%)1332 (55%)148 (15%)92 (13%)
1041 (77%)605 (27%)496 (58%)380 (66%) % HD at home13%7%33%26%14% PD2061 (12%)142 (11%)452 (20%)238 (28%)110 (19%) Tx7881 (46%)161 (12%)1202 (53%)120 (14%)85 (15%) 2010 HD7550 (42%)1073 (77%)628 (27%)508 (57%)420 (67%) % HD at home12%7%36%26%17% PD1948 (11%)141 (10%)456 (20%)254 (28%)122 (19%) Tx8322 (47%)178 (13%)1228 (53%)130 (15%)86 (14%) 2011 HD7802 (42%)1174 (78%)646 (28%)502 (56%)449 (68%) % HD at home12%7%36%25%16% PD1945 (11%)133 (9%)429 (18%)247 (28%)119 (18%) Tx8664 (47%)191 (13%)1257 (54%)141 (16%)88 (13%) 2012 HD7966 (42%)1274 (79%)668 (28%)532 (58%)489 (71%) % HD at home12%7%38%24%18% PD2094 (11%)144 (9%)425 (18%)242 (26%)111 (16%) Tx9072 (47%)192 (12%)1287 (54%)147 (16%)87 (13%) 2013 HD8142 (41%)1326 (79%)662 (27%)563 (56%)527 (73%) % HD at home12%7%34%25%20% PD2154 (11%)152 (9%)438 (18%)287 (29%)107 (15%) Tx9492 (48%)204 (12%)1332 (55%)148 (15%)92 (13%)")
15
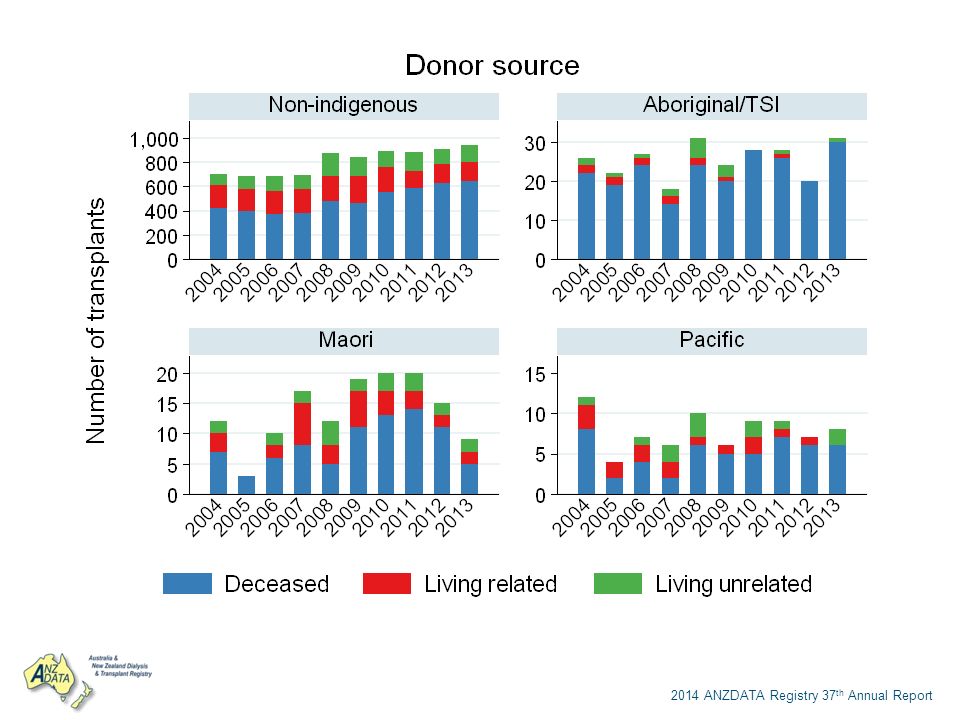
2014 ANZDATA Registry 37 th Annual Report Number of Transplants Recipients by Indigenous Status 2004 - 2013 YearDonor type AustraliaNew Zealand Non-indigenousAboriginal/TSINon-indigenousMāoriPacific People 2004 DD384224278 LD24043954 Total624268112 2005 DD358194232 LD24334402 Total601228634 2006 DD344243164 LD27034243 Total6142773107 2007 DD330145582 LD26744594 Total59718100176 2008 DD435244256 LD34775874 Total782311001210 2009 DD4262038115 LD32345881 Total7492496196 2010 DD5222832135 LD29604974 Total8182881209 2011 DD5442640147 LD25324962 Total7972889209 2012 DD5872037116 LD23804941 Total8252086157 2013 DD600304656 LD25115242 Total851319898

16
2014 ANZDATA Registry 37 th Annual Report

38
Percentage of Late Referral by Indigenous Status 2009 – 2013 Year AustraliaNew Zealand Non- indigenous Aboriginal/TSI Non- indigenous MāoriPacific People 2009 21%22%15%22%13% 2010 22%25%15%19%16% 2011 22%30%22%18%26% 2012 22%26%15%17%16% 2013 19%18%11%15%22%

39
2014 ANZDATA Registry 37 th Annual Report Incident Vascular Access 2009-2013 YearVascular access AustraliaNew Zealand Non-indigenousAboriginal/TSINon-indigenousMāoriPacific People 2009 AVF650 (41%)62 (39%)43 (27%)31 (26%)30 (37%) AVG37 (2%)2 (1%)4 (3%)3 (2%)0 (0%) CVC879 (56%)94 (59%)111 (70%)87 (72%)51 (63%) Not reported1 (<1%)0 (0%) 2010 AVF595 (38%)65 (38%)39 (26%)19 (18%)19 (23%) AVG38 (2%)1 (1%) 5 (5%)1 (1%) CVC927 (59%)105 (61%)109 (73%)82 (77%)61 (75%) Not reported3 (<1%)0 (0%) 2011 AVF703 (43%)94 (42%)47 (30%)30 (34%)16 (22%) AVG29 (2%)2 (1%)1 (1%)0 (0%)1 (1%) CVC891 (55%)127 (56%)108 (69%)59 (66%)56 (77%) Not reported10 (1%)3 (1%)0 (0%) 2012 AVF662 (41%)82 (39%)48 (35%)39 (33%)24 (32%) AVG24 (1%)3 (1%)3 (2%)1 (1%)0 (0%) CVC890 (55%)118 (57%)86 (62%)79 (66%)50 (67%) Not reported32 (2%)5 (2%)1 (1%)0 (0%)1 (1%) 2013 AVF607 (39%)62 (28%)47 (34%)38 (30%)26 (30%) AVG28 (2%)0 (0%) CVC883 (57%)160 (72%)91 (65%)86 (68%)61 (69%) Not reported19 (1%)1 (<1%)2 (1%)2 (2%)1 (1%)
62 (39%)43 (27%)31 (26%)30 (37%) AVG37 (2%)2 (1%)4 (3%)3 (2%)0 (0%) CVC879 (56%)94 (59%)111 (70%)87 (72%)51 (63%) Not reported1 (<1%)0 (0%) 2010 AVF595 (38%)65 (38%)39 (26%)19 (18%)19 (23%) AVG38 (2%)1 (1%) 5 (5%)1 (1%) CVC927 (59%)105 (61%)109 (73%)82 (77%)61 (75%) Not reported3 (<1%)0 (0%) 2011 AVF703 (43%)94 (42%)47 (30%)30 (34%)16 (22%) AVG29 (2%)2 (1%)1 (1%)0 (0%)1 (1%) CVC891 (55%)127 (56%)108 (69%)59 (66%)56 (77%) Not reported10 (1%)3 (1%)0 (0%) 2012 AVF662 (41%)82 (39%)48 (35%)39 (33%)24 (32%) AVG24 (1%)3 (1%)3 (2%)1 (1%)0 (0%) CVC890 (55%)118 (57%)86 (62%)79 (66%)50 (67%) Not reported32 (2%)5 (2%)1 (1%)0 (0%)1 (1%) 2013 AVF607 (39%)62 (28%)47 (34%)38 (30%)26 (30%) AVG28 (2%)0 (0%) CVC883 (57%)160 (72%)91 (65%)86 (68%)61 (69%) Not reported19 (1%)1 (<1%)2 (1%)2 (2%)1 (1%)")
40
2014 ANZDATA Registry 37 th Annual Report Prevalent Vascular Access 2009-2013 YearVascular access AustraliaNew Zealand Non-indigenousAboriginal/TSINon-indigenousMāoriPacific People 2009 AVF5456 (76%)863 (83%)387 (64%)348 (70%)295 (78%) AVG734 (10%)43 (4%)40 (7%)32 (6%)9 (2%) CVC1025 (14%)134 (13%)178 (29%)116 (23%)76 (20%) Not reported9 (<1%)1 (<1%)0 (0%) 2010 AVF5772 (76%)897 (84%)439 (70%)371 (73%)319 (76%) AVG713 (9%)39 (4%)36 (6%)31 (6%)12 (3%) CVC1048 (14%)135 (13%)151 (24%)106 (21%)89 (21%) Not reported17 (<1%)2 (<1%) 0 (0%) 2011 AVF6067 (78%)979 (83%)455 (70%)371 (74%)342 (76%) AVG659 (8%)37 (3%)38 (6%)34 (7%)8 (2%) CVC1036 (13%)151 (13%)153 (24%)95 (19%)99 (22%) Not reported40 (1%)7 (1%)0 (0%)2 (<1%)0 (0%) 2012 AVF6046 (76%)1022 (80%)469 (70%)388 (73%)373 (76%) AVG616 (8%)40 (3%)32 (5%)26 (5%)9 (2%) CVC1101 (14%)165 (13%)160 (24%)113 (21%)101 (21%) Not reported203 (3%)47 (4%)7 (1%)5 (1%)6 (1%) 2013 AVF6274 (77%)1061 (80%)460 (69%)403 (72%)402 (76%) AVG579 (7%)41 (3%)38 (6%)30 (5%)18 (3%) CVC1174 (14%)207 (16%)159 (24%)129 (23%)106 (20%) Not reported115 (1%)17 (1%)5 (1%)1 (<1%)
863 (83%)387 (64%)348 (70%)295 (78%) AVG734 (10%)43 (4%)40 (7%)32 (6%)9 (2%) CVC1025 (14%)134 (13%)178 (29%)116 (23%)76 (20%) Not reported9 (<1%)1 (<1%)0 (0%) 2010 AVF5772 (76%)897 (84%)439 (70%)371 (73%)319 (76%) AVG713 (9%)39 (4%)36 (6%)31 (6%)12 (3%) CVC1048 (14%)135 (13%)151 (24%)106 (21%)89 (21%) Not reported17 (<1%)2 (<1%) 0 (0%) 2011 AVF6067 (78%)979 (83%)455 (70%)371 (74%)342 (76%) AVG659 (8%)37 (3%)38 (6%)34 (7%)8 (2%) CVC1036 (13%)151 (13%)153 (24%)95 (19%)99 (22%) Not reported40 (1%)7 (1%)0 (0%)2 (<1%)0 (0%) 2012 AVF6046 (76%)1022 (80%)469 (70%)388 (73%)373 (76%) AVG616 (8%)40 (3%)32 (5%)26 (5%)9 (2%) CVC1101 (14%)165 (13%)160 (24%)113 (21%)101 (21%) Not reported203 (3%)47 (4%)7 (1%)5 (1%)6 (1%) 2013 AVF6274 (77%)1061 (80%)460 (69%)403 (72%)402 (76%) AVG579 (7%)41 (3%)38 (6%)30 (5%)18 (3%) CVC1174 (14%)207 (16%)159 (24%)129 (23%)106 (20%) Not reported115 (1%)17 (1%)5 (1%)1 (<1%)")
41
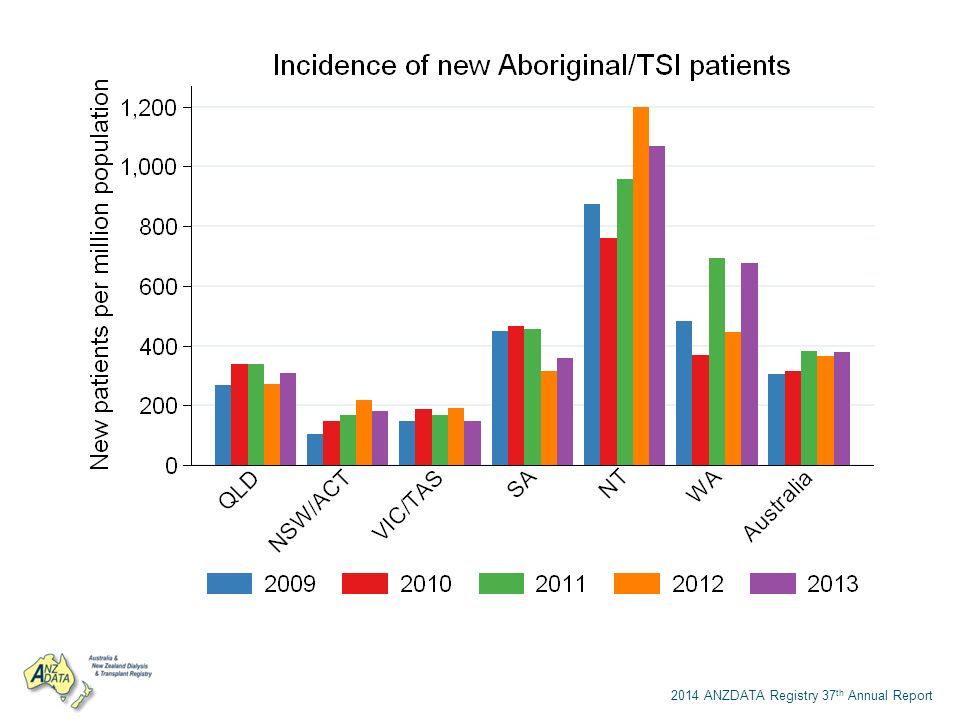
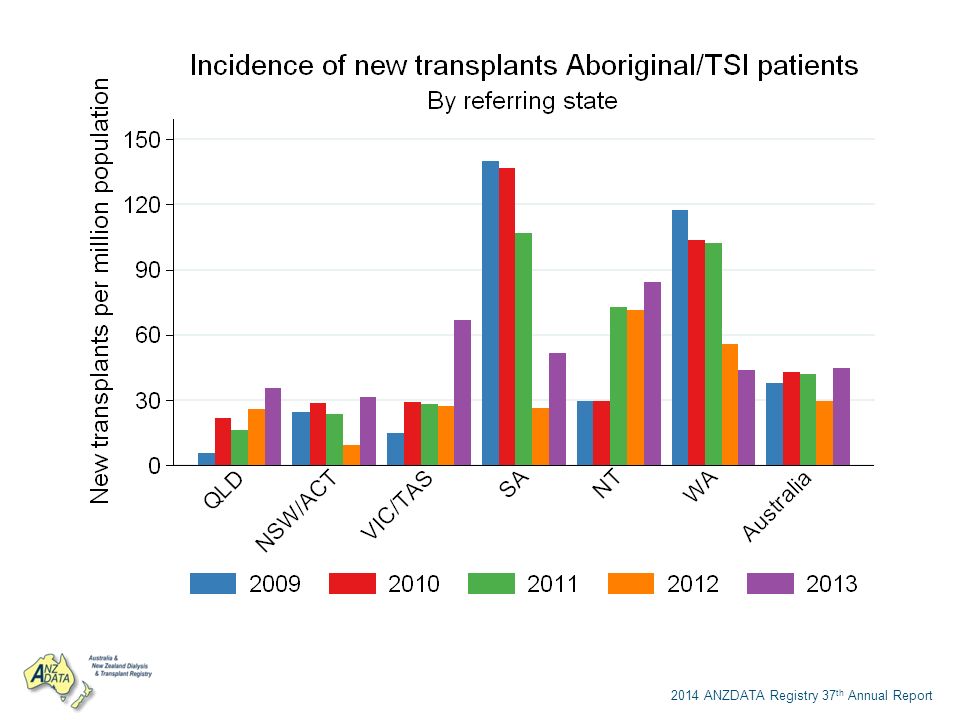
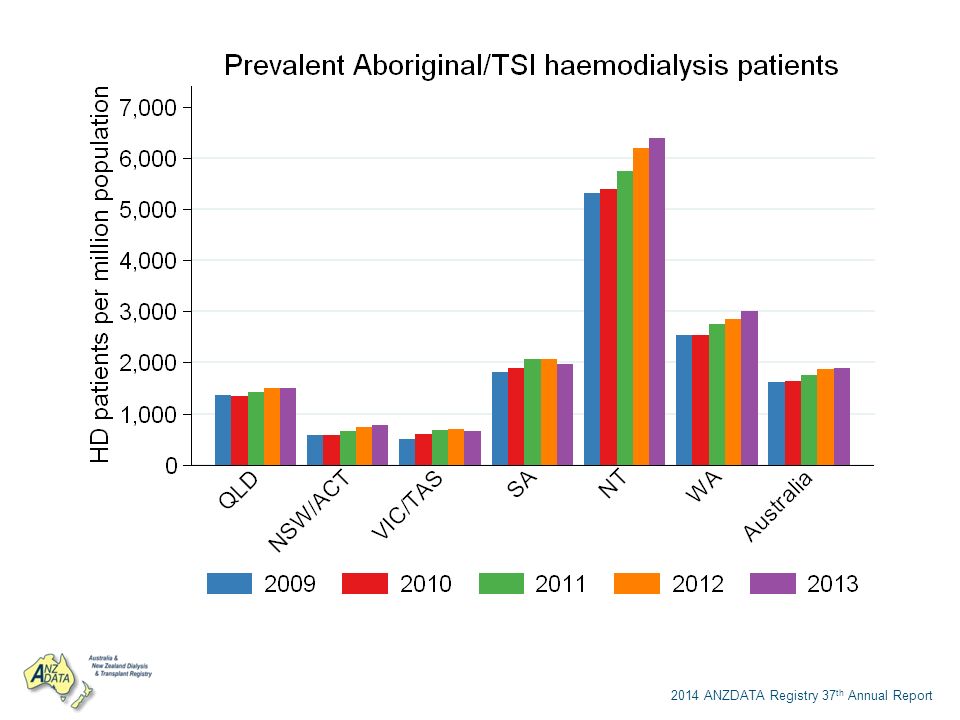
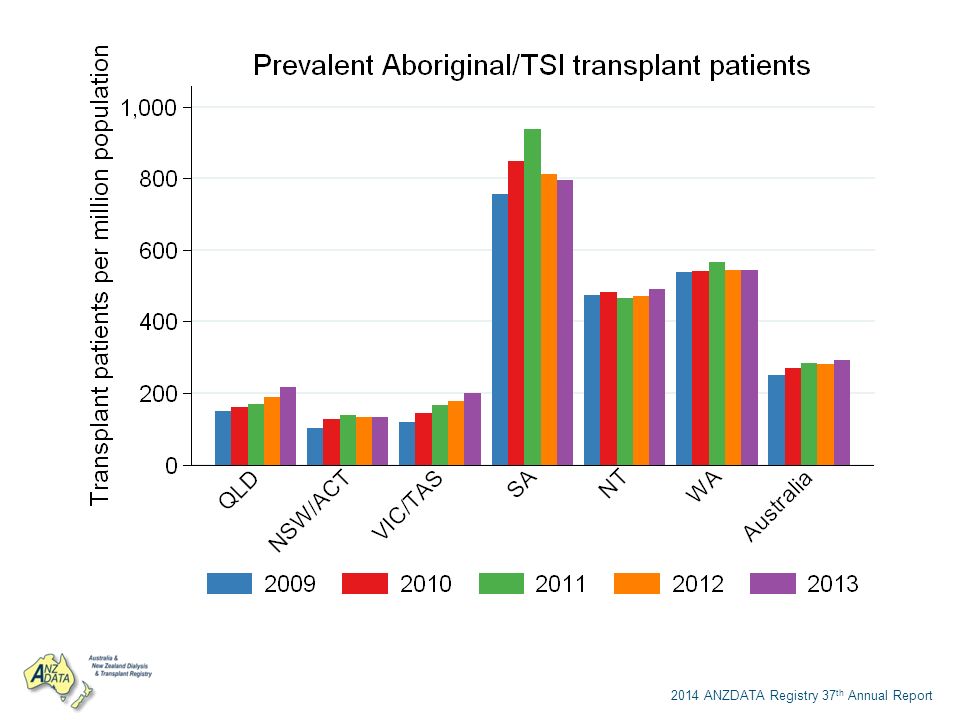
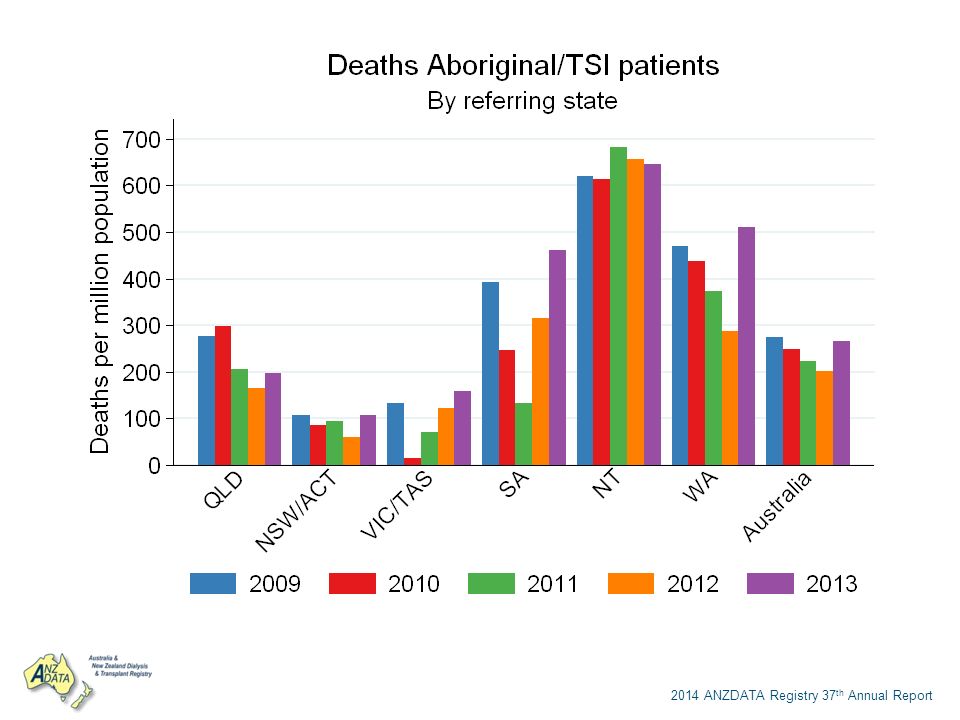
2014 ANZDATA Registry 37 th Annual Report Patient Flow (pmp) Australia 2009-2013 YearEventQLDNSW/ACTVIC/TASSANTWAAustralia 2009 New patients48 (267)21 (102)10 (148)16 (448)59 (871)41 (481)195 (304) New Tx1 (6)6 (29)1 (15)7 (196)0 (0)9 (106)24 (37) Preemptive Tx0 (0)2 (10)0 (0) 2 (3) Prevalent dialysis295 (1639)143 (693)39 (577)72 (2018)381 (5627)253 (2969)1183 (1841) Prevalent Tx27 (150)21 (102)8 (118)27 (757)32 (473)46 (540)161 (251) Total prevalence322 (1789)164 (795)47 (696)99 (2774)413 (6099)299 (3509)1344 (2092) Deaths50 (278)22 (107)9 (133)14 (392)42 (620)40 (469)177 (275) 2010 New patients62 (336)31 (147)13 (187)17 (465)52 (761)32 (369)207 (315) New Tx4 (22)6 (28)2 (29)7 (191)0 (0)9 (104)28 (43) Preemptive Tx0 (0) Prevalent dialysis297 (1609)153 (727)47 (678)71 (1942)397 (5811)249 (2868)1214 (1850) Prevalent Tx30 (163)27 (128)10 (144)31 (848)33 (483)47 (541)178 (271) Total prevalence327 (1772)180 (855)57 (822)102 (2789)430 (6294)296 (3410)1392 (2121) Deaths55 (298)18 (85)1 (14)9 (246)42 (615)38 (438)163 (248) 2011 New patients64 (339)36 (168)12 (169)17 (454)66 (959)61 (691)256 (383) New Tx4 (21)4 (19)2 (28)9 (241)0 (0)9 (102)28 (42) Preemptive Tx0 (0) Prevalent dialysis323 (1709)164 (764)52 (731)79 (2112)415 (6028)274 (3104)1307 (1953) Prevalent Tx32 (169)30 (140)12 (169)35 (936)32 (465)50 (566)191 (285) Total prevalence355 (1879)194 (904)64 (899)114 (3047)447 (6492)324 (3671)1498 (2238) Deaths39 (206)20 (93)5 (70)5 (134)47 (683)33 (374)149 (223) 2012 New patients52 (269)48 (219)14 (191)12 (314)84 (1200)40 (444)250 (366) New Tx5 (26)2 (9)2 (27)6 (157)0 (0)5 (56)20 (29) Preemptive Tx0 (0) Prevalent dialysis340 (1757)197 (900)57 (779)84 (2200)453 (6473)287 (3186)1418 (2074) Prevalent Tx37 (191)29 (133)13 (178)31 (812)33 (472)49 (544)192 (281) Total prevalence377 (1948)226 (1033)70 (956)115 (3011)486 (6945)336 (3730)1610 (2354) Deaths32 (165)13 (59)9 (123)12 (314)46 (657)26 (289)138 (202) 2013 New patients61 (308)40 (179)11 (147)14 (359)76 (1068)62 (674)264 (378) New Tx7 (35)7 (31)5 (67)8 (205)0 (0)4 (44)31 (44) Preemptive Tx0 (0) Prevalent dialysis356 (1795)208 (932)54 (720)82 (2103)477 (6706)301 (3274)1478 (2116) Prevalent Tx43 (217)30 (134)15 (200)31 (795)35 (492)50 (544)204 (292) Total prevalence399 (2012)238 (1066)69 (920)113 (2898)512 (7198)351 (3818)1682 (2408) Deaths39 (197)24 (108)12 (160)18 (462)46 (647)47 (511)186 (266)
 Australia YearEventQLDNSW/ACTVIC/TASSANTWAAustralia 2009 New patients48 (267)21 (102)10 (148)16 (448)59 (871)41 (481)195 (304) New Tx1 (6)6 (29)1 (15)7 (196)0 (0)9 (106)24 (37) Preemptive Tx0 (0)2 (10)0 (0) 2 (3) Prevalent dialysis295 (1639)143 (693)39 (577)72 (2018)381 (5627)253 (2969)1183 (1841) Prevalent Tx27 (150)21 (102)8 (118)27 (757)32 (473)46 (540)161 (251) Total prevalence322 (1789)164 (795)47 (696)99 (2774)413 (6099)299 (3509)1344 (2092) Deaths50 (278)22 (107)9 (133)14 (392)42 (620)40 (469)177 (275) 2010 New patients62 (336)31 (147)13 (187)17 (465)52 (761)32 (369)207 (315) New Tx4 (22)6 (28)2 (29)7 (191)0 (0)9 (104)28 (43) Preemptive Tx0 (0) Prevalent dialysis297 (1609)153 (727)47 (678)71 (1942)397 (5811)249 (2868)1214 (1850) Prevalent Tx30 (163)27 (128)10 (144)31 (848)33 (483)47 (541)178 (271) Total prevalence327 (1772)180 (855)57 (822)102 (2789)430 (6294)296 (3410)1392 (2121) Deaths55 (298)18 (85)1 (14)9 (246)42 (615)38 (438)163 (248) 2011 New patients64 (339)36 (168)12 (169)17 (454)66 (959)61 (691)256 (383) New Tx4 (21)4 (19)2 (28)9 (241)0 (0)9 (102)28 (42) Preemptive Tx0 (0) Prevalent dialysis323 (1709)164 (764)52 (731)79 (2112)415 (6028)274 (3104)1307 (1953) Prevalent Tx32 (169)30 (140)12 (169)35 (936)32 (465)50 (566)191 (285) Total prevalence355 (1879)194 (904)64 (899)114 (3047)447 (6492)324 (3671)1498 (2238) Deaths39 (206)20 (93)5 (70)5 (134)47 (683)33 (374)149 (223) 2012 New patients52 (269)48 (219)14 (191)12 (314)84 (1200)40 (444)250 (366) New Tx5 (26)2 (9)2 (27)6 (157)0 (0)5 (56)20 (29) Preemptive Tx0 (0) Prevalent dialysis340 (1757)197 (900)57 (779)84 (2200)453 (6473)287 (3186)1418 (2074) Prevalent Tx37 (191)29 (133)13 (178)31 (812)33 (472)49 (544)192 (281) Total prevalence377 (1948)226 (1033)70 (956)115 (3011)486 (6945)336 (3730)1610 (2354) Deaths32 (165)13 (59)9 (123)12 (314)46 (657)26 (289)138 (202) 2013 New patients61 (308)40 (179)11 (147)14 (359)76 (1068)62 (674)264 (378) New Tx7 (35)7 (31)5 (67)8 (205)0 (0)4 (44)31 (44) Preemptive Tx0 (0) Prevalent dialysis356 (1795)208 (932)54 (720)82 (2103)477 (6706)301 (3274)1478 (2116) Prevalent Tx43 (217)30 (134)15 (200)31 (795)35 (492)50 (544)204 (292) Total prevalence399 (2012)238 (1066)69 (920)113 (2898)512 (7198)351 (3818)1682 (2408) Deaths39 (197)24 (108)12 (160)18 (462)46 (647)47 (511)186 (266)")
42
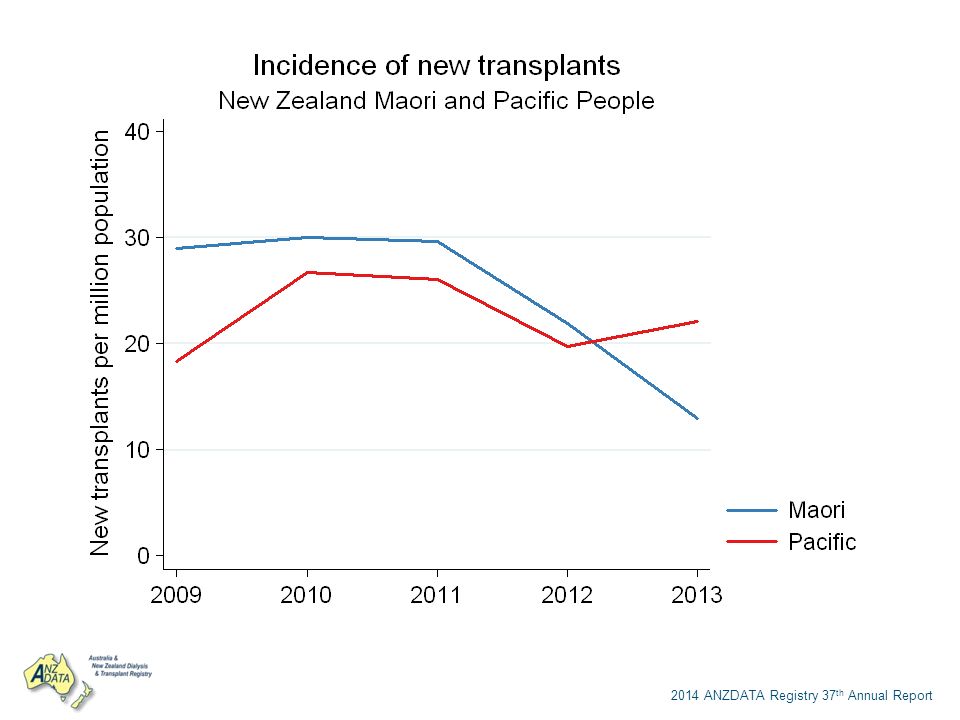
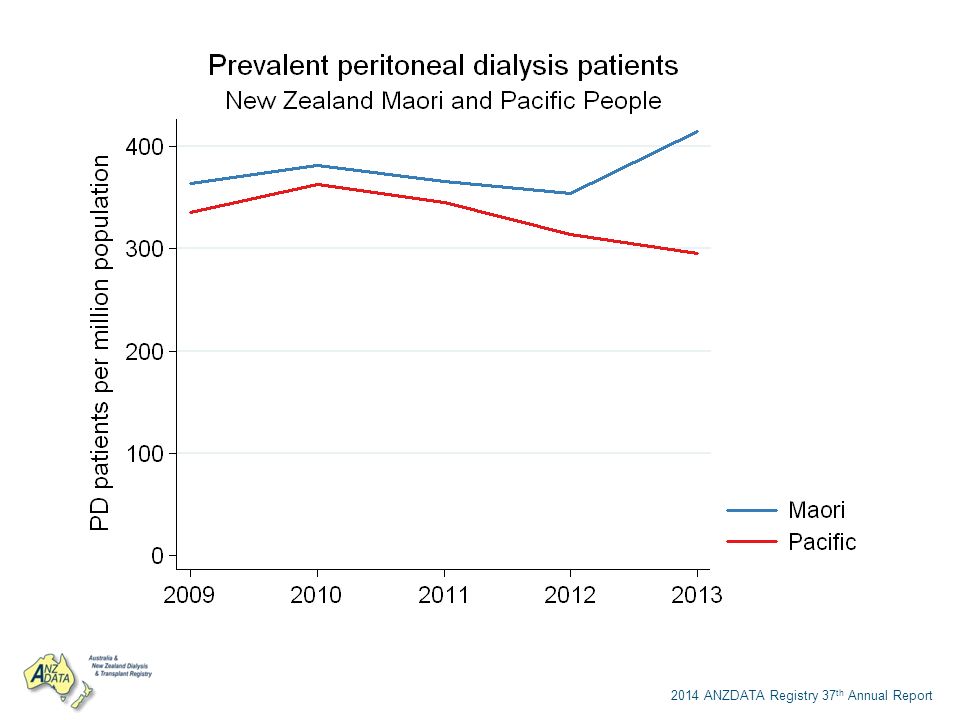
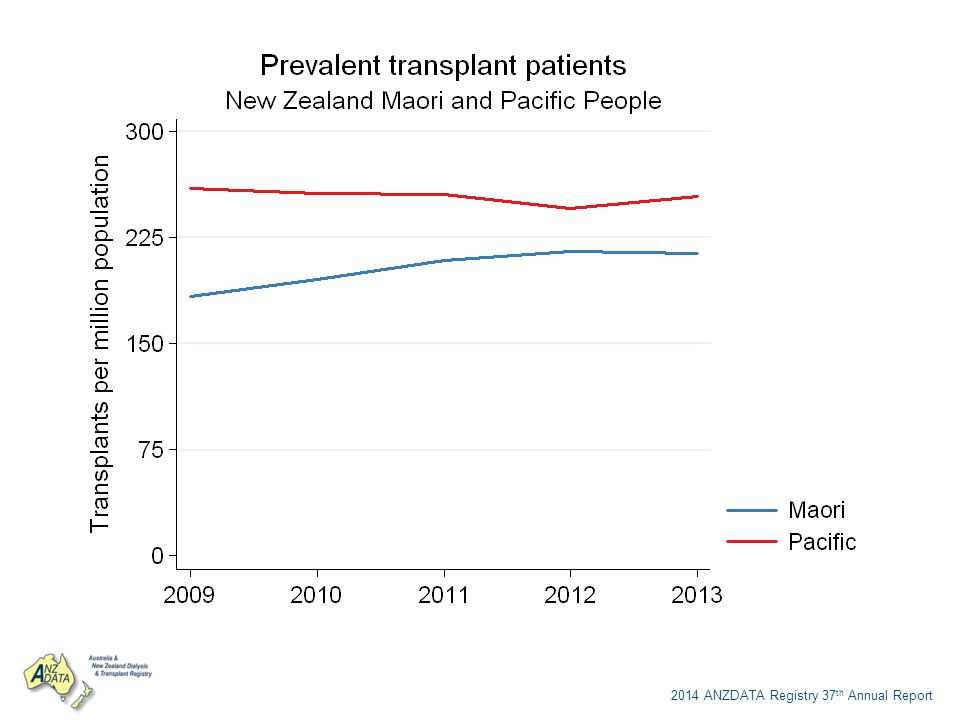
2014 ANZDATA Registry 37 th Annual Report Patient Flow (pmp) New Zealand 2009-2013 YearEventNon-indigenousMāoriPacific 2009 New patients303 (91)178 (272)103 (315) New Tx96 (29)19 (29)6 (18) Preemptive Tx22 (7)2 (3)0 (0) Prevalent dialysis1057 (318)734 (1121)490 (1496) Prevalent Tx1202 (362)120 (183)85 (260) Total prevalence2259 (680)854 (1304)575 (1756) Deaths194 (58)126 (192)48 (147) 2010 New patients251 (75)155 (233)109 (324) New Tx81 (24)20 (30)9 (27) Preemptive Tx14 (4)2 (3)0 (0) Prevalent dialysis1084 (324)762 (1144)542 (1612) Prevalent Tx1228 (367)130 (195)86 (256) Total prevalence2312 (690)892 (1340)628 (1868) Deaths190 (57)115 (173)50 (149) 2011 New patients262 (78)130 (192)95 (275) New Tx89 (26)20 (30)9 (26) Preemptive Tx15 (4)0 (0) Prevalent dialysis1075 (320)749 (1109)568 (1646) Prevalent Tx1257 (374)141 (209)88 (255) Total prevalence2332 (693)890 (1318)656 (1901) Deaths223 (66)132 (195)61 (177) 2012 New patients255 (76)168 (246)94 (266) New Tx86 (26)15 (22)7 (20) Preemptive Tx16 (5)1 (1)1 (3) Prevalent dialysis1093 (324)774 (1131)600 (1697) Prevalent Tx1287 (382)147 (215)87 (246) Total prevalence2380 (706)921 (1346)687 (1943) Deaths201 (60)132 (193)63 (178) 2013 New patients248 (73)187 (270)111 (306) New Tx98 (29)9 (13)8 (22) Preemptive Tx16 (5)2 (3)1 (3) Prevalent dialysis1100 (325)850 (1228)634 (1748) Prevalent Tx1332 (393)148 (214)92 (254) Total prevalence2432 (718)998 (1442)726 (2002) Deaths200 (59)115 (166)66 (182)
 New Zealand YearEventNon-indigenousMāoriPacific 2009 New patients303 (91)178 (272)103 (315) New Tx96 (29)19 (29)6 (18) Preemptive Tx22 (7)2 (3)0 (0) Prevalent dialysis1057 (318)734 (1121)490 (1496) Prevalent Tx1202 (362)120 (183)85 (260) Total prevalence2259 (680)854 (1304)575 (1756) Deaths194 (58)126 (192)48 (147) 2010 New patients251 (75)155 (233)109 (324) New Tx81 (24)20 (30)9 (27) Preemptive Tx14 (4)2 (3)0 (0) Prevalent dialysis1084 (324)762 (1144)542 (1612) Prevalent Tx1228 (367)130 (195)86 (256) Total prevalence2312 (690)892 (1340)628 (1868) Deaths190 (57)115 (173)50 (149) 2011 New patients262 (78)130 (192)95 (275) New Tx89 (26)20 (30)9 (26) Preemptive Tx15 (4)0 (0) Prevalent dialysis1075 (320)749 (1109)568 (1646) Prevalent Tx1257 (374)141 (209)88 (255) Total prevalence2332 (693)890 (1318)656 (1901) Deaths223 (66)132 (195)61 (177) 2012 New patients255 (76)168 (246)94 (266) New Tx86 (26)15 (22)7 (20) Preemptive Tx16 (5)1 (1)1 (3) Prevalent dialysis1093 (324)774 (1131)600 (1697) Prevalent Tx1287 (382)147 (215)87 (246) Total prevalence2380 (706)921 (1346)687 (1943) Deaths201 (60)132 (193)63 (178) 2013 New patients248 (73)187 (270)111 (306) New Tx98 (29)9 (13)8 (22) Preemptive Tx16 (5)2 (3)1 (3) Prevalent dialysis1100 (325)850 (1228)634 (1748) Prevalent Tx1332 (393)148 (214)92 (254) Total prevalence2432 (718)998 (1442)726 (2002) Deaths200 (59)115 (166)66 (182)")
43
2014 ANZDATA Registry 37 th Annual Report Cause of Death 2013 ModalityCause of death AustraliaNew Zealand Non-indigenousAboriginal/TSI Non- indigenous Māori Pacific People Dialysis Cardiovascular390 (29%)69 (39%)59 (36%)52 (47%)30 (45%) Withdrawal521 (39%)36 (20%)47 (28%)19 (17%)5 (8%) Cancer57 (4%)4 (2%)3 (2%)2 (2%)2 (3%) Infection107 (8%)17 (10%)24 (14%)18 (16%)13 (20%) Other266 (20%)51 (29%)33 (20%)19 (17%)16 (24%) Total134117716611066 Transplant Cardiovascular53 (25%)2 (22%)8 (30%)0 (0%) Withdrawal18 (8%)0 (0%)2 (7%)0 (0%) Cancer62 (29%)0 (0%)8 (30%)1 (25%)0 (0%) Infection37 (17%)1 (11%)4 (15%)1 (25%)0 (0%) Other46 (21%)6 (67%)5 (19%)2 (50%)0 (0%) Total21692740
69 (39%)59 (36%)52 (47%)30 (45%) Withdrawal521 (39%)36 (20%)47 (28%)19 (17%)5 (8%) Cancer57 (4%)4 (2%)3 (2%)2 (2%)2 (3%) Infection107 (8%)17 (10%)24 (14%)18 (16%)13 (20%) Other266 (20%)51 (29%)33 (20%)19 (17%)16 (24%) Total Transplant Cardiovascular53 (25%)2 (22%)8 (30%)0 (0%) Withdrawal18 (8%)0 (0%)2 (7%)0 (0%) Cancer62 (29%)0 (0%)8 (30%)1 (25%)0 (0%) Infection37 (17%)1 (11%)4 (15%)1 (25%)0 (0%) Other46 (21%)6 (67%)5 (19%)2 (50%)0 (0%) Total")
Similar presentations


807153,37199 Country of residence Australia6908644,25683.>")


 632 (13%) 1317 (27%) 1335 (27%) Number of Patients Australia 31-Dec-96.>")


 2012 Annual Report—35th Edition ANZDATA.>")

