Download presentation
Presentation is loading. Please wait.

1
iZoom: A Better Way to View Large Data Sets? Mike Ashmore CPSC 462

2
Problem: Eye Trackers Suck. Interactive applications reveal just how noisy and error-prone eye tracker data is ~1˚ tracking accuracy on a good calibration Up to 30-40 pixels error on a high- resolution display High jitter of data just makes reliable selection that much harder

3
Problem: Application Designers Suck. Teeny-tiny portions of the screen need to be accurately selected. Everything in WinAmp / XMMS: 6-8 pixels Microsoft Word ruler bar (tabs, etc.): 2 pixels Image editing applications / WYSIWYG print layout tools: 1 pixel But they’ve been offering a magnifier tool for ages now! Perhaps there’s a lesson to be learned …
: 2 pixels Image editing applications / WYSIWYG print layout tools: 1 pixel But they’ve been offering a magnifier tool for ages now. Perhaps there’s a lesson to be learned ….")
4
Solution #1: Make everything bigger so it’s easier to select (the DUPLO approach) Since it works so well for image editors, we’ll just magnify the whole screen. Big wins: Faster, less fatiguing selection of UI elements (c.f. Fitts’ Law) Lossage: Amount of information available decreases in proportion to the square of the magnification (2x magnification = 1/4 as much information)
 Lossage: Amount of information available decreases in proportion to the square of the magnification (2x magnification = 1/4 as much information).")
5
Solution #2: Let the display slide around on a virtual desktop Big wins: You get unlimited desktop real estate. Icons can be as chunky as you want for fast selection of targets within display. Lossage: Very little context available for data. Again, 2x magnification of the virtual desktop leaves 3/4 of the desktop non- visible at all times.

6
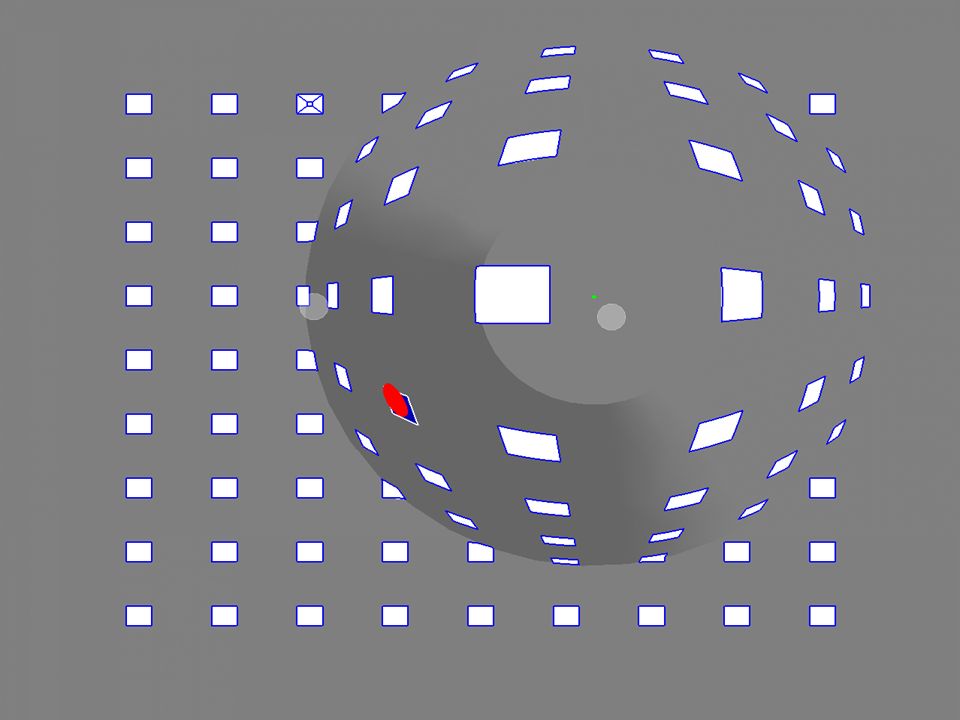
iZoom Solution: Gaze- Contingent Fisheye Displays Big win: A portion of the screen is magnified, but context is still available in the periphery. Best of both worlds! Possible Problem: Can people use it without getting motion sickness? Other Possible Problem: Curiously, nobody else seems to have published much on this idea. Maybe it hasn’t worked for anybody else, either.

8
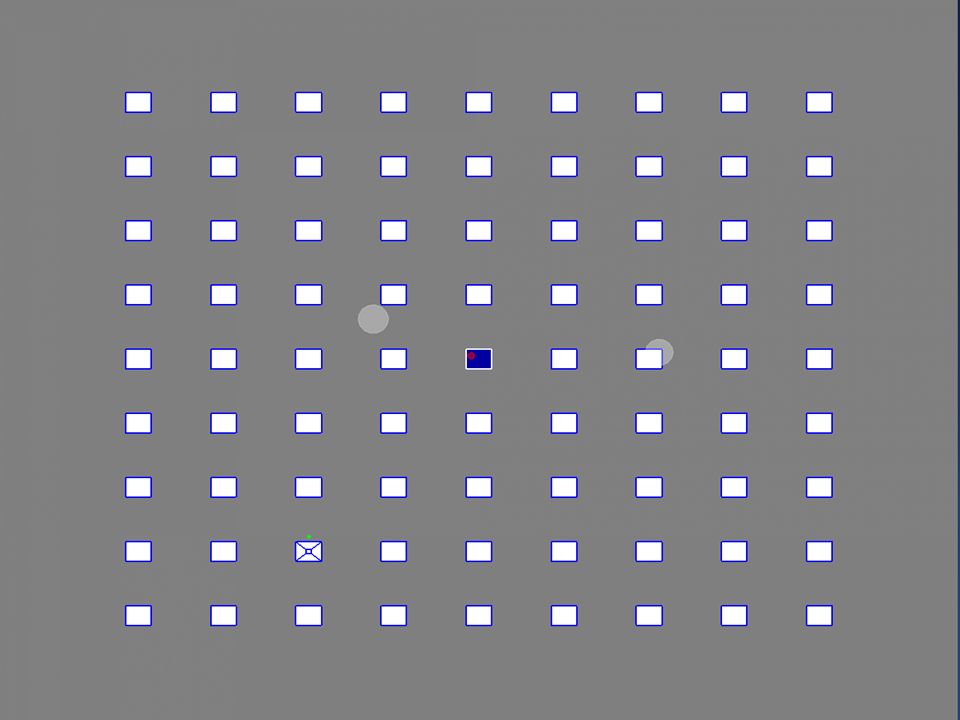
The Experiment Simple selection task: look at the window with the “X” Three conditions: Non-fisheye (the control condition) Naïve fisheye Always-on version of lens “Smart” fisheye Lens only appears after detecting a certain “intentness” of fixation
 Naïve fisheye Always-on version of lens Smart fisheye Lens only appears after detecting a certain intentness of fixation")
10
Challenges Bad Calibration = Frustrated test subject A Bug! Tobii never reports more than 200 calibration data points. Are calibrations being truncated? Solution: More sophisticated calibration routine Don’t take calibration samples until we’re fairly certain subject is fixating in the right spot Redo calibration points that deviate too far from actual screen coordinates. Be fascist about it until every single point is near perfect

11
Challenges The enemy of fisheye performance: the Gutwin effect (aka the oscillating lens of doom). Cause: Non-intuitive mapping from control to display Look one inch to the left, expect to see the lens move exactly one inch to the left in “data space” Particularly troublesome because display and control are so confounded together

12
The Gutwin Effect Techniques to address this issue: Remap control space to match distorted visual field Don’t distort visual field at all (Miniotas / 2004: expanding target zones) Grab and hold fisheye at position of initial fixation
 Grab and hold fisheye at position of initial fixation")
13
Data Chart

14
Data Analysis Use of postgreSQL for outlier analysis Outlier criterion: Future work (this evening, probably): Integrate SQL and R mathematical analysis package for instant build of results
: Integrate SQL and R mathematical analysis package for instant build of results")
15
Future Work More sophisticated data analysis. This is clearly a non-normal distribution. What is it, then? Gamma? Beta? Select-and-hold fisheye Center fixation at start of trials Counting task - when selection is not an issue, does fisheye improve performance (accuracy / speed) on detailed inspection tasks?
 on detailed inspection tasks .")
Similar presentations