Download presentation
Presentation is loading. Please wait.

1
RBA Results-Based Accountability The Fiscal Policy Studies Institute www.raguide.org www.resultsaccountability.com Book - DVD Orders amazon.com resultsleadership.org TM MASTER CLASS

2
START WITH SUCCESS STORIES

12
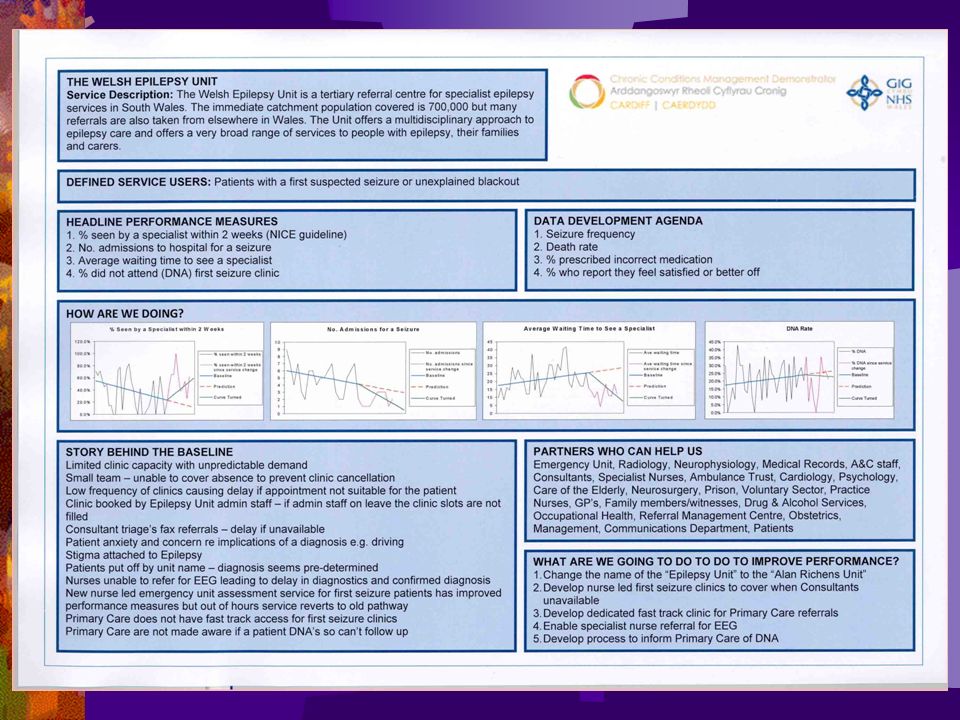
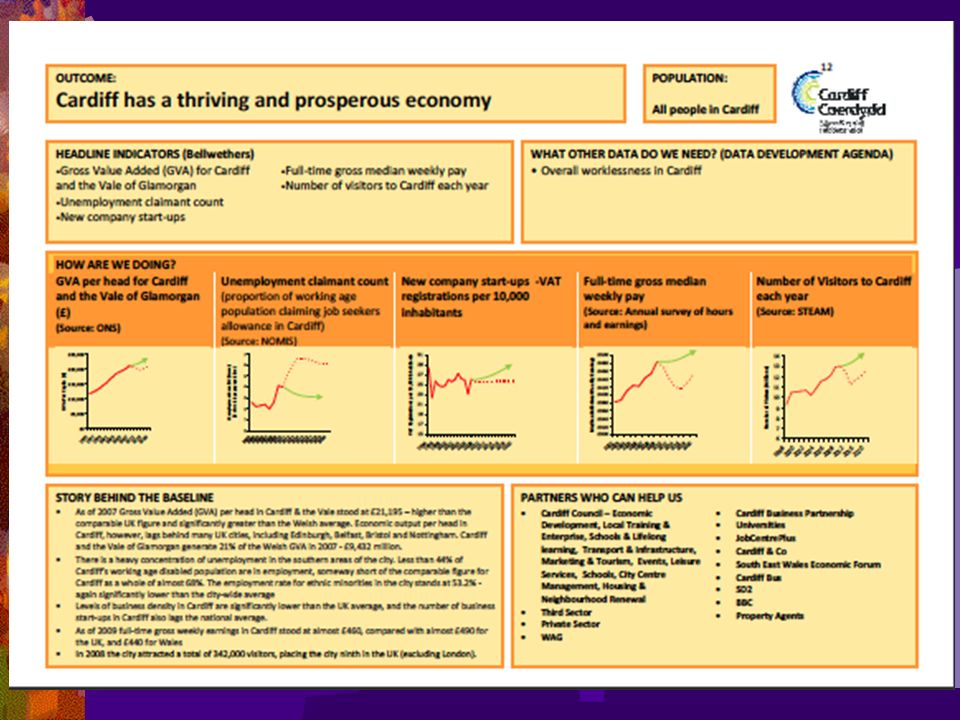
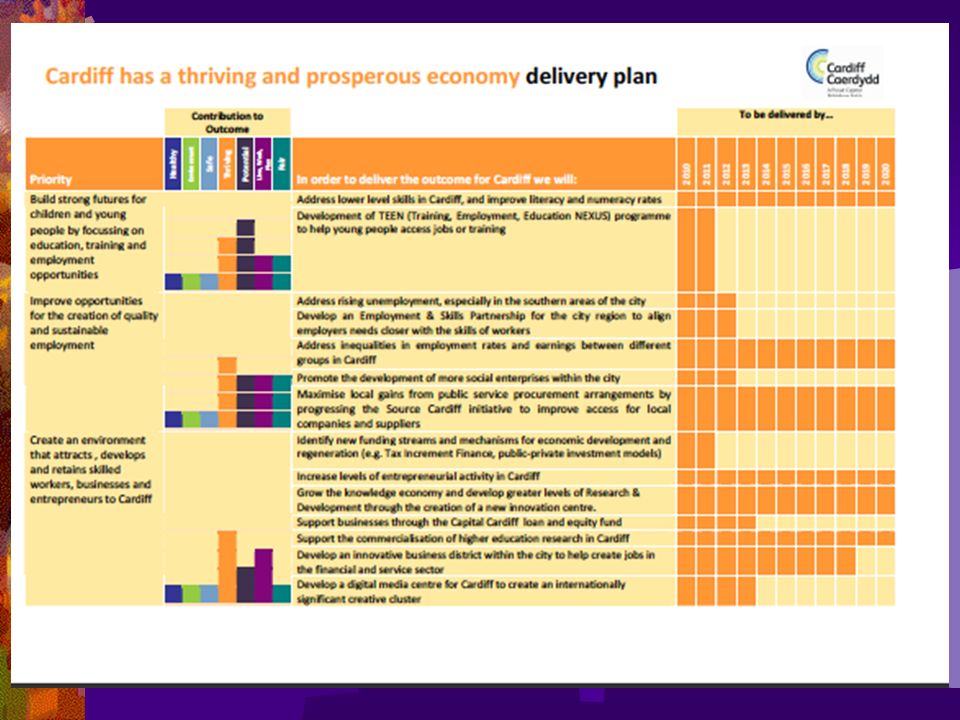
CARDIFF, WALES Community Outcomes 1. People in Cardiff are healthy 2. Cardiff has a clean attractive and sustainable environment 3. People in Cardiff are safe and feel safe 4. Cardiff has a thriving and prosperous economy 5. People in Cardiff achieve their full potential. 6. Cardiff is a great place to live, work and play. 7. Cardiff has a fair, just and inclusive society.

15
Community Indicators Victoria McCaughey Centre, School of Population Health, University of Melbourne (Sue West)
")
16
Review of BASIC CONCEPTS

17
Results-Based Accountability is made up of two parts: Performance Accountability is about the well-being of CUSTOMER POPULATIONS for Programs – Agencies – Service Systems Population Accountability is about the well-being of WHOLE POPULATIONS for Communities – Cities – Counties – States - Nations Population Accountability Performance Accountability 12

18
THE LANGUAGE TRAP Too many terms. Too few definitions. Too little discipline Benchmark Target IndicatorGoal Result Objective Outcome Measure Modifiers Measurable Core Urgent Qualitative Priority Programmatic Targeted Performance Incremental Strategic Systemic Lewis Carroll Center for Language Disorders Measurable urgent systemic indicators Core qualitative strategic objectives Make up your own jargon.

19
DEFINITIONS Children born healthy, Children ready for school, Safe communities, Clean Environment, Prosperous Economy Rate of low-birthweight babies, Percent ready at K entry, crime rate, air quality index, unemployment rate RESULT or OUTCOME INDICATOR or BENCHMARK PERFORMANCE MEASURE A condition of well-being for children, adults, families or communities. A measure which helps quantify the achievement of a result. A measure of how well a program, agency or service system is working. Three types: Population Performance Children born healthy Rate of low-birthweight babiesPercent ready at K entry Children ready for school crime rate Safe communities air quality index Clean Environment unemployment rate Prosperous Economy INDICATOR RESULT PERFORMANCE MEASURE Population Performance = Customer Results 5 4 3 6 How much did we do? 7 How well did we do it? 8 Is anyone better off?

20
TALK to ACTION "TURN the CURVE" THINKING

21
Leaking Roof (Results thinking in everyday life) Experience Measure Story behind the baseline (causes) Partners What Works Action Plan Inches of Water 9 BASELINE ? Fixed Not OK 10 Turning the Curve Action Plan # 2

22
Results / Outcomes Indicators Baseline & Story Experience

23
LR UR Primary v. Secondary Direct v. Indirect Internal v. External Baseline & Story

24
CONNECTING POPULATION & PERFORMANCE

25
Contribution relationship Alignment of measures Appropriate responsibility THE LINKAGE Between POPULATION and PERFORMANCE POPULATION ACCOUNTABILITY Healthy People Rate of low birth-weight babies Clean Environment Percent fully ready per K-entry assessment Prosperous Economy Rate of unemployment CUSTOMER RESULTS # persons receiving training Unit cost per person trained # who get jobs & keep jobs (at 6 months) % who get jobs & keep jobs (at 6 months) PERFORMANCE ACCOUNTABILITY POPULATION RESULTS Job Training Program
 % who get jobs & keep jobs (at 6 months) PERFORMANCE ACCOUNTABILITY POPULATION RESULTS Job Training Program")
27
3 - kinds of performance measures. How much did we do? How well did we do it? Is anyone better off? RBA in a Nutshell 2 – 3 - 7 2 - kinds of accountability Population accountability Performance accountability 7 - questions from ends to means in less than an hour. plus language discipline Results & Indicators Performance measures Baselines & Turning the Curve

28
“If you do what you always did, you will get what you always got.” Kenneth W. Jenkins President, Yonkers NY NAACP

29
Thank You!! Book - DVD Orders amazon.com resultsleadership.org www.raguide.org www.resultsaccountability.com RBA Facebook Group

30
EXERCISES

31
The Simplest Way TO IMPLEMENT RBA POPULATION ACCOUNTABILITY 1. Pick an important indicator curve 2. Run the Population Turn the Curve Exercise 3. Take action Repeat PERFORMANCE ACCOUNTABILITY 1. Pick an important performance measure curve 2. Run the Performance Turn the Curve Exercise 3. Take action Repeat

32
Creating a Working Baseline from Group Knowledge Now Indicator or Performance Measure 65% Not OK? Backcasting Forecasting

33
Turn the Curve Exercise: Population Well-being 5 min:Starting Points - timekeeper and reporter - geographic area - two hats (yours plus partner’s) 10 min:Baseline - pick a result and a curve to turn - forecast (to 2018 ) – OK or not OK? 15 min:Story behind the baseline - causes/forces at work - information & research agenda part 1 - causes 15 min:What works? (What would it take?) - what could work to do better? - each partners contribution - no-cost / low-cost ideas - information & research agenda part 2 – what works 10 min:Report convert notes to one page Two pointers to action
 - what could work to do better. - each partners contribution - no-cost / low-cost ideas - information & research agenda part 2 – what works 10 min:Report convert notes to one page Two pointers to action.")
34
ONE PAGE Turn the Curve Report: Population Result: _______________ Indicator (Lay Definition) Indicator Baseline Story behind the baseline --------------------------- --------------------------- (List as many as needed) Partners --------------------------- --------------------------- (List as many as needed) Three Best Ideas – What Works 1. --------------------------- 2. --------------------------- 3. ---------No-cost / low-cost Sharp Edges 4. --------- Off the Wall

35
Turn the Curve Exercise: Program Performance 5 min:Starting Points - timekeeper and reporter - identify a program to work on - two hats (yours plus partner’s) 10 min:Performance measure baseline - choose 1 measure to work on – from the lower right quadrant - forecast (to 2018 ) – OK or not OK? 15 min:Story behind the baseline - causes/forces at work - information & research agenda part 1 - causes 15 min:What works? (What would it take?) - what could work to do better? - each partners contribution - no-cost / low-cost ideas - information & research agenda part 2 – what works 10 min:Report convert notes to one page Two pointers to action
 - what could work to do better. - each partners contribution - no-cost / low-cost ideas - information & research agenda part 2 – what works 10 min:Report convert notes to one page Two pointers to action.")
36
Program: _______________ Performance Measure (Lay definition) Performance Measure Baseline Story behind the baseline --------------------------- --------------------------- (List as many as needed) Partners --------------------------- --------------------------- (List as many as needed) Three Best Ideas – What Works 1. --------------------------- 2. --------------------------- 3. ---------No-cost / low-cost ONE PAGE Turn the Curve Report: Performance Sharp Edges 4. --------- Off the Wall

37
Turn the Curve Exercise – Lessons Talk to Action in an hour 1. How was this different from other processes? What worked and what didn’t work? 2. Why did we ask for: a. Results before indicators? b. Forecast? c. Story? d. No cost / low cost? e. Two hats? f. Crazy idea? g. Only 3 best ideas? 3. Do you think a lay audience could understand the reports? 4. How many think you could lead this exercise with a small group? (2+ curves at the same time)
.")
38
How to choose Performance Measures

39
How much did we do? Performance Accountability Types of Measures found in each Quadrant How well did we do it? Is anyone better off? # Clients/customers served # Activities (by type of activity) % Common measures e.g. client staff ratio, workload ratio, staff turnover rate, staff morale, % staff fully trained, % clients seen in their own language, worker safety, unit cost % Skills / Knowledge (e.g. parenting skills) # % Attitude / Opinion (e.g. toward drugs) # % Behavior (e.g.school attendance) # % Circumstance (e.g. working, in stable housing) # % Activity-specific measures e.g. % timely, % clients completing activity, % correct and complete, % meeting standard Point in Time vs. 2 Point Comparison # %
 % Common measures e.g. client staff ratio, workload ratio, staff turnover rate, staff morale, % staff fully trained, % clients seen in their own language, worker safety, unit cost % Skills / Knowledge (e.g. parenting skills) # % Attitude / Opinion (e.g. toward drugs) # % Behavior (e.g.school attendance) # % Circumstance (e.g. working, in stable housing) # % Activity-specific measures e.g. % timely, % clients completing activity, % correct and complete, % meeting standard Point in Time vs. 2 Point Comparison # %.")
40
How much did we do? Service: __________________________________ How well did we do it? Is anyone better off? Primary customers # studentspatients persons trained Primary activity # hours of instruction diagnostic testsjob coursesalarms responded to If your service works really well, how are your customer's better off? # students who graduate patients who fully recover fires kept to room of origin % Unit cost Workload ratio % of ___x___ that happen on time persons who get jobs School HospitalJob Training Fire Department

41
OPEN SPACE - Two lessons - One question

42
Next Generation Contracting Contract Provisions Provision 1. Specify the 3 to 5 most important performance measures (from the How well did we do it? and Is anyone better off? categories). Provision 2. Specify that the contractor will use a continuous improvement process (the RBA 7 Questions). Provision 3. Specify how the funder and contractor will work in partnership to maximize LR customer results (quarterly meetings using the 7 questions as the agenda). Provision 4. Specify that the funder will work with the funding community to simplify and standardize contracting and performance reporting.
. Provision 2. Specify that the contractor will use a continuous improvement process (the RBA 7 Questions). Provision 3. Specify how the funder and contractor will work in partnership to maximize LR customer results (quarterly meetings using the 7 questions as the agenda). Provision 4. Specify that the funder will work with the funding community to simplify and standardize contracting and performance reporting..")
43
Provision 5: : Clear articulation of role in population/community well-being using the language of contribution not attribution. Provision 6: 10% for quality management and administration. Provision 7: Multi-year funding using 3 year rolling contracts Provision 8: Use of targets that are fair and useful. Provision 9: Fund flexibility and virtual funding pool: transfer of up to 10% across line items and program lines. Provision 10: Request for Results: Getting past the sometimes negative effects of competitive RFP contracting or tendering. Next Generation Contracting Contract Provisions

44
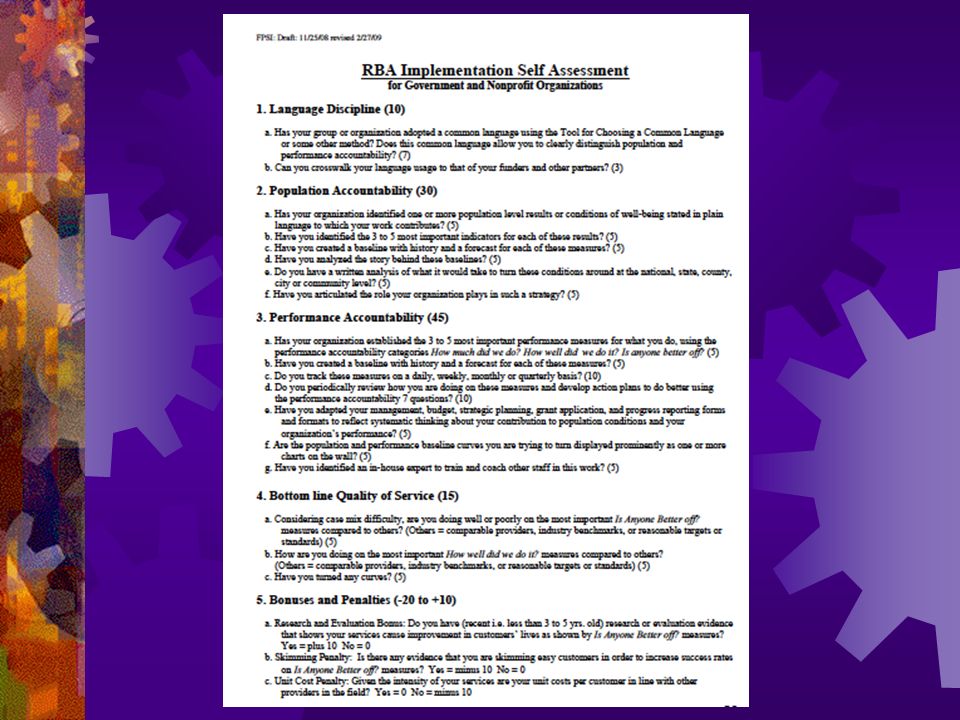
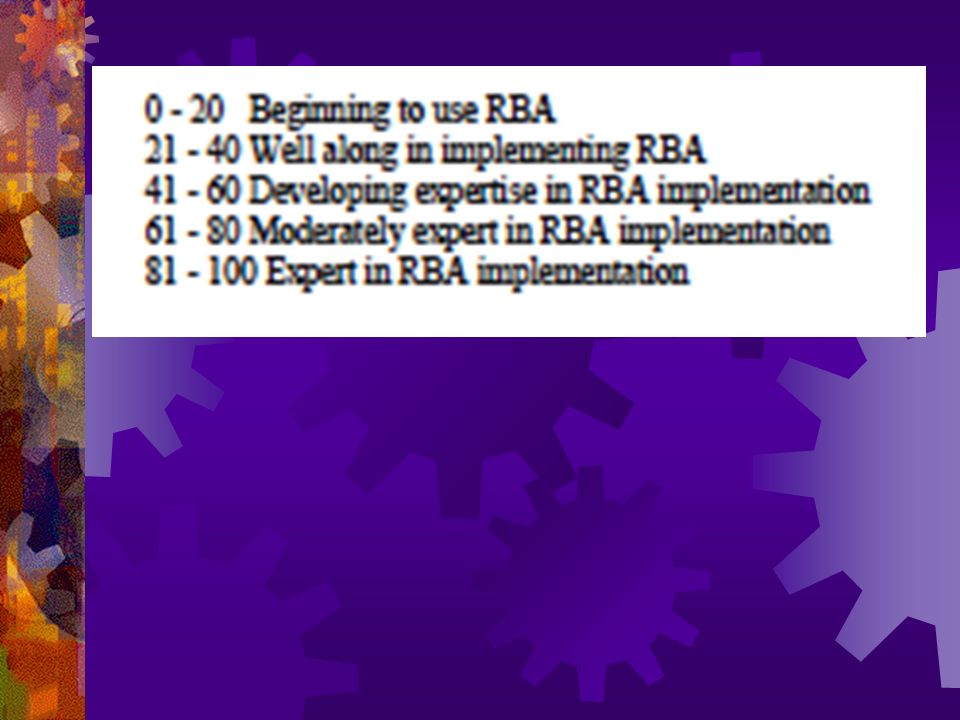
Self Assessment Questionnaire Write score anonymously on cards.

47
OPEN SPACE - Two lessons - One question

48
Resources Book - DVD Orders amazon.com resultsleadership.org www.raguide.org www.resultsaccountability.com RBA Facebook Group

49
Thank You!! Book - DVD Orders amazon.com resultsleadership.org www.raguide.org www.resultsaccountability.com RBA Facebook Group

51
"SOCIAL IMPACT" DISCUSSION

52
uiu

57
Contribution relationship Alignment of measures Appropriate responsibility THE LINKAGE Between POPULATION and PERFORMANCE POPULATION ACCOUNTABILITY Healthy Births Rate of low birth-weight babies Stable Families Rate of child abuse and neglect Children Ready for School Percent fully ready per K-entry assessment CUSTOMER RESULTS # of investigations completed % initiated within 24 hrs of report # repeat Abuse/Neglect % repeat Abuse/Neglect PERFORMANCE ACCOUNTABILITY POPULATION RESULTS Child Protective Services

58
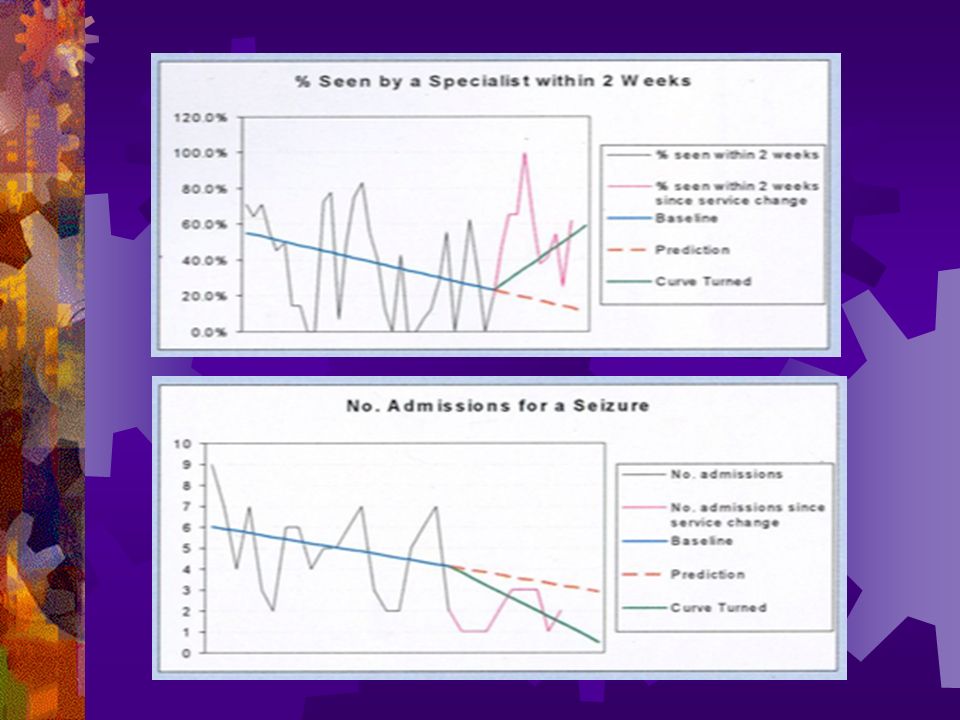
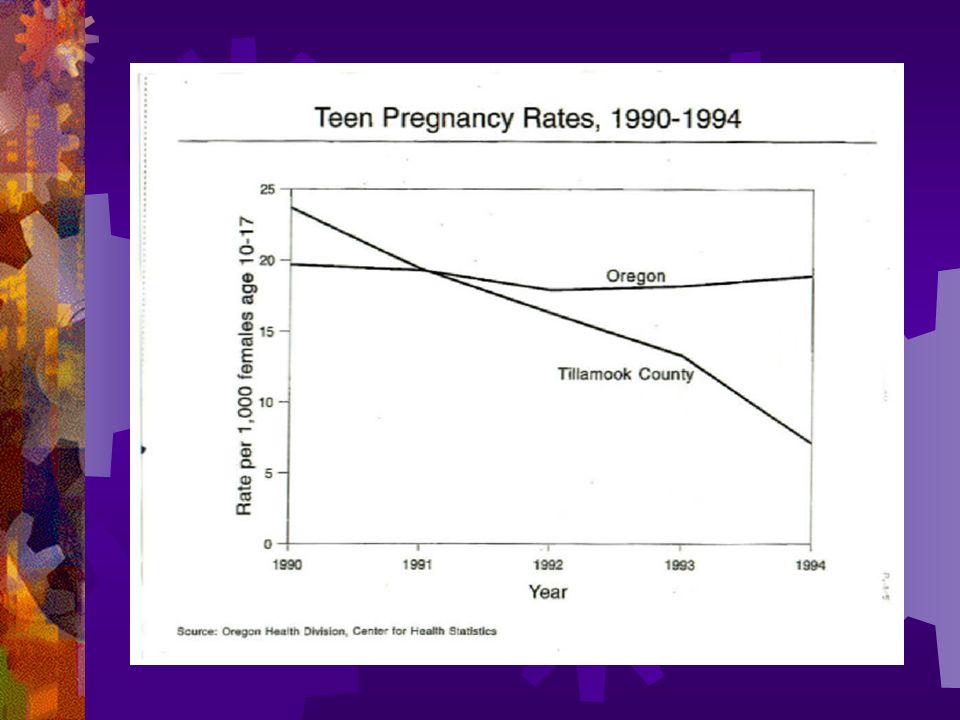
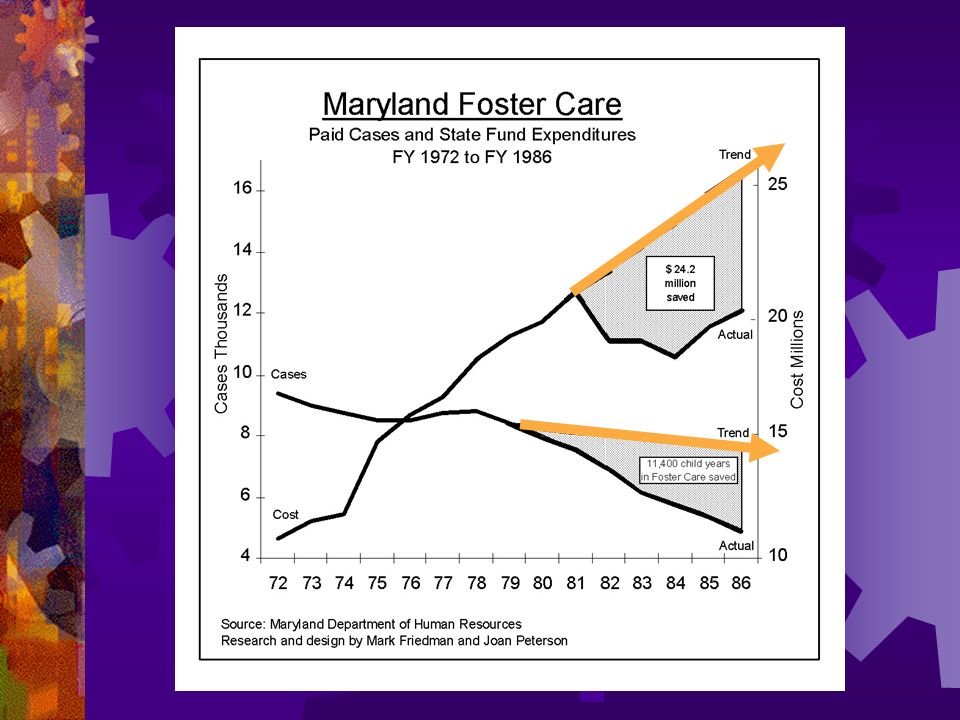
Alternative to Traditional Evaluation Methods: DEMONSTRATING the CONTRIBUTION of complex change efforts… requires 3 elements: A Curve to Turn 2 …and it had a timely relationship to…. 3 …. a turn in the curve. c FPSI 1 We tried a bunch of stuff that had a credible chance of making a difference … Bonus: a background trend stayed the same or got worse. 4

61
24.2 m 16.2 m ROI 1.49

62
“If you do what you always did, you will get what you always got.” Kenneth W. Jenkins President, Yonkers NY NAACP

63
- Dave Barry Never be afraid to try something new. Remember that a lone amateur built the Ark. A large group of professionals built the Titanic.

64
Thank You!! Book - DVD Orders amazon.com resultsleadership.org www.raguide.org www.resultsaccountability.com RBA Facebook Group

66
Turn the Curve Exercise: Program Performance 5 min:Starting Points - timekeeper and reporter - identify a program to work on - two hats (yours plus partner’s) 10 min:Performance measure baseline - choose 1 measure to work on – from the lower right quadrant - forecast (to 2018 ) – OK or not OK? 15 min:Story behind the baseline - causes/forces at work - information & research agenda part 1 - causes 15 min:What works? (What would it take?) - what could work to do better? - each partners contribution - no-cost / low-cost ideas - information & research agenda part 2 – what works 10 min:Report convert notes to one page Two pointers to action
 - what could work to do better. - each partners contribution - no-cost / low-cost ideas - information & research agenda part 2 – what works 10 min:Report convert notes to one page Two pointers to action.")
67
Program: _______________ Performance Measure (Lay definition) Performance Measure Baseline Story behind the baseline --------------------------- --------------------------- (List as many as needed) Partners --------------------------- --------------------------- (List as many as needed) Three Best Ideas – What Works 1. --------------------------- 2. --------------------------- 3. ---------No-cost / low-cost ONE PAGE Turn the Curve Report: Performance Sharp Edges 4. --------- Off the Wall

68
SOUTH AUSTRALIA Community Outcomes 1. Connecting & Engaging: People are included, connected, active members of their community and influence decisions that affect them. 2. Developing & Learning: People have the skills, knowledge and confidence needed to flourish. 3. Strengthening: People feel safe and have the capacity to respond to the challenges and opportunities of life. 4. Participating: People contribute to the economic prosperity of their community through paid work or volunteering. DCSI 6/10/2015

70
3 - kinds of performance measures. How much did we do? How well did we do it? Is anyone better off? RBA in a Nutshell 2 – 3 - 7 2 - kinds of accountability Population accountability Performance accountability 7 - questions from ends to means in less than an hour. plus language discipline Results & Indicators Performance measures Baselines & Turning the Curve

71
How much did we do? Service: __________________________________ How well did we do it? Is anyone better off? Primary customers # studentspatients persons trained Primary activity # hours of instruction diagnostic testsjob coursesalarms responded to If your service works really well, how are your customer's better off? # students who graduate patients who fully recover fires kept to room of origin % Unit cost Workload ratio % of ___x___ that happen on time persons who get jobs School HospitalJob Training Fire Department customers served

72
How to choose Performance Measures

73
How much did we do? Performance Accountability Types of Measures found in each Quadrant How well did we do it? Is anyone better off? # Clients/customers served # Activities (by type of activity) % Common measures e.g. client staff ratio, workload ratio, staff turnover rate, staff morale, % staff fully trained, % clients seen in their own language, worker safety, unit cost % Skills / Knowledge (e.g. parenting skills) # % Attitude / Opinion (e.g. toward drugs) # % Behavior (e.g.school attendance) # % Circumstance (e.g. working, in stable housing) # % Activity-specific measures e.g. % timely, % clients completing activity, % correct and complete, % meeting standard Point in Time vs. 2 Point Comparison # %
 % Common measures e.g. client staff ratio, workload ratio, staff turnover rate, staff morale, % staff fully trained, % clients seen in their own language, worker safety, unit cost % Skills / Knowledge (e.g. parenting skills) # % Attitude / Opinion (e.g. toward drugs) # % Behavior (e.g.school attendance) # % Circumstance (e.g. working, in stable housing) # % Activity-specific measures e.g. % timely, % clients completing activity, % correct and complete, % meeting standard Point in Time vs. 2 Point Comparison # %.")
74
How much did we do? Service: __________________________________ How well did we do it? Is anyone better off? Primary customers # studentspatients persons trained Primary activity # hours of instruction diagnostic testsjob coursesalarms responded to If your service works really well, how are your customer's better off? # students who graduate patients who fully recover fires kept to room of origin % Unit cost Workload ratio % of ___x___ that happen on time persons who get jobs School HospitalJob Training Fire Department

Similar presentations


 The Fiscal Policy Studies Institute Websites raguide.org resultsaccountability.com Books & DVDs amazon.com resultsleadership.org.>")


>")


 The Fiscal Policy Studies Institute Websites raguide.org resultsaccountability.com Book - DVD Orders amazon.com resultsleadership.org.>")

 Sue Richards Managing Director Results Leadership Group Australia.>")


 The Fiscal Policy Studies Institute www.raguide.org www.resultsaccountability.com Coreassets.com Book - DVD Orders amazon.com.>")


