Download presentation
Presentation is loading. Please wait.

1
Random Samples 12/5/2013

2
Readings Chapter 6 Foundations of Statistical Inference (Pollock) (pp 122-135)
 (pp )")
3
Final Exam SEC 1 – December 11 th (Wednesday) – 1:30 pm - 3:30 pm SEC 2 – December 10 th (Tuesday) – 1:30 pm - 3:30 pm
 – 1:30 pm - 3:30 pm SEC 2 – December 10 th (Tuesday) – 1:30 pm - 3:30 pm")
4
Final Paper Due 12/6/2013 by 11:59 AM- Doyle 226B Turnitin via Blackboard Copy by 11:59PM on 12/6

5
Reminders for the Paper Dataset information is in Chapter 1 and in the appendix (p. 2-4). GSS and NES also has information on line – World.sav - http://www.hks.harvard.edu/fs/pnorris/Data/Data.htm http://www.hks.harvard.edu/fs/pnorris/Data/Data.htm If running x-tabs don’t forget column %’s
. GSS and NES also has information on line – World.sav If running x-tabs don’t forget column %’s.")
6
OPPORTUNITIES TO DISCUSS COURSE CONTENT

7
Office Hours For the Week When – Friday 7-12 – No Office hours during final exam week – And by appointment

8
Course Learning Objectives 1.Students will learn the basics of polling and be able to analyze and explain polling and survey data. 2.Students will learn the basics of research design and be able to critically analyze the advantages and disadvantages of different types of design.

9
Sampling After we write the survey, we have to select people!

10
Rules on Sampling if cost dictates that a sample be drawn, a probability sample is usually preferable to a nonprobability sample. The Law of Large Numbers

11
Collecting a sample Population Sampling Frame The Sample itself

12
The best that we can hope for is that every unit in the sampling frame has an equal chance of being selected

13
The Law of Large Numbers Smaller samples cause greater error. The larger the sample size, the greater the probability that our sample will represent the population.

14
All probability samples yield estimates of the target population

15
Two Things that Deal With the Stars AstronomyAstrology

16
Polling is Science (Astronomy) Polls are right more than they are wrong We especially love them when it favors our candidates.
 Polls are right more than they are wrong We especially love them when it favors our candidates.")
18
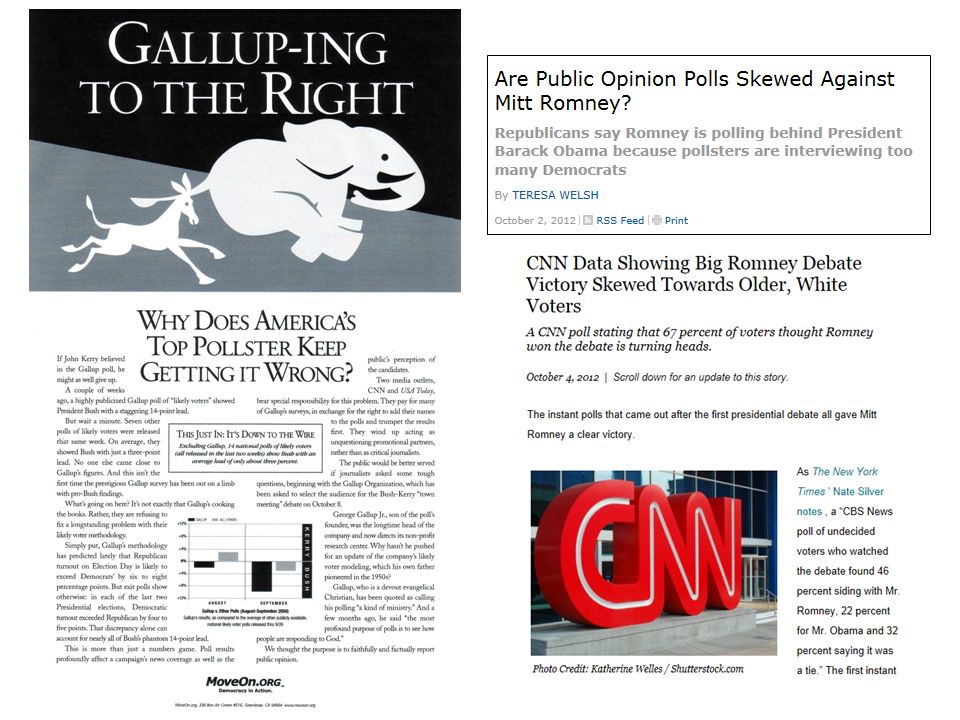
Polling is Random (Astrology) It is not an exact science, there is error in every poll. Polls Don’t Vote, People Vote We like it less when it doesn’t favor our candidate

20
Same Election, Different Results PollDateSampleMoE Obama (D) Romney (R) Spread Rasmussen Tracking 10/4 - 10/61500 LV34749Romney +2 Gallup Tracking 9/30 - 10/63050 RV24946Obama +3 CNN/Opinion Research 9/28 - 9/30783 LV3.55047Obama +3 National Journal 9/27 - 9/30789 LV4.247 Tie NBC News/WSJ 9/26 - 9/30832 LV3.44946Obama +3 NPR 9/26 - 9/30800 LV45144Obama +7 ABC News/Wash Post 9/26 - 9/29813 LV44947Obama +2
 Romney (R) Spread Rasmussen Tracking 10/4 - 10/61500 LV34749Romney +2 Gallup Tracking 9/ /63050 RV24946Obama +3 CNN/Opinion Research 9/28 - 9/30783 LV Obama +3 National Journal 9/27 - 9/30789 LV4.247 Tie NBC News/WSJ 9/26 - 9/30832 LV Obama +3 NPR 9/26 - 9/30800 LV45144Obama +7 ABC News/Wash Post 9/26 - 9/29813 LV44947Obama +2")
21
Different Questions Perhaps? If the election were held today, would you vote for Barack Obama or Mitt Romney? If the election were held today, would you vote for Mitt Romney or Barack Obama? If the election were held today, would you vote for Democrat Barack Obama or Republican Mitt Romney? If the election were held today, would you vote for Republican Mitt Romney or Democrat Barack Obama? If the election were held today, for whom would you vote?

22
More likely a different sample

23
SAMPLING ERROR Polling is 95% Science and 5% Astrology

24
The accuracy of estimates is expressed in terms of the margin or error and the confidence level

25
The Confidence Level The Confidence Level- can we trust these results? Surveys use a 95% confidence interval that the results will fall within the margin of error There is a 5% (1 out of 20) chance that the results will fall outside this range and produce wacky findings. This error often appears when you keep asking the same questions again and again
 chance that the results will fall outside this range and produce wacky findings. This error often appears when you keep asking the same questions again and again.")
26
The Margin of Error Margin of Error A floating range above and below the estimate. Large Samples= Less Error

27
Still too early PPP POLL Texas Tribune Poll

28
On these Polls PPP Abbott could be leading by as much as 54.4 to 30.6 The Race could be as close as 45.6-39.4 Texas Tribune Abbott could be leading by as much as 42.83 to 31.17 The Race could be as close as 37.17 to 36.83 for Abbott Races that fall within the margin of error we say “too close to call”.

29
What else determines sampling error Non-response rate Variability Bias

30
How Can a Survey of 1000 People Represent Millions of Voters? Responses Cancel each other out No New opinions are added

31
Its Logarithmic

32
PERSONAL INTERVIEWS Data Collection Method I

33
Cluster Sampling (How we conduct it) People Move, Houses Don’t Random Samples of known units Each unit in the cluster has a chance
 People Move, Houses Don’t Random Samples of known units Each unit in the cluster has a chance")
34
BLS

35
Personal Interviews Advantages Disadvantages

36
MAIL SURVEYS Method II

37
Collecting a Sample Every address is in our frame Often Used to target specific Groups Less popular for “hot topics”

38
About Mail Advantages Disadvantages

39
TELEPHONE SURVEYS How Most Surveys are Done Today

40
Telephone Surveys Every Phone Number has an equal Chance of Being Selected It is important that you select the right people

41
Advantages of Phone Fast CATI Closed Ended Questions

42
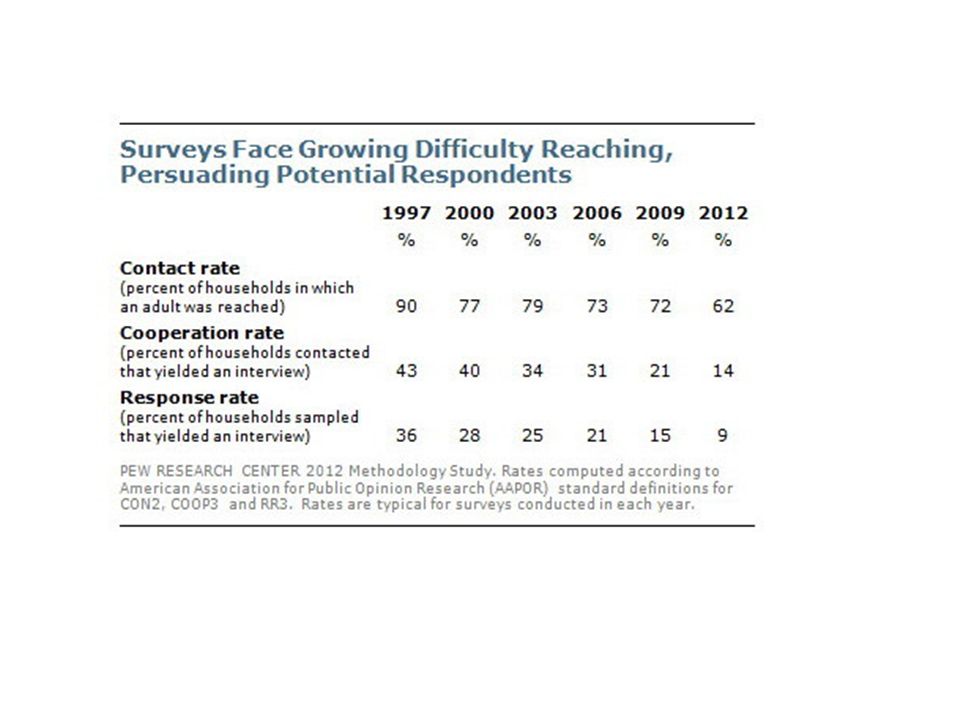
Why it is not a true random sample Some people do not have phones Some people simply will not answer (75% refusal rate)
")
43
Surveys miss out on Poll Sampling excludes many— minorities, young people, and new Americans Angry White Men

45
Who we often get

46
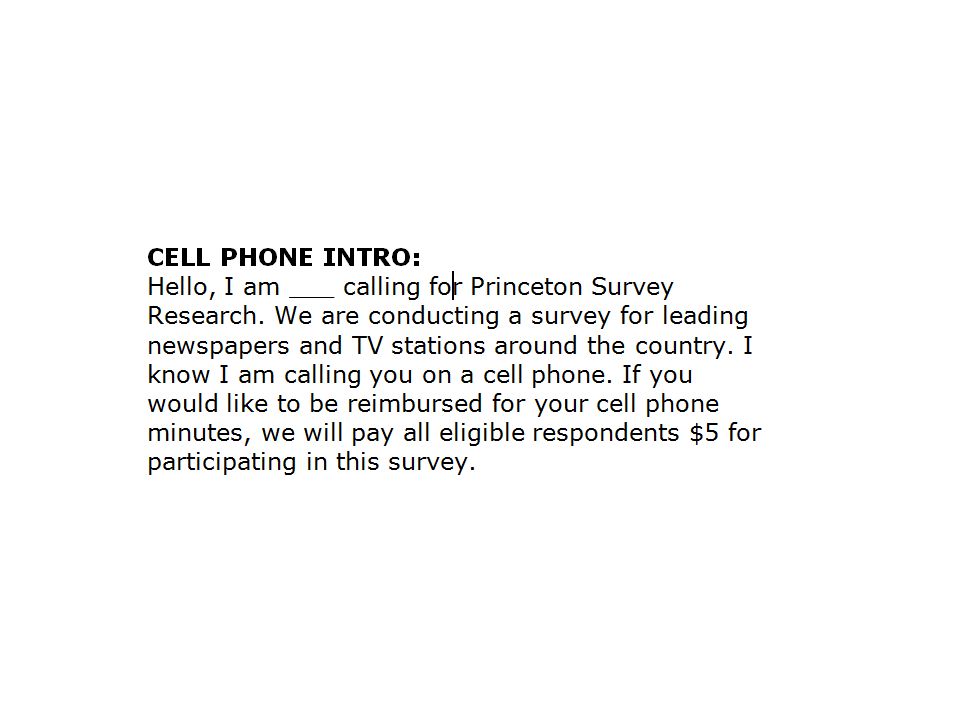
Problems of Cell Phones Some polls Exclude them You have to pay people to participate Some polls contact you and ask you to call back

48
Exit Polls Use a random selection of polling places Quick Recall and Fast Data Problems (early voting)
")
49
WE HAVE TO SURVEY A LOT MORE PEOPLE THAN WE USED TO This makes it less random

50
Not All Sampling Frames are Created Equal

53
Low Response rates and trying to get likely voters slow things down and drive up costs.

54
SO SHOULD WE FOLLOW THE POLLS?

55
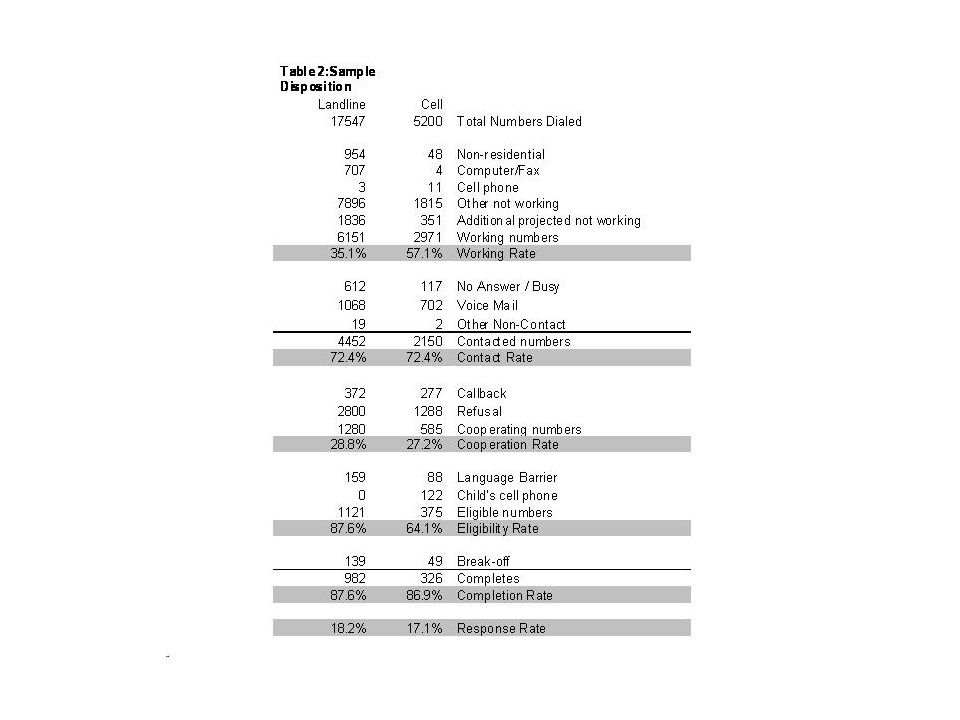
Verify all Polls Who Conducted it How many they sampled How they sampled Specific question wording

56
Always Check Who sponsored the poll How they got the sample How big was the sample Specific questions

Similar presentations


 (pp 199- 206) Chapter 6 Foundations of Statistical Inference.>")


 (pp.37-44) Chapter 6. Foundations of Statistical Inference (128-133)>")

 (pp.37-44) Chapter 6. Foundations of Statistical Inference.>")

 (pp. 58-76) Chapter 5.>")

