Download presentation
Presentation is loading. Please wait.

1
Outlook for Wisconsin and U.S. Dairy Markets FARM Team Agricultural Prices Conference Brian W. Gould Associate Professor Department of Agricultural and Applied Economics University of Wisconsin-Madison August 27, 2008

2
Presentation Outline Where have we been Dairy commodity prices Wisconsin Mailbox prices U.S. milk production Dairy product stocks Dairy industry outlook What do the futures markets tell us? Overview of most recent USDA dairy forecasts A brief overview of the Livestock Gross Margin Insurance Program for Dairy: A new risk management tool 2

3
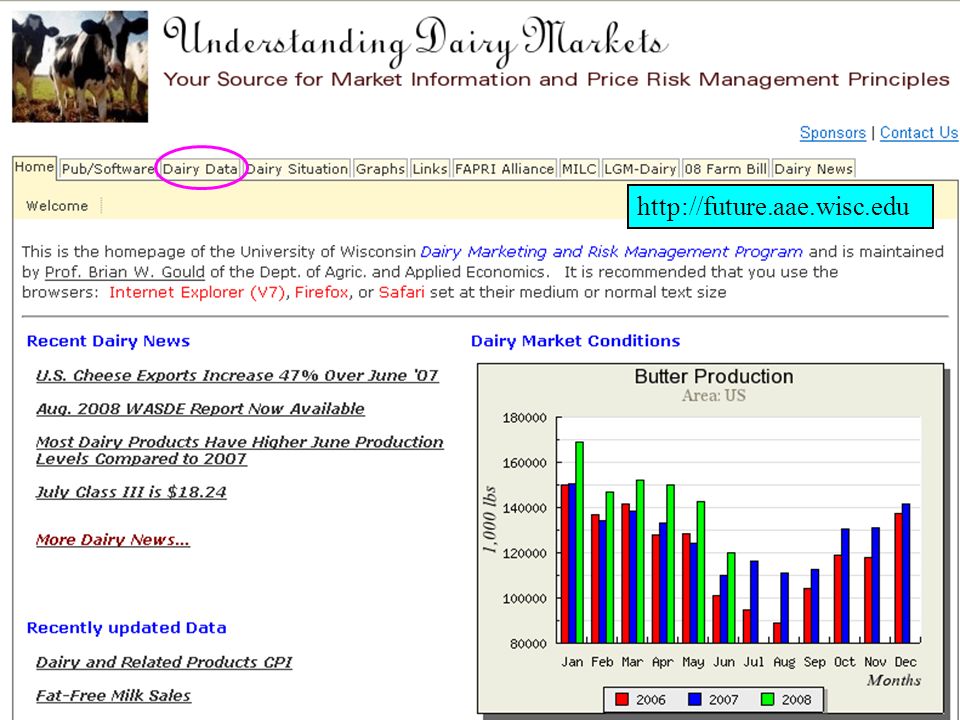
http://future.aae.wisc.edu
4
FMMO system: Plant sales prices of cheddar cheese, NFDM, butter and dry whey prices determine minimum milk component values Formulas/commodities used vary by milk class Class III milk component values based on cheddar cheese, butter and dry whey prices Wisconsin Mailbox prices closely tied to Class III price with difference due to: Over-order premiums paid by plant Milk quality Utilization of milk across the 4 FMMO milk classes Where Have We Been: Class III Price

5
5 Avg. Since 2002 Cheddar: $1.480 Butter: $1.356 Dry Whey: $0.299 $/lb Cheddar & Butter $/lb Dry Whey Source: USDA, NASS Where Have We Been: NASS Market Prices

6
Mailbox price does not include MILC payments Source: USDA, AMS, Dairy Division July $10.61 July $11.70 Dec $21.92 Where Have We Been: Wisconsin Mailbox Predicted $/cwt

7
Level of milk production has direct influence on milk price Milk needs to go somewhere If growth rate exceeds increase in demand → downward pressure on price The U.S. dairy farmer has provided evidence of an incredible ability to increase output Until recently we have observed a pattern of year-over-year decreases in U.S. herd size Dramatic increases in per cow productivity Where Have We Been: U.S. Milk Production

8
Source: USDA, NASS July '08: 57 lbs over ′04-′07 average, a 3.56% ↑ Where Have We Been: U.S. Milk Production

9
Source: USDA, NASS Continual ↑ in herd size since April ′07 Jan. ′04 Where Have We Been: U.S. Milk Production July '08: 128,000 more cows than July '07 (1.40% ↑)
.")
10
Source: USDA, NASS Where Have We Been: U.S. Milk Production % Change

11
As noted above, Class III prices determined by Cheddar, Dry Whey and Butter prices Supply of products can come from immediate production or from stocks Growth in stocks would place downward pressure on commodity prices Where Have We Been: Dairy Product Stocks

12
Source: USDA, NASS June '08 value a 1.0% ↓ of '04-'07 average Where Have We Been: Dairy Product Stocks July '08 value a 13.5% ↑ over '04-'07 average

13
Source: USDA, NASS June '07 value a 40.2% ↑ of '04-'07 average Where Have We Been: Dairy Product Stocks

14
Since the mid-1990’s we have had a viable futures market for dairy products We can use these markets to give us some idea as to possible future conditions Based on that day’s market opinion As examples lets look at Class III and Dry Whey Use cash price history to determine what is a good price Dairy Industry Outlook: Futures Markets

15
Derivation of a “Good” Class III Price 33% probability Class III Top 3 rd Class III Bottom 3 rd Average Class III Monthly Class III Price Distribution (Assumed Normally Distributed)
")
16
Dairy Industry Outlook: Futures Markets Data as of August 22 nd

17
Projected Wisconsin Mailbox: Lots of Uncertainty

18
Dairy Industry Outlook: Futures Markets Data as of Aug. 22 nd Western Dry Whey Used for Cash Data

19
USDA Quarterly Forecasts (WASDE, Aug. 12 th ) Milk Production (Bil. lbs, % over previous year) 2008 III46.7 (1.30%) 2008 III46.7 (1.30%) 2008 IV46.5 (1.09%) 2008 IV46.5 (1.09%) Annual189.5 (2.10%) Annual189.5 (2.10%) 2009 I47.6 (0.02%) 2009 I47.6 (0.02%) 2009 II48.9 (0.04%) 2009 II48.9 (0.04%) U.S. All Milk Price ($/cwt, % over previous year) 2008 III$18.90 2008 III$18.90 (-12.8%) 2008 IV$19.05 2008 IV$19.05 (-11.8%) Annual$18.95 Annual$18.95 (-0.94%) 2009 I$18.75 2009 I$18.75 (-2.50%) 2009 II$18.40 2009 II$18.40 (-0.92%) Outlook for the Dairy Industry
 2008 III46.7 (1.30%) 2008 III46.7 (1.30%) 2008 IV46.5 (1.09%) 2008 IV46.5 (1.09%) Annual189.5 (2.10%) Annual189.5 (2.10%) 2009 I47.6 (0.02%) 2009 I47.6 (0.02%) 2009 II48.9 (0.04%) 2009 II48.9 (0.04%) U.S. All Milk Price ($/cwt, % over previous year) 2008 III$ III$18.90 (-12.8%) 2008 IV$ IV$19.05 (-11.8%) Annual$18.95 Annual$18.95 (-0.94%) 2009 I$ I$18.75 (-2.50%) 2009 II$ II$18.40 (-0.92%) Outlook for the Dairy Industry.")
20
USDA forecasts of NASS and FMMO prices (WASDE, Aug. 12 th ) vs. historical values Outlook for the Dairy Industry 2006200720082009 $/lb Cheese1.2471.7381.9301.905 Butter1.2191.3441.4351.420 Whey0.3290.6000.2800.315 NFDM0.8931.7081.3951.520 $/cwt Class III 11.8918.0417.9517.60 Class IV 11.0618.3616.1016.95
 vs. historical values Outlook for the Dairy Industry $/lb Cheese Butter Whey NFDM $/cwt Class III Class IV")
21
How can producers attempt to control milk price risk? Enter into forward contract with processing plants Private firms are now allowed to offer forward contracts under 2008 Farm Bill Private firms are now allowed to offer forward contracts under 2008 Farm Bill Farm Bill Website: Farm Bill Website: http://future.aae.wisc.edu/farm_bill.html http://future.aae.wisc.edu/farm_bill.html Use minimum price contracts with processing plants Similar to individual use of a put Similar to individual use of a put Use traditional hedging and options strategies if large enough to cover contract sizes Futures and options tutorials available: http://future.aae.wisc.edu/tutor http://future.aae.wisc.edu/tutor Managing the Opportunities

22
August 2008: A new risk management instrument: Livestock Gross Margin Insurance for Dairy (LGM-Dairy) Protects against unanticipated declines in Gross Margins Gross margin = milk revenue – feed costs Gross margin = milk revenue – feed costs Available to dairy farm operations in 32 states Available to dairy farm operations in 32 states Managing the Opportunities
 Protects against unanticipated declines in Gross Margins Gross margin = milk revenue – feed costs Gross margin = milk revenue – feed costs Available to dairy farm operations in 32 states Available to dairy farm operations in 32 states Managing the Opportunities")
23
LGM-Dairy analogous to combined use of: Put options to account for milk price downside risk Call options to control for feed cost upside risk In contrast to futures and options, LGM-Dairy available to any size operation up to 240,000 cwt over 10 months LGM-Dairy is customizable Months insured Percent of monthly Gross Margins covered Flexible Gross Margin deductible available $0 - $1.50/cwt allowable deductible range $0 - $1.50/cwt allowable deductible range Managing the Opportunities

24
At the UW we have undertaken a project to develop educational materials/decision tools centered on LGM- Dairy We will be conducting half-day workshops tentatively planned for early 2009 Have developed a website devoted to LGM-Dairy: http://future.aae.wisc.edu/lgm_dairy.html http://future.aae.wisc.edu/lgm_dairy.html Have written a briefing paper explaining LGM-Dairy: USDA’s Gross Margin Insurance Program for Dairy: What is it and Can it be Used for Risk Management, B. Gould, P. Mitchell and V. Cabrera Available via LGM-Dairy Website Available via LGM-Dairy Website Managing the Opportunities

25
Contact Information Univ. of Wisconsin Dairy Marketing Website: http://future.aae.wisc.edu Brian W. Gould (608)263-3212bwgould@wisc.edu

Similar presentations


 257-2996>")
