Download presentation
Presentation is loading. Please wait.

1
On lab reports and other details January 20, 2011 Kevin Stenson

2
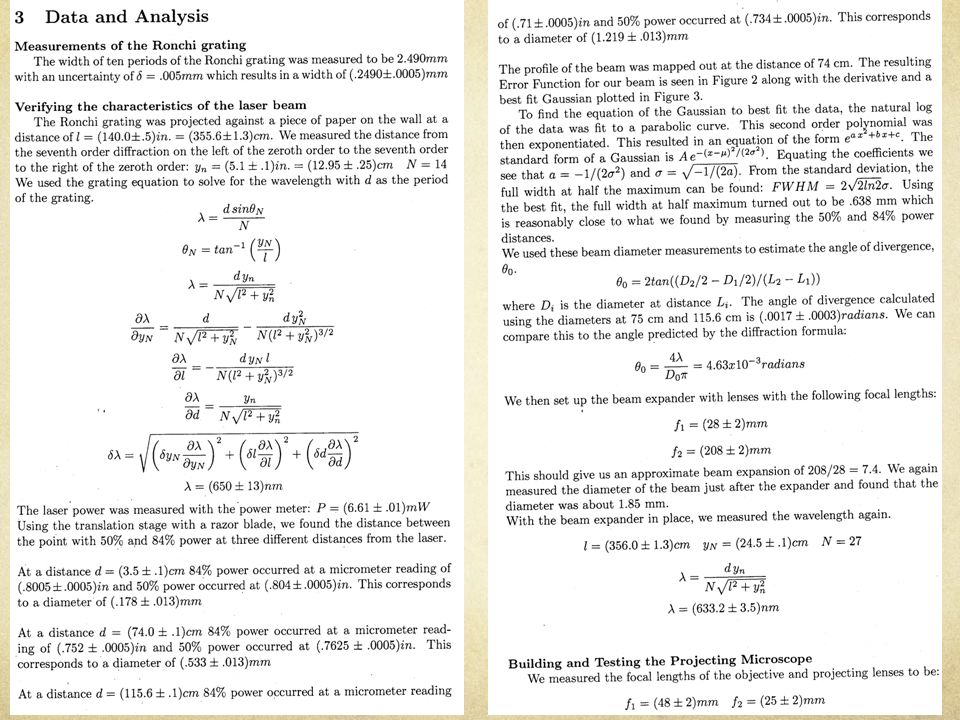
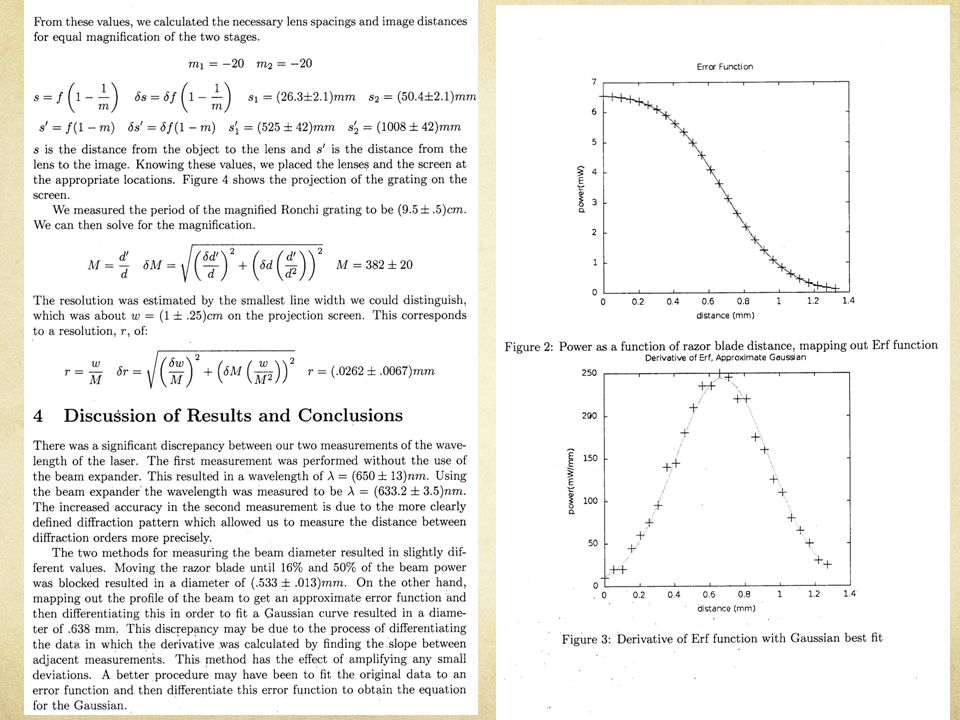
An example of a good report

5
Comments on Lab Reports Uncertainties on values like Ronchi grating spacing, measurement of power, focal lengths, microscope lengths. Correct propagation of uncertainties when finding Ronchi spacing, wavelength, power, beam size. Graphs of power versus razor blade position. Clear explanations of setup and measurements with photos and diagrams. Here are some items I was very happy to see: However, not all lab reports had this so I will try to review some of this for you. You should also review error analysis and propagation on your own (e.g. in Taylor or Bevington). Particle Detectors 5 1/20/11
. Particle Detectors 5 1/20/11.")
6
Error propagation You are calculating q which is a function of x, …,z, each of which have an uncertainty x, …, z. What is the uncertainty on q? You take two measurement microscope readings 2.019±0.002 mm and 4.515±0.002 mm and subtract them to get D so D = d 2 −d 1. For addition & subtraction, absolute uncertainties add in quadrature So D = (4.515−2.019) ± √2 ⋅ 0.002 mm = 2.496 ± 0.003 mm Particle Detectors 6 1/20/11
 ± √2 ⋅ mm = ± mm Particle Detectors 6 1/20/11.")
7
Error propagation You found the power from: where O is output voltage, ε is spectral responsivity and G is transimpedence gain. Working through the derivatives you find it can be written as: For multiplication & division, relative uncertainties add in quadrature. To find the Ronchi grating spacing we could measure one period and find something like d = 0.250 ± 0.003 mm. Or take the measurement of 10 periods (D = 2.496 ± 0.003 mm) and divide by 10 so d = D/10. What is the uncertainty? There is no uncertainty on 10 so This gives us d = 0.2496 ± 0.0003 mm (10 times better uncertainty) Particle Detectors 7 1/20/11
 and divide by 10 so d = D/10. What is the uncertainty. There is no uncertainty on 10 so This gives us d = ± mm (10 times better uncertainty) Particle Detectors 7 1/20/11.")
8
Measurements and uncertainty If I take 150 measurements of a length what can I learn? 1. The mean is the most likely value for the true length: 2. The standard deviation (σ) is the best estimate for the uncertainty on each measurement: 3. The uncertainty on the mean is Histograming the measurements reveals a Gaussian distribution with width σ equal to the standard deviation (or r.m.s.) as N→∞. The standard deviation (or σ from a Gaussian) measures the resolution. Particle Detectors 8 1/20/11
 is the best estimate for the uncertainty on each measurement: 3. The uncertainty on the mean is Histograming the measurements reveals a Gaussian distribution with width σ equal to the standard deviation (or r.m.s.) as N→∞. The standard deviation (or σ from a Gaussian) measures the resolution. Particle Detectors 8 1/20/11.")
9
Start from and using the small angle approximation: gives where L is the distance to the screen, y n is the distance to fringe number n, and d is the grating spacing. Getting the uncertainty on wavelength Some students calculated λ for each fringe and used the standard deviation to get the uncertainty. Is this sufficient? Not quite. This does not include the uncertainty on d and L. One could measure the quantity y n /n for each fringe, take the average and use the standard deviation as the uncertainty. So then one would have three quantities: d, L, and y n /n, each with a value and uncertainty which can be used to calculate λ (including uncertainty). One could also take one measurement for the largest n and estimate the uncertainty on y n. Particle Detectors 9 1/20/11
. One could also take one measurement for the largest n and estimate the uncertainty on y n. Particle Detectors 9 1/20/11.")
10
Other comments on reports If you are using measurements to calculate something, you usually need to include the actual measurements. Often if you are taking lots of measurements it is better to show them in graphical form rather than in a huge table. The lab report should be self contained. It is not sufficient to just give the answers to the questions in the lab manual. You need to describe what you did, why you did it, the results you got, and what they mean. You should also compare with the known results when available. There should be discussion in the conclusion about what went right and wrong, how things could be measured better, what you learned performing the experiment, and what your results tell you about physics. Particle Detectors 10 1/20/11

11
Other reminders By the end of each week you need to fill out the online survey and fill in a 3x5 note card. These are requirements and if you don’t do them, you will lose points. Surveys are available in the “Course Feedback” link on the main web page Those of you doing 1 week labs (Fraunhofer & Fourier) will be giving a talk on Tuesday. Should be no more than 10 minutes Should include the description of the physics, description of the experiment, and your results. You can see an example at the bottom of the “Report Format” link on the main web page. Slides from lectures are available in the “Lecture Schedule” link on the main web page. http://www.colorado.edu/physics/phys3340/ Particle Detectors 11 1/20/11
 will be giving a talk on Tuesday. Should be no more than 10 minutes Should include the description of the physics, description of the experiment, and your results. You can see an example at the bottom of the Report Format link on the main web page. Slides from lectures are available in the Lecture Schedule link on the main web page. Particle Detectors 11 1/20/11.")
Similar presentations


 (Presentation should not exceed 10 minutes.>")


 Almost no scientific quantities are known exactly –there is almost always some degree of uncertainty.>")


 Reminder: You should be doing this homework without using a calculator, because calculators can’t.>")
