Download presentation
Presentation is loading. Please wait.

3
https://www.youtube.com/watch?v=Uat UDnFmNTYhttps://www.youtube.com/watch?v=Uat UDnFmNTY https://www.youtube.com/watch?v=x1S gmFa0r04https://www.youtube.com/watch?v=x1S gmFa0r04

9
IPCC

10
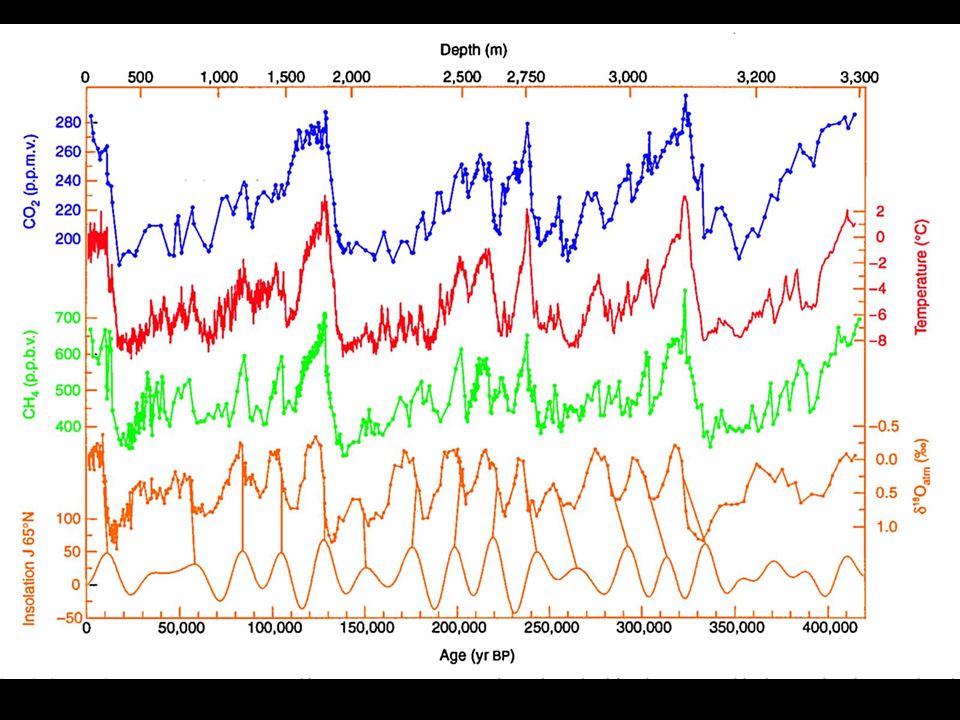
Sources: Petit et al (1999) Nature 399:429- 436 and IPCC(2000) Today 400 ppm CO 2 2 ppm CH 4 Atmospheric CO 2 has increased rapidly to levels above anything in Earth’s recent past 2100?
 Nature 399: and IPCC(2000) Today 400 ppm CO 2 2 ppm CH 4 Atmospheric CO 2 has increased rapidly to levels above anything in Earth’s recent past 2100")
13
IPCC

14
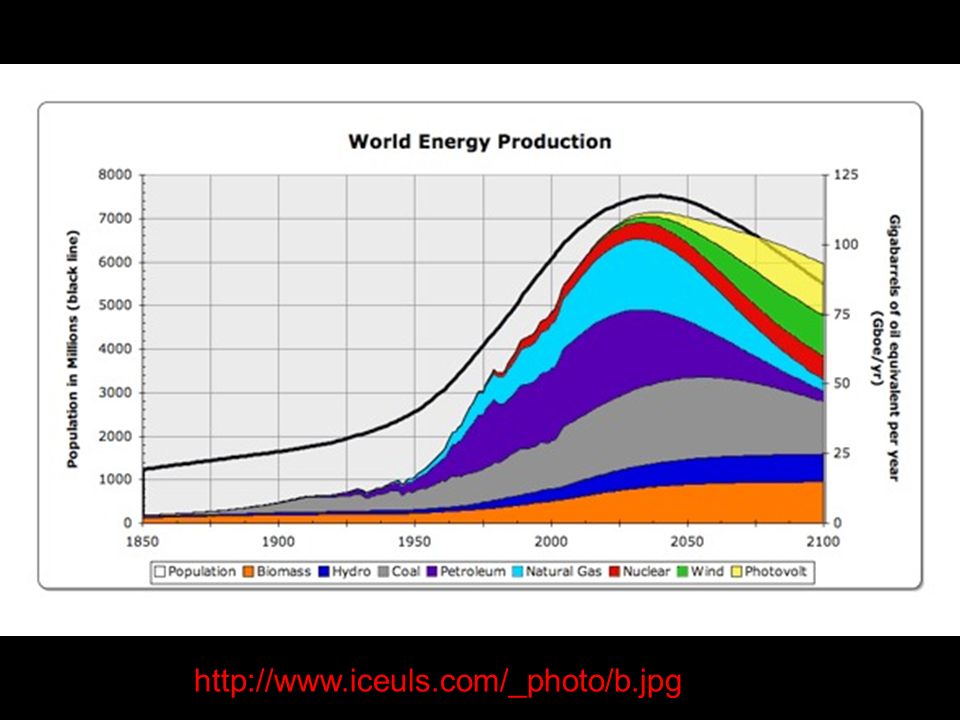
http://www.iceuls.com/_photo/b.jpg
15
Fossil Fuel and Cement Emissions Global fossil fuel and cement emissions: 36.1 ± 1.8 GtCO 2 in 2013, 61% over 1990 Projection for 2014 : 37.0 ± 1.9 GtCO 2, 65% over 1990 Estimates for 2011, 2012, and 2013 are preliminary Source: CDIAC; Le Quéré et al 2014; Global Carbon Budget 2014CDIACLe Quéré et al 2014Global Carbon Budget 2014 Uncertainty is ±5% for one standard deviation (IPCC “likely” range)
")
17
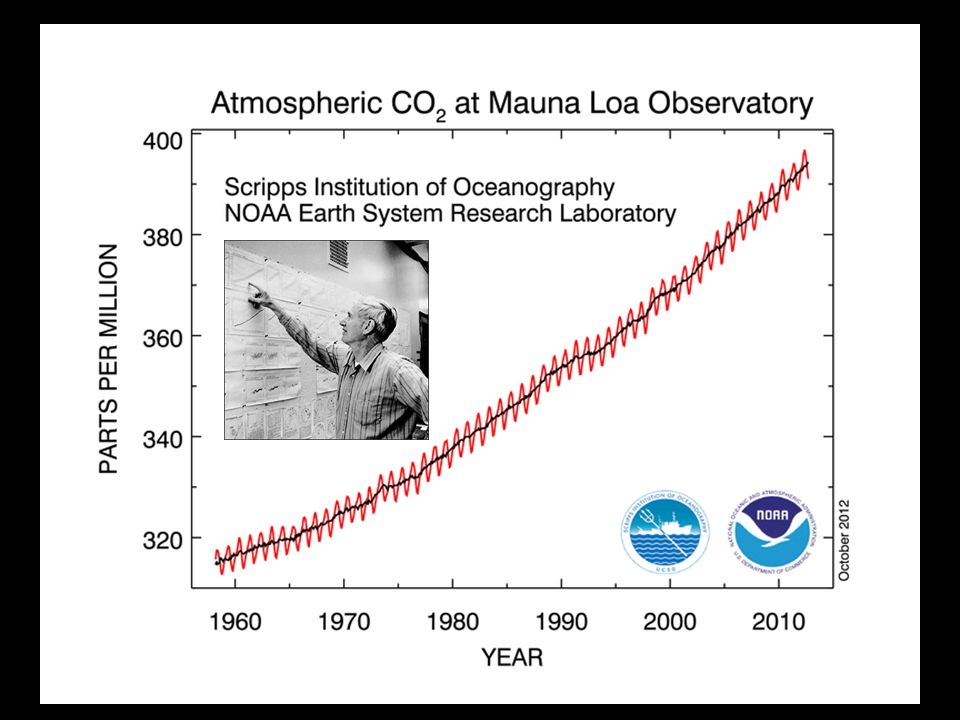
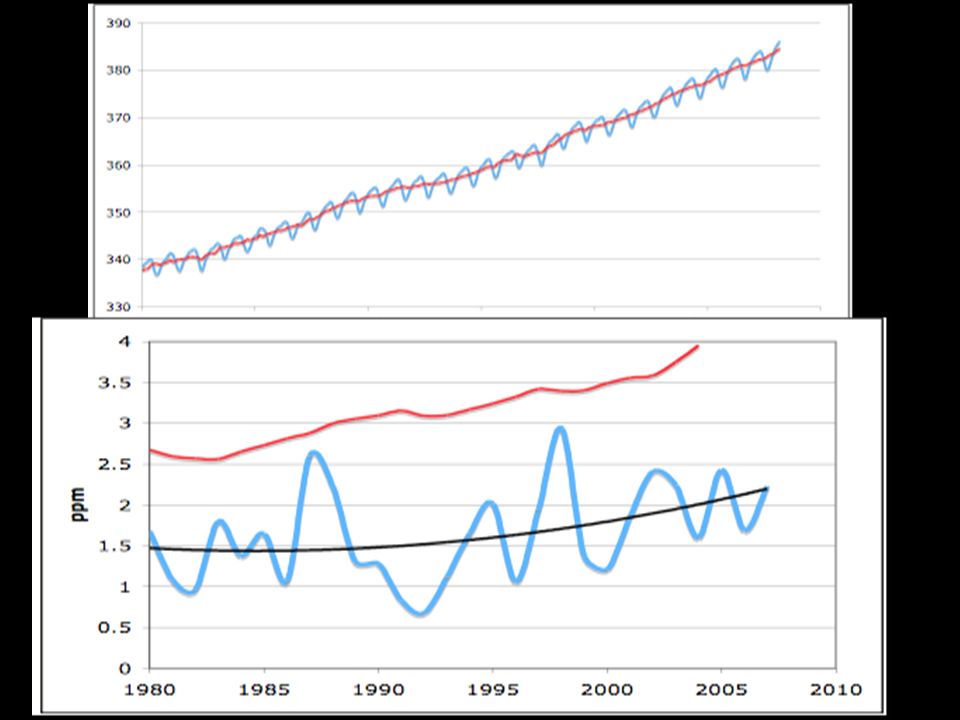
Atmospheric Concentration The global CO 2 concentration increased from ~277ppm in 1750 to 395ppm in 2013 (up 43%) Mauna Loa registered the first daily measurements above 400pm in May 2013 Globally averaged surface atmospheric CO 2 concentration Data from: NOAA-ESRL after 1980; the Scripps Institution of Oceanography before 1980 (harmonised to recent data by adding 0.542ppm) Source: NOAA-ESRL; Scripps Institution of Oceanography; Global Carbon Budget 2014NOAA-ESRLScripps Institution of OceanographyGlobal Carbon Budget 2014
 Mauna Loa registered the first daily measurements above 400pm in May 2013 Globally averaged surface atmospheric CO 2 concentration Data from: NOAA-ESRL after 1980; the Scripps Institution of Oceanography before 1980 (harmonised to recent data by adding 0.542ppm) Source: NOAA-ESRL; Scripps Institution of Oceanography; Global Carbon Budget 2014NOAA-ESRLScripps Institution of OceanographyGlobal Carbon Budget 2014")
19
Where Is The Carbon Going? Houghton et al. (2007) Ecosystem Carbon Sink
 Ecosystem Carbon Sink")
20
Global Carbon Budget The cumulative contributions to the Global Carbon Budget from 1870 Contributions are shown in parts per million (ppm) Figure concept from Shrink That Footprint Source: CDIAC; NOAA-ESRL; Houghton et al 2012; Giglio et al 2013; Joos et al 2013; Khatiwala et al 2013; Le Quéré et al 2014; Global Carbon Budget 2014Shrink That FootprintCDIACNOAA-ESRLHoughton et al 2012Giglio et al 2013Joos et al 2013Khatiwala et al 2013 Le Quéré et al 2014Global Carbon Budget 2014
 Figure concept from Shrink That Footprint Source: CDIAC; NOAA-ESRL; Houghton et al 2012; Giglio et al 2013; Joos et al 2013; Khatiwala et al 2013; Le Quéré et al 2014; Global Carbon Budget 2014Shrink That FootprintCDIACNOAA-ESRLHoughton et al 2012Giglio et al 2013Joos et al 2013Khatiwala et al 2013 Le Quéré et al 2014Global Carbon Budget 2014")
21
Global Carbon Budget Emissions are partitioned between the atmosphere, land, and ocean Source: CDIAC; NOAA-ESRL; Houghton et al 2012; Giglio et al 2013; Joos et al 2013; Khatiwala et al 2013; Le Quéré et al 2014; Global Carbon Budget 2014CDIACNOAA-ESRLHoughton et al 2012Giglio et al 2013Joos et al 2013Khatiwala et al 2013 Le Quéré et al 2014Global Carbon Budget 2014

22
Changes in the Budget over Time The sinks have continued to grow with increasing emissions, but climate change will affect carbon cycle processes in a way that will exacerbate the increase of CO 2 in the atmosphere Source: CDIAC; NOAA-ESRL; Houghton et al 2012; Giglio et al 2013; Le Quéré et al 2014; Global Carbon Budget 2014CDIACNOAA-ESRLHoughton et al 2012Giglio et al 2013Le Quéré et al 2014Global Carbon Budget 2014 Data: GCP

24
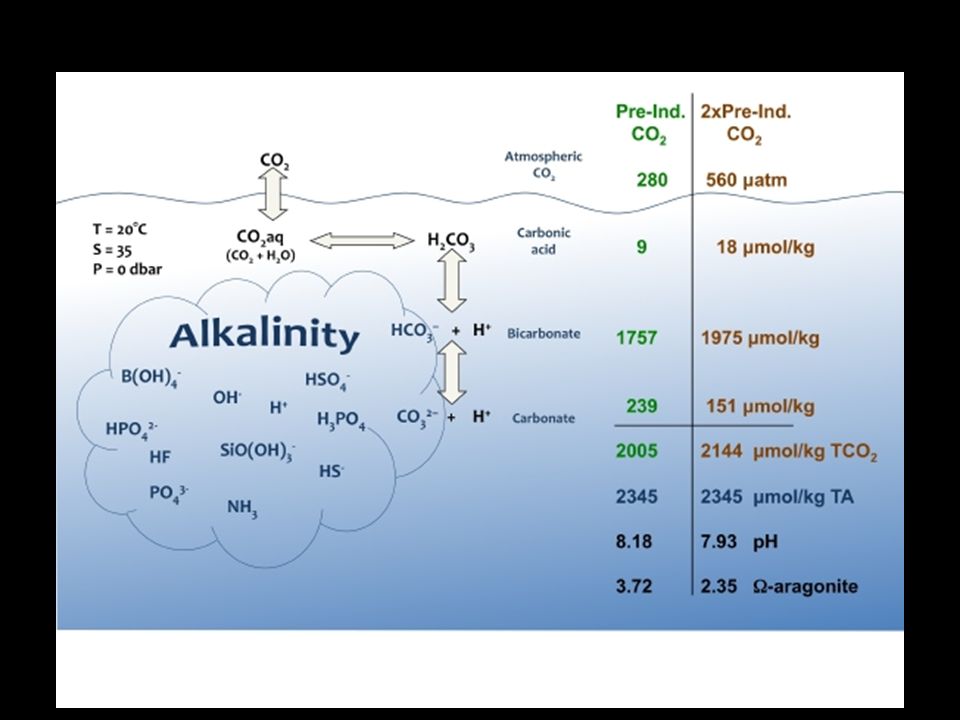
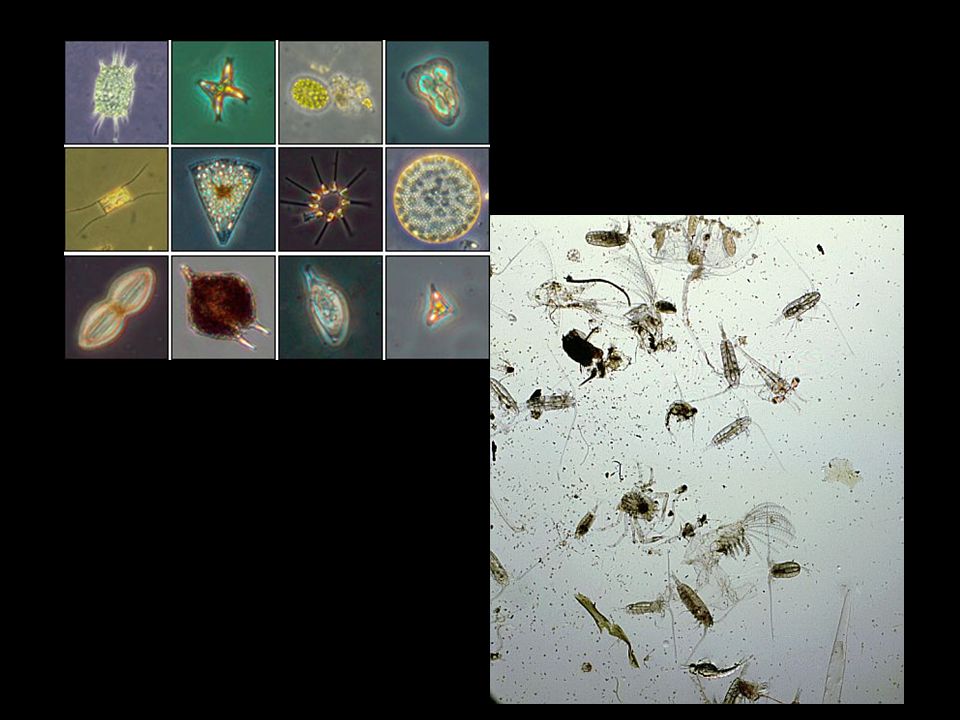
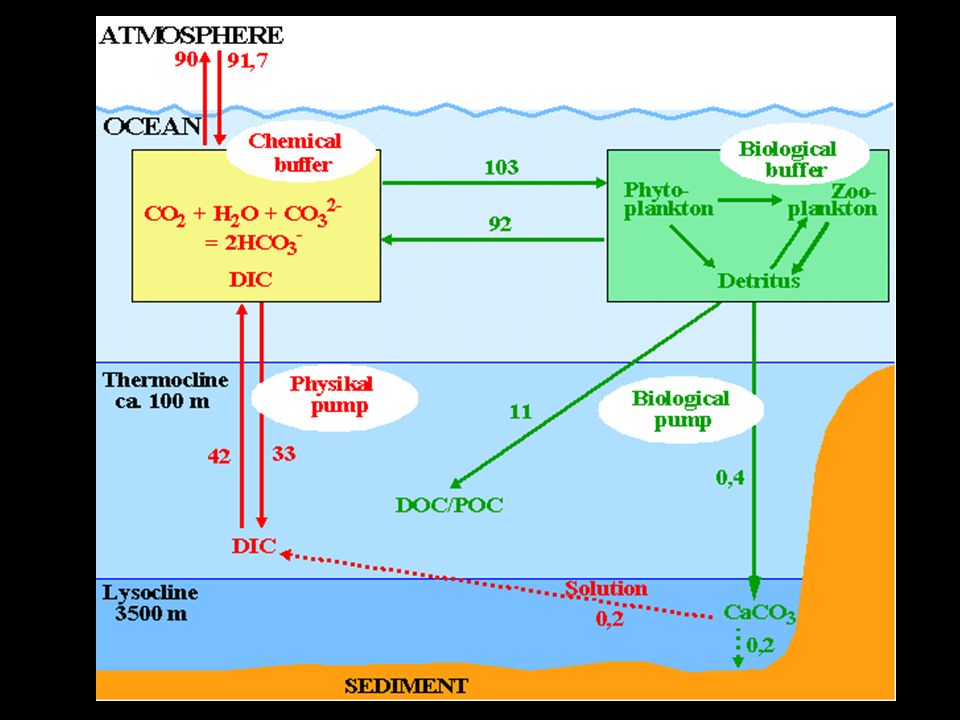
The Great Ocean Pump –Physical pump (air-sea exchange) pCO2_atmosphere, pCO2_water, [CO2] –Chemical pump (inorganic CO2 chemistry) DIC, Alkalinity, and pH –Biological pump (photosynthesis and decomposition) DOC/DOM, DOC/POC
![The Great Ocean Pump –Physical pump (air-sea exchange) pCO2_atmosphere, pCO2_water, [CO2] –Chemical pump (inorganic CO2 chemistry) DIC, Alkalinity, and pH –Biological pump (photosynthesis and decomposition) DOC/DOM, DOC/POC](http://images.slideplayer.com/26/8575786/slides/slide_24.jpg "The Great Ocean Pump –Physical pump (air-sea exchange) pCO2_atmosphere, pCO2_water, [CO2] –Chemical pump (inorganic CO2 chemistry) DIC, Alkalinity, and pH –Biological pump (photosynthesis and decomposition) DOC/DOM, DOC/POC")
25
Air-Sea Exchange

28
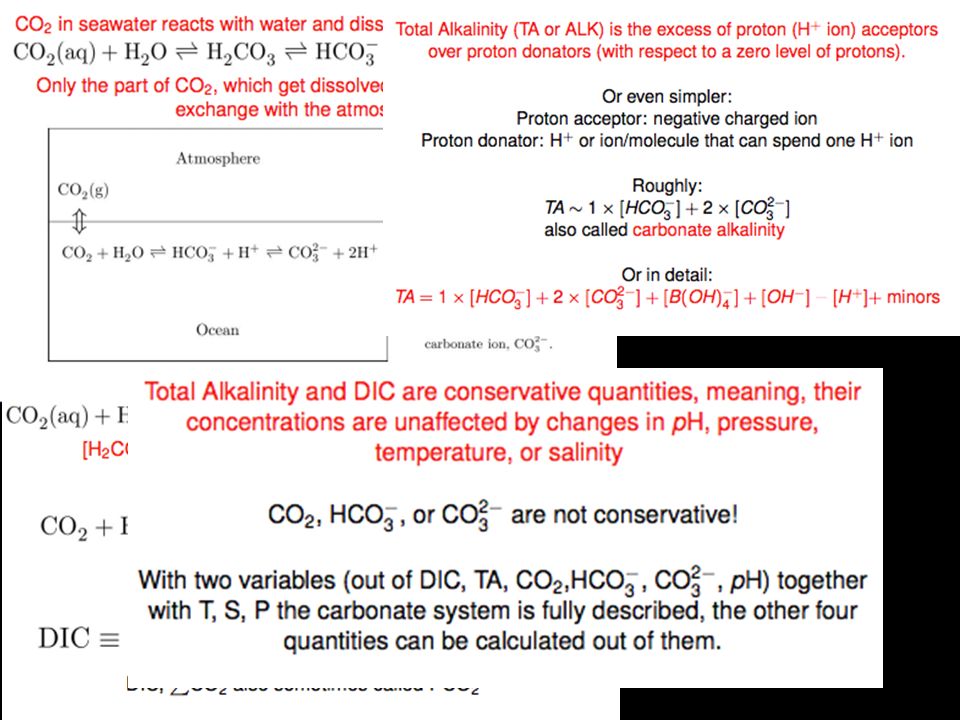
http://www.awi.de/fileadmin/user_upload/Research/Research_Di visions/Geosciences/Glaciology/download_lecture_global_carbo n_cycle/pk1011_cc_05_dic.pdf Revelle factor = (Δ[CO2] / [CO2]) / (Δ[DIC] / [DIC])
![visions/Geosciences/Glaciology/download_lecture_global_carbo n_cycle/pk1011_cc_05_dic.pdf Revelle factor = (Δ[CO2] / [CO2]) / (Δ[DIC] / [DIC])](http://images.slideplayer.com/26/8575786/slides/slide_28.jpg "visions/Geosciences/Glaciology/download_lecture_global_carbo n_cycle/pk1011_cc_05_dic.pdf Revelle factor = (Δ[CO2] / [CO2]) / (Δ[DIC] / [DIC])")
30
Ocean Carbon Cycle

33
Ocean Sink Ocean carbon sink continues to increase 9.4±1.8 GtCO 2 /yr for 2004–2013 and 10.5±1.8 GtCO 2 /yr in 2013 Source: Le Quéré et al 2014; Global Carbon Project 2014Le Quéré et al 2014Global Carbon Project 2014 Individual estimates from Buitenhuis et al. (2010); Aumont and Bopp (2006); Doney et al. (2009); Assmann et al. (2010); Ilyiana et al. (2013); Sérérian et al. (2013); Oke et al. (2013); Landschützer et al. (2014); Park et al. (2010); Rödenbeck et al. (2014). References provided in Le Quéré et al. (2014). Data: GCP this carbon budget individual ocean models data products
; Aumont and Bopp (2006); Doney et al. (2009); Assmann et al. (2010); Ilyiana et al. (2013); Sérérian et al. (2013); Oke et al. (2013); Landschützer et al. (2014); Park et al. (2010); Rödenbeck et al. (2014). References provided in Le Quéré et al. (2014). Data: GCP this carbon budget individual ocean models data products.")
38
Nemani, 2003, Science

39
Trends in NPP from Satellite

41
Desai et al., 2006

42
Terrestrial Sink The residual land sink is increasing with time to 9.2±1.8 GtCO 2 /yr in 2013, with large variability Total CO 2 fluxes on land (including land-use change) are constrained by atmospheric inversions Source: Le Quéré et al 2014; Global Carbon Project 2014Le Quéré et al 2014Global Carbon Project 2014 Individual estimates from Zhang et al. (2013); Oleson et al. (2013); Jain et al. (2013); Clarke et al. (2011); Smith et al. (2001); Sitch et al. (2003); Stocker et al. (2013); Krinner et al. (2005); Zeng et al. (2005); Kato et al. (2013); Peters et al. (2010); Rodenbeck et al. (2003); Chevallier et al. (2005). References provided in Le Quéré et al. (2014). Data: GCP this carbon budget individual land models atmospheric inversions (colours) this carbon budget individual land models fire-based estimate this carbon budget individual land models
; Oleson et al. (2013); Jain et al. (2013); Clarke et al. (2011); Smith et al. (2001); Sitch et al. (2003); Stocker et al. (2013); Krinner et al. (2005); Zeng et al. (2005); Kato et al. (2013); Peters et al. (2010); Rodenbeck et al. (2003); Chevallier et al. (2005). References provided in Le Quéré et al. (2014). Data: GCP this carbon budget individual land models atmospheric inversions (colours) this carbon budget individual land models fire-based estimate this carbon budget individual land models.")
44
Anthropogenic Perturbation of the Global Carbon Cycle Perturbation of the global carbon cycle caused by anthropogenic activities, averaged globally for the decade 2004–2013 (GtCO 2 /yr) Source: CDIAC; NOAA-ESRL; Le Quéré et al 2014; Global Carbon Budget 2014CDIACNOAA-ESRLLe Quéré et al 2014Global Carbon Budget 2014 Data: CDIAC/NOAA-ESRL/GCP
 Source: CDIAC; NOAA-ESRL; Le Quéré et al 2014; Global Carbon Budget 2014CDIACNOAA-ESRLLe Quéré et al 2014Global Carbon Budget 2014 Data: CDIAC/NOAA-ESRL/GCP")
45
Land-Use Change Emissions Global land-use change emissions are estimated 3.3 ± 1.8 GtCO 2 during 2004–2013 The data suggests a general decrease in emissions since 1990 Three different estimation methods have been used, indicated here by different shades of grey Land-use change also emits CH 4 and N 2 O which are not shown here Source: Houghton et al 2012; Giglio et al 2013; Le Quéré et al 2014; Global Carbon Budget 2014Houghton et al 2012Giglio et al 2013Le Quéré et al 2014Global Carbon Budget 2014 Indonesian peat fires

46
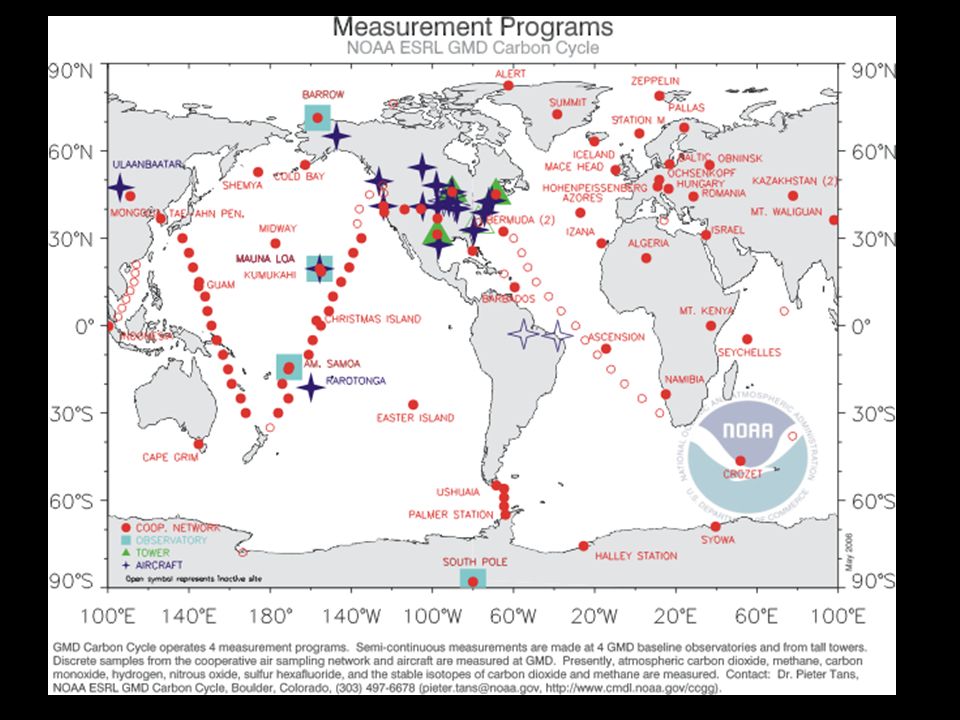
Source: NOAA ESRL

47
s Source: Picarro, Inc. / Nathan Phillips, BU

48
http://media-1.web.britannica.com/eb- media/75/135075-004-105F7745.jpg

49
Observed Emissions and Emissions Scenarios Emissions are on track for 3.2–5.4ºC “likely” increase in temperature above pre-industrial Large and sustained mitigation is required to keep below 2ºC Over 1000 scenarios from the IPCC Fifth Assessment Report are shown Source: Fuss et al 2014; CDIAC; Global Carbon Budget 2014Fuss et al 2014CDIACGlobal Carbon Budget 2014 Data: CDIAC/GCP/IPCC/Fuss et al 2014

50
+ Atmosphere 45% Oceans 26% Land 29% 9.9 Gt C yr -1 0.9 Gt C yr -1 2013 Le Quéré et al (2013) Photosynthesis Beer et al. (2010) Respiration Autotrophic Heterotrophic >120 Gt C yr -1 c.120 Gt C yr -1 Cumulative Atmosphere to Ocean CO 2 Flux (Gt C) Ocean Land Cumulative Atmosphere to Land CO 2 Flux (Gt C) Year Arora et al. 2013 Terrestrial Biosphere CO 2 Flux Dominates Carbon Cycle Prediction Uncertainty Ok Not Ok
 Respiration Autotrophic Heterotrophic >120 Gt C yr -1 c.120 Gt C yr -1 Cumulative Atmosphere to Ocean CO 2 Flux (Gt C) Ocean Land Cumulative Atmosphere to Land CO 2 Flux (Gt C) Year Arora et al Terrestrial Biosphere CO 2 Flux Dominates Carbon Cycle Prediction Uncertainty Ok Not Ok.")
51
+ Atmosphere 45% Oceans 26% Land 29% 9.9 Gt C yr -1 0.9 Gt C yr -1 2013 Le Quéré et al (2013) Photosynthesis Beer et al. (2010) Respiration Autotrophic Heterotrophic >120 Gt C yr -1 c.120 Gt C yr -1 Cumulative Atmosphere to Ocean CO 2 Flux (Gt C) Ocean Land Cumulative Atmosphere to Land CO 2 Flux (Gt C) Year Arora et al. 2013 Terrestrial Biosphere CO 2 Flux Dominates Carbon Cycle Prediction Uncertainty Ok Not Ok Booth et al, ERL, 2012
 Respiration Autotrophic Heterotrophic >120 Gt C yr -1 c.120 Gt C yr -1 Cumulative Atmosphere to Ocean CO 2 Flux (Gt C) Ocean Land Cumulative Atmosphere to Land CO 2 Flux (Gt C) Year Arora et al Terrestrial Biosphere CO 2 Flux Dominates Carbon Cycle Prediction Uncertainty Ok Not Ok Booth et al, ERL,")
52
Buffam et al., 2011, GCB

53
Terrestrial carbon cycle feedback is a leading order uncertainty for climate simulation IPCC AR5 WG1 CH6

54
http://carboncycle.aos.wisc.ed u/carbon-budget-tool/

Similar presentations


 Sinks for Anthropogenic Carbon Physics Today August 2002 30-36.>")


 Autumn Sun 1.>")
 Chris Sabine (NOAA/PMEL/JISAO)>")


