Download presentation
Presentation is loading. Please wait.

1
The Effects of Historical Changes in Global Agricultural Land on the Terrestrial Carbon Cycle Navin Ramankutty [ nramanku@facstaff.wisc.edu] Center for Sustainability and the Global Environment (SAGE) Institute for Environmental Studies, University of Wisconsin Navin Ramankutty [ nramanku@facstaff.wisc.edu] Center for Sustainability and the Global Environment (SAGE) Institute for Environmental Studies, University of Wisconsin
 Institute for Environmental Studies, University of Wisconsin Navin Ramankutty [ Center for Sustainability and the Global Environment (SAGE) Institute for Environmental Studies, University of Wisconsin")
2
(adapted from Schimel et al., 1995) (status in the 1980s)
 (status in the 1980s)")
3
Land Use Emissions Current estimates -- Houghton et al. Land use data over 9 continental-scale regions “Book-keeping” model Current estimates -- Houghton et al. Land use data over 9 continental-scale regions “Book-keeping” model

4
Background

5
Houghton (1999) Over the 1850-1990 period, –Cropland change = 68% of total net C flux –Harvest of wood = 16% –Pastures = 13% –Shifting cultivation = 4% –Plantations = -1% Over the 1850-1990 period, –Cropland change = 68% of total net C flux –Harvest of wood = 16% –Pastures = 13% –Shifting cultivation = 4% –Plantations = -1%
 Over the period, –Cropland change = 68% of total net C flux –Harvest of wood = 16% –Pastures = 13% –Shifting cultivation = 4% –Plantations = -1% Over the period, –Cropland change = 68% of total net C flux –Harvest of wood = 16% –Pastures = 13% –Shifting cultivation = 4% –Plantations = -1%")
6
This Study Geographically-explicit land use data, albeit restricted to croplands Using process-based ecosystem models Conducted as part of the Carbon Cycle Model Linkage Project (CCMLP), funded by the Electric Power Research Institute (EPRI) Geographically-explicit land use data, albeit restricted to croplands Using process-based ecosystem models Conducted as part of the Carbon Cycle Model Linkage Project (CCMLP), funded by the Electric Power Research Institute (EPRI)
, funded by the Electric Power Research Institute (EPRI) Geographically-explicit land use data, albeit restricted to croplands Using process-based ecosystem models Conducted as part of the Carbon Cycle Model Linkage Project (CCMLP), funded by the Electric Power Research Institute (EPRI)")
7
Grand Slam Expt. -- concurrent effects of historical CO 2, climate and land use on terrestrial carbon cycle 4 Terrestrial Biosphere Models HRBM -- Esser et al., Giessen, Germany IBIS -- Foley et al., Kucharik et al., Univ. of Wisconsin, USA LPJ -- Sitch, Prentice et al., PIK & MPI-Jena, Germany TEM -- McGuire et al., Tian et al., MBL, USA 3 simulations from 1860 to 1992 (analysis from 1920) Grand Slam Expt. -- concurrent effects of historical CO 2, climate and land use on terrestrial carbon cycle 4 Terrestrial Biosphere Models HRBM -- Esser et al., Giessen, Germany IBIS -- Foley et al., Kucharik et al., Univ. of Wisconsin, USA LPJ -- Sitch, Prentice et al., PIK & MPI-Jena, Germany TEM -- McGuire et al., Tian et al., MBL, USA 3 simulations from 1860 to 1992 (analysis from 1920) The CCMLP Study S1: CO 2 only S2: CO 2 + Climate S3: CO 2 + Climate + Land use S1: CO 2 only S2: CO 2 + Climate S3: CO 2 + Climate + Land use
 Grand Slam Expt. -- concurrent effects of historical CO 2, climate and land use on terrestrial carbon cycle 4 Terrestrial Biosphere Models HRBM -- Esser et al., Giessen, Germany IBIS -- Foley et al., Kucharik et al., Univ. of Wisconsin, USA LPJ -- Sitch, Prentice et al., PIK & MPI-Jena, Germany TEM -- McGuire et al., Tian et al., MBL, USA 3 simulations from 1860 to 1992 (analysis from 1920) The CCMLP Study S1: CO 2 only S2: CO 2 + Climate S3: CO 2 + Climate + Land use S1: CO 2 only S2: CO 2 + Climate S3: CO 2 + Climate + Land use.")
8
This Talk Effects of land use on the terrestrial carbon cycle = Simulation S3 - S2 Effects of land use on the terrestrial carbon cycle = Simulation S3 - S2

9
Driving Data CO 2 : Ice-core record + Avg. of Mauna Loa & South Pole Climate: Temperature and Precipitation anomalies from Jones et al. (1994) plus Leemans & Cramer (1991); surrogate for pre- 1900 CO 2 : Ice-core record + Avg. of Mauna Loa & South Pole Climate: Temperature and Precipitation anomalies from Jones et al. (1994) plus Leemans & Cramer (1991); surrogate for pre- 1900
 plus Leemans & Cramer (1991); surrogate for pre CO 2 : Ice-core record + Avg. of Mauna Loa & South Pole Climate: Temperature and Precipitation anomalies from Jones et al. (1994) plus Leemans & Cramer (1991); surrogate for pre")
10
Driving Data (continued) Land Use: Boolean version of historical croplands data set of Ramankutty and Foley (1999) –Synthesis of the IGBP 1km global land cover data set with historical cropland census data Land Use: Boolean version of historical croplands data set of Ramankutty and Foley (1999) –Synthesis of the IGBP 1km global land cover data set with historical cropland census data --> talk in parallel session B2, at 4:25 pm, Room EF
 Land Use: Boolean version of historical croplands data set of Ramankutty and Foley (1999) –Synthesis of the IGBP 1km global land cover data set with historical cropland census data Land Use: Boolean version of historical croplands data set of Ramankutty and Foley (1999) –Synthesis of the IGBP 1km global land cover data set with historical cropland census data --> talk in parallel session B2, at 4:25 pm, Room EF")
11
Global Cropland Distributions Source: Ramankutty & Foley, 1999 Center for Sustainability and the Global Environment, Institute for Environmental Studies University of Wisconsin, Madison Center for Sustainability and the Global Environment, Institute for Environmental Studies University of Wisconsin, Madison

12
Global Cropland Distributions Source: Ramankutty & Foley, 1999 Center for Sustainability and the Global Environment, Institute for Environmental Studies University of Wisconsin, Madison Center for Sustainability and the Global Environment, Institute for Environmental Studies University of Wisconsin, Madison

13
Global Cropland Distributions Source: Ramankutty & Foley, 1999 Center for Sustainability and the Global Environment, Institute for Environmental Studies University of Wisconsin, Madison Center for Sustainability and the Global Environment, Institute for Environmental Studies University of Wisconsin, Madison

14
Microbial Respiration Net Primary productivity Natural Vegetation Biomass Harvest Product decay flux Product Pools = 1, 10, & 100yrs Agricultural Products Net Carbon Exchange,NCE (positive into the atmosphere) Net Primary Productivity Crop Biomass Harvest Natural Turnover Litter & Soil Organic Matter SlashCrop Residue Product decay flux = 1 yr The Carbon Flow in CCMLP Expts.
 Net Primary Productivity Crop Biomass Harvest Natural Turnover Litter & Soil Organic Matter SlashCrop Residue Product decay flux = 1 yr The Carbon Flow in CCMLP Expts.")
15
CCMLP Land Use Flux

16
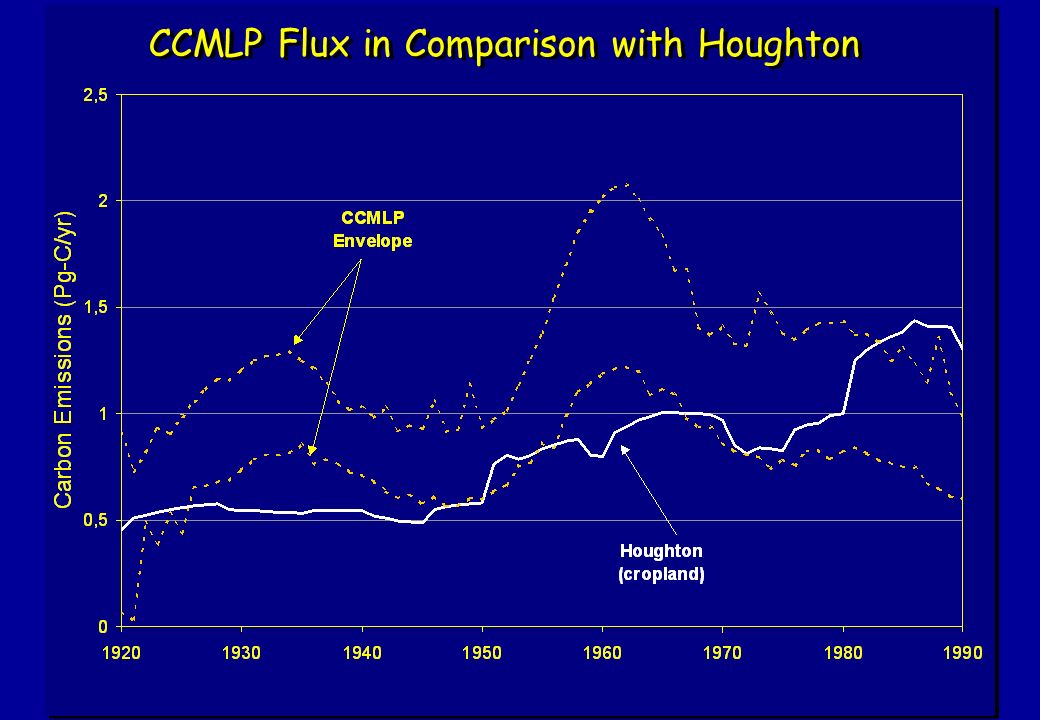
CCMLP Flux in Comparison with Houghton

19
Summary

20
What does this imply? In the 1980s, Houghton (all landuse) = 2.0 Gt-C/yr Houghton (croplands) = 1.3 Gt-C/yr ==> croplands = 65% of total land use flux CCMLP cropland flux = 0.6-1.0 Gt-C/yr –Scaled by 65%, ==> all landuse flux = 0.9-1.5 Gt-C/yr In the 1980s, Houghton (all landuse) = 2.0 Gt-C/yr Houghton (croplands) = 1.3 Gt-C/yr ==> croplands = 65% of total land use flux CCMLP cropland flux = 0.6-1.0 Gt-C/yr –Scaled by 65%, ==> all landuse flux = 0.9-1.5 Gt-C/yr
 = 2.0 Gt-C/yr Houghton (croplands) = 1.3 Gt-C/yr ==> croplands = 65% of total land use flux CCMLP cropland flux = Gt-C/yr –Scaled by 65%, ==> all landuse flux = Gt-C/yr In the 1980s, Houghton (all landuse) = 2.0 Gt-C/yr Houghton (croplands) = 1.3 Gt-C/yr ==> croplands = 65% of total land use flux CCMLP cropland flux = Gt-C/yr –Scaled by 65%, ==> all landuse flux = Gt-C/yr.")
21
Implications for Missing Sink

23
Why are the land use emissions different? Differences in the land use data?

24
Cropland Conversion Rates

25
Why are the land use emissions different? Differences in the land use data? Differences in process representation? –regrowth, soil turnover, product fluxes,... Differences in the land use data? Differences in process representation? –regrowth, soil turnover, product fluxes,...

26
Houghton conversion rates and emissions

27
CCMLP conversion rates and emissions

28
Why are the land use emissions different? Differences in the land use data? Differences in process representation –regrowth, soil turnover,... Different vegetation types are cleared? Differences in the land use data? Differences in process representation –regrowth, soil turnover,... Different vegetation types are cleared?

29
CCMLP Land Use Flux

30
Conclusions There are now two different estimates of carbon emissions due to land use The disagreement between the estimates is related to: –Differences in land conversion rates –Differences in process representation Inverse estimates of the missing carbon sink are critically dependent on estimates of land use carbon emissions There are now two different estimates of carbon emissions due to land use The disagreement between the estimates is related to: –Differences in land conversion rates –Differences in process representation Inverse estimates of the missing carbon sink are critically dependent on estimates of land use carbon emissions

Similar presentations


>")


