Download presentation
Presentation is loading. Please wait.

1
Organizing data into classes such that there is high intra-class similarity low inter-class similarity Finding the class labels and the number of classes directly from the data (in contrast to classification). More informally, finding natural groupings among objects. What is Clustering? Also called unsupervised learning, sometimes called classification by statisticians and sorting by psychologists and segmentation by people in marketing

2
What is a natural grouping among these objects?

3
School Employees Simpson's Family MalesFemales Clustering is subjective What is a natural grouping among these objects?

4
What is Similarity? The quality or state of being similar; likeness; resemblance; as, a similarity of features. Similarity is hard to define, but… “We know it when we see it” The real meaning of similarity is a philosophical question. We will take a more pragmatic approach. Webster's Dictionary

5
Defining Distance Measures Definition: Let O 1 and O 2 be two objects from the universe of possible objects. The distance (dissimilarity) between O 1 and O 2 is a real number denoted by D(O 1,O 2 ) 0.233342.7 PeterPiotr
 between O 1 and O 2 is a real number denoted by D(O 1,O 2 ) PeterPiotr.")
6
What properties should a distance measure have? D(A,B) = D(B,A) Symmetry D(A,A) = 0 Constancy of Self-Similarity D(A,B) = 0 IIf A= B Positivity (Separation) D(A,B) D(A,C) + D(B,C) Triangular Inequality PeterPiotr 3 d('', '') = 0 d(s, '') = d('', s) = |s| -- i.e. length of s d(s1+ch1, s2+ch2) = min( d(s1, s2) + if ch1=ch2 then 0 else 1 fi, d(s1+ch1, s2) + 1, d(s1, s2+ch2) + 1 ) When we peek inside one of these black boxes, we see some function on two variables. These functions might very simple or very complex. In either case it is natural to ask, what properties should these functions have?
 = D(B,A) Symmetry D(A,A) = 0 Constancy of Self-Similarity D(A,B) = 0 IIf A= B Positivity (Separation) D(A,B) D(A,C) + D(B,C) Triangular Inequality PeterPiotr 3 d( , ) = 0 d(s, ) = d( , s) = |s| -- i.e. length of s d(s1+ch1, s2+ch2) = min( d(s1, s2) + if ch1=ch2 then 0 else 1 fi, d(s1+ch1, s2) + 1, d(s1, s2+ch2) + 1 ) When we peek inside one of these black boxes, we see some function on two variables. These functions might very simple or very complex. In either case it is natural to ask, what properties should these functions have .")
7
Intuitions behind desirable distance measure properties D(A,B) = D(B,A) Symmetry Otherwise you could claim “Alex looks like Bob, but Bob looks nothing like Alex.” D(A,A) = 0 Constancy of Self-Similarity Otherwise you could claim “Alex looks more like Bob, than Bob does.” D(A,B) = 0 IIf A=B Positivity (Separation) Otherwise there are objects in your world that are different, but you cannot tell apart. D(A,B) D(A,C) + D(B,C) Triangular Inequality Otherwise you could claim “Alex is very like Bob, and Alex is very like Carl, but Bob is very unlike Carl.”
 D(A,C) + D(B,C) Triangular Inequality Otherwise you could claim Alex is very like Bob, and Alex is very like Carl, but Bob is very unlike Carl. .")
8
Two Types of Clustering Hierarchical Partitional algorithms: Construct various partitions and then evaluate them by some criterion (we will see an example called BIRCH) Hierarchical algorithms: Create a hierarchical decomposition of the set of objects using some criterion Partitional
 Hierarchical algorithms: Create a hierarchical decomposition of the set of objects using some criterion Partitional")
9
We can always convert a hierarchical clustering to a partitional clustering

10
Desirable Properties of a Clustering Algorithm Scalability (in terms of both time and space) Ability to deal with different data types Minimal requirements for domain knowledge to determine input parameters Able to deal with noise and outliers Insensitive to order of input records Incorporation of user-specified constraints Interpretability and usability
 Ability to deal with different data types Minimal requirements for domain knowledge to determine input parameters Able to deal with noise and outliers Insensitive to order of input records Incorporation of user-specified constraints Interpretability and usability")
11
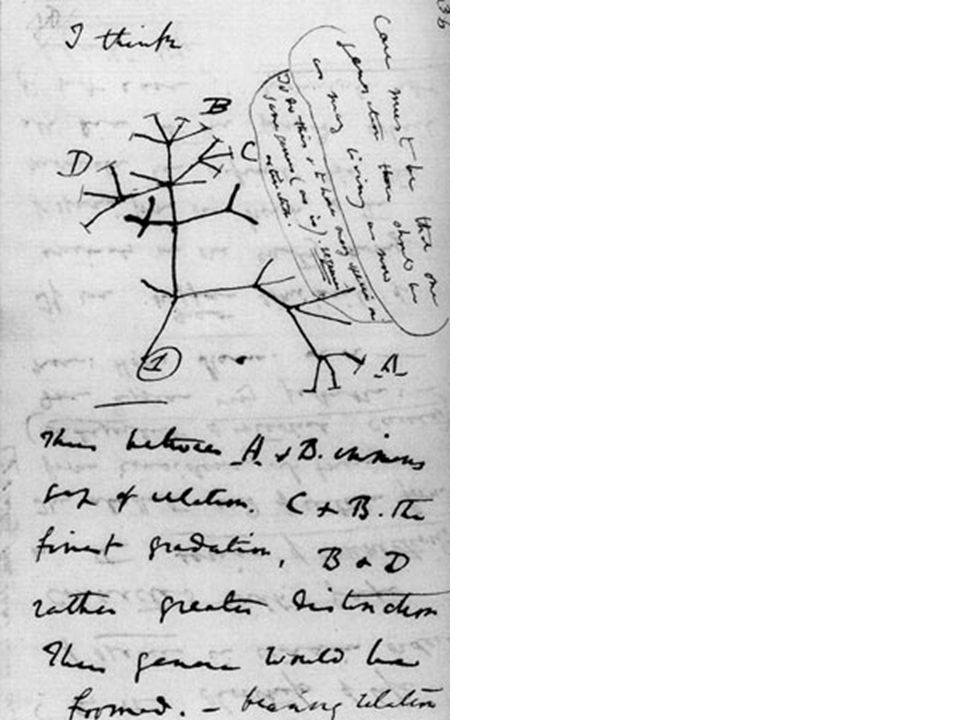
A Useful Tool for Summarizing Similarity Measurements In order to better appreciate and evaluate the examples given in the early part of this talk, we will now introduce the dendrogram. The similarity between two objects in a dendrogram is represented as the height of the lowest internal node they share.

12
(Bovine:0.69395, (Spider Monkey 0.390, (Gibbon:0.36079,(Orang:0.33636,(Gorilla:0.17147,(Chimp:0.19268, Human:0.11927):0.08386):0.06124):0.15057):0.54939); There is only one dataset that can be perfectly clustered using a hierarchy…
: ): ): ): ); There is only one dataset that can be perfectly clustered using a hierarchy…")
13
Business & Economy B2BFinanceShoppingJobs Aerospace Agriculture… Banking Bonds…Animals ApparelCareer Workspace Note that hierarchies are commonly used to organize information, for example in a web portal. Yahoo’s hierarchy is manually created, we will focus on automatic creation of hierarchies in data mining.

14
Pedro (Portuguese) Petros (Greek), Peter (English), Piotr (Polish), Peadar (Irish), Pierre (French), Peder (Danish), Peka (Hawaiian), Pietro (Italian), Piero (Italian Alternative), Petr (Czech), Pyotr (Russian) Cristovao (Portuguese) Christoph (German), Christophe (French), Cristobal (Spanish), Cristoforo (Italian), Kristoffer (Scandinavian), Krystof (Czech), Christopher (English) Miguel (Portuguese) Michalis (Greek), Michael (English), Mick (Irish!) A Demonstration of Hierarchical Clustering using String Edit Distance Piotr Pyotr Petros Pietro Pedro Pierre Piero Peter Peder Peka Peadar Michalis Michael Miguel Mick Cristovao Christopher Christophe Christoph Crisdean Cristobal Cristoforo Kristoffer Krystof
 Petros (Greek), Peter (English), Piotr (Polish), Peadar (Irish), Pierre (French), Peder (Danish), Peka (Hawaiian), Pietro (Italian), Piero (Italian Alternative), Petr (Czech), Pyotr (Russian) Cristovao (Portuguese) Christoph (German), Christophe (French), Cristobal (Spanish), Cristoforo (Italian), Kristoffer (Scandinavian), Krystof (Czech), Christopher (English) Miguel (Portuguese) Michalis (Greek), Michael (English), Mick (Irish!) A Demonstration of Hierarchical Clustering using String Edit Distance Piotr Pyotr Petros Pietro Pedro Pierre Piero Peter Peder Peka Peadar Michalis Michael Miguel Mick Cristovao Christopher Christophe Christoph Crisdean Cristobal Cristoforo Kristoffer Krystof")
15
Piotr Pyotr Petros Pietro Pedro Pierre Piero Peter Peder Peka Peadar Pedro (Portuguese/Spanish) Petros (Greek), Peter (English), Piotr (Polish), Peadar (Irish), Pierre (French), Peder (Danish), Peka (Hawaiian), Pietro (Italian), Piero (Italian Alternative), Petr (Czech), Pyotr (Russian)
 Petros (Greek), Peter (English), Piotr (Polish), Peadar (Irish), Pierre (French), Peder (Danish), Peka (Hawaiian), Pietro (Italian), Piero (Italian Alternative), Petr (Czech), Pyotr (Russian)")
16
ANGUILLAAUSTRALIA St. Helena & Dependencies South Georgia & South Sandwich Islands U.K. Serbia & Montenegro (Yugoslavia) FRANCENIGERINDIAIRELANDBRAZIL Hierarchal clustering can sometimes show patterns that are meaningless or spurious For example, in this clustering, the tight grouping of Australia, Anguilla, St. Helena etc is meaningful, since all these countries are former UK colonies. However the tight grouping of Niger and India is completely spurious, there is no connection between the two.
 FRANCENIGERINDIAIRELANDBRAZIL Hierarchal clustering can sometimes show patterns that are meaningless or spurious For example, in this clustering, the tight grouping of Australia, Anguilla, St. Helena etc is meaningful, since all these countries are former UK colonies. However the tight grouping of Niger and India is completely spurious, there is no connection between the two..")
17
ANGUILLAAUSTRALIA St. Helena & Dependencies South Georgia & South Sandwich Islands U.K. Serbia & Montenegro (Yugoslavia) FRANCENIGERINDIAIRELANDBRAZIL The flag of Niger is orange over white over green, with an orange disc on the central white stripe, symbolizing the sun. The orange stands the Sahara desert, which borders Niger to the north. Green stands for the grassy plains of the south and west and for the River Niger which sustains them. It also stands for fraternity and hope. White generally symbolizes purity and hope. The Indian flag is a horizontal tricolor in equal proportion of deep saffron on the top, white in the middle and dark green at the bottom. In the center of the white band, there is a wheel in navy blue to indicate the Dharma Chakra, the wheel of law in the Sarnath Lion Capital. This center symbol or the 'CHAKRA' is a symbol dating back to 2nd century BC. The saffron stands for courage and sacrifice; the white, for purity and truth; the green for growth and auspiciousness.
 FRANCENIGERINDIAIRELANDBRAZIL The flag of Niger is orange over white over green, with an orange disc on the central white stripe, symbolizing the sun. The orange stands the Sahara desert, which borders Niger to the north. Green stands for the grassy plains of the south and west and for the River Niger which sustains them. It also stands for fraternity and hope. White generally symbolizes purity and hope. The Indian flag is a horizontal tricolor in equal proportion of deep saffron on the top, white in the middle and dark green at the bottom. In the center of the white band, there is a wheel in navy blue to indicate the Dharma Chakra, the wheel of law in the Sarnath Lion Capital. This center symbol or the CHAKRA is a symbol dating back to 2nd century BC. The saffron stands for courage and sacrifice; the white, for purity and truth; the green for growth and auspiciousness..")
18
We can look at the dendrogram to determine the “correct” number of clusters. In this case, the two highly separated subtrees are highly suggestive of two clusters. (Things are rarely this clear cut, unfortunately)
.")
19
Outlier One potential use of a dendrogram is to detect outliers The single isolated branch is suggestive of a data point that is very different to all others

20
(How-to) Hierarchical Clustering The number of dendrograms with n leafs = (2n -3)!/[(2 (n -2) ) (n -2)!] Number Number of Possible of LeafsDendrograms 213 415 5105...… 10 34,459,425 Since we cannot test all possible trees we will have to heuristic search of all possible trees. We could do this.. Bottom-Up (agglomerative): Starting with each item in its own cluster, find the best pair to merge into a new cluster. Repeat until all clusters are fused together. Top-Down (divisive): Starting with all the data in a single cluster, consider every possible way to divide the cluster into two. Choose the best division and recursively operate on both sides.
![(How-to) Hierarchical Clustering The number of dendrograms with n leafs = (2n -3)!/[(2 (n -2) ) (n -2)!] Number Number of Possible of LeafsDendrograms … 10 34,459,425 Since we cannot test all possible trees we will have to heuristic search of all possible trees.](http://images.slideplayer.com/26/8565019/slides/slide_20.jpg "We could do this.. Bottom-Up (agglomerative): Starting with each item in its own cluster, find the best pair to merge into a new cluster. Repeat until all clusters are fused together. Top-Down (divisive): Starting with all the data in a single cluster, consider every possible way to divide the cluster into two. Choose the best division and recursively operate on both sides..")
21
08877 0244 033 01 0 D(, ) = 8 D(, ) = 1 We begin with a distance matrix which contains the distances between every pair of objects in our database.
 = 8 D(, ) = 1 We begin with a distance matrix which contains the distances between every pair of objects in our database.")
22
Bottom-Up (agglomerative): Bottom-Up (agglomerative): Starting with each item in its own cluster, find the best pair to merge into a new cluster. Repeat until all clusters are fused together. … Consider all possible merges… Choose the best

23
Bottom-Up (agglomerative): Bottom-Up (agglomerative): Starting with each item in its own cluster, find the best pair to merge into a new cluster. Repeat until all clusters are fused together. … Consider all possible merges… Choose the best Consider all possible merges… … Choose the best

24
Bottom-Up (agglomerative): Bottom-Up (agglomerative): Starting with each item in its own cluster, find the best pair to merge into a new cluster. Repeat until all clusters are fused together. … Consider all possible merges… Choose the best Consider all possible merges… … Choose the best Consider all possible merges… Choose the best …

25
Bottom-Up (agglomerative): Bottom-Up (agglomerative): Starting with each item in its own cluster, find the best pair to merge into a new cluster. Repeat until all clusters are fused together. … Consider all possible merges… Choose the best Consider all possible merges… … Choose the best Consider all possible merges… Choose the best …

26
We know how to measure the distance between two objects, but defining the distance between an object and a cluster, or defining the distance between two clusters is non obvious. Single linkage (nearest neighbor): Single linkage (nearest neighbor): In this method the distance between two clusters is determined by the distance of the two closest objects (nearest neighbors) in the different clusters. Complete linkage (furthest neighbor): Complete linkage (furthest neighbor): In this method, the distances between clusters are determined by the greatest distance between any two objects in the different clusters (i.e., by the "furthest neighbors"). Group average linkage Group average linkage : In this method, the distance between two clusters is calculated as the average distance between all pairs of objects in the two different clusters. Wards Linkage Wards Linkage : In this method, we try to minimize the variance of the merged clusters
: Single linkage (nearest neighbor): In this method the distance between two clusters is determined by the distance of the two closest objects (nearest neighbors) in the different clusters. Complete linkage (furthest neighbor): Complete linkage (furthest neighbor): In this method, the distances between clusters are determined by the greatest distance between any two objects in the different clusters (i.e., by the furthest neighbors ). Group average linkage Group average linkage : In this method, the distance between two clusters is calculated as the average distance between all pairs of objects in the two different clusters. Wards Linkage Wards Linkage : In this method, we try to minimize the variance of the merged clusters.")
27
Average linkageWards linkage Single linkage

28
ABCDE (A,((B,C),(D,E))) A BC DE
,(D,E))) A BC DE")
29
Homework, Due in class next week Fill in the missing information

33
Co-Sponsorship Networks– Senators of the 108th Congress Although a member of the Democratic Party, Miller backed Republican President George W. Bush over Democratic nominee John Kerry in the 2004 presidential election and since 2003 has frequently criticized the Democratic Party, and has publicly supported several Republican candidates.

35
Atlatls Anthropomorphs Bighorn Sheep

36
Summary of Hierarchal Clustering Methods No need to specify the number of clusters in advance. Hierarchal nature maps nicely onto human intuition for some domains They do not scale well: time complexity of at least O(n 2 ), where n is the number of total objects. Like any heuristic search algorithms, local optima are a problem. Interpretation of results is (very) subjective.
, where n is the number of total objects. Like any heuristic search algorithms, local optima are a problem. Interpretation of results is (very) subjective..")
37
Homework, Due in class in two days. Fill in the missing information

38
Up to this point we have simply assumed that we can measure similarity, but How do we measure similarity? 0.233342.7 PeterPiotr

39
A generic technique for measuring similarity To measure the similarity between two objects, transform one of the objects into the other, and measure how much effort it took. The measure of effort becomes the distance measure. The distance between Patty and Selma. Change dress color, 1 point Change earring shape, 1 point Change hair part, 1 point D(Patty,Selma) = 3 The distance between Marge and Selma. Change dress color, 1 point Add earrings, 1 point Decrease height, 1 point Take up smoking, 1 point Lose weight, 1 point D(Marge,Selma) = 5 This is called the “edit distance” or the “transformation distance”
 = 3 The distance between Marge and Selma. Change dress color, 1 point Add earrings, 1 point Decrease height, 1 point Take up smoking, 1 point Lose weight, 1 point D(Marge,Selma) = 5 This is called the edit distance or the transformation distance .")
40
Peter Piter Pioter Piotr Substitution (i for e) Insertion (o) Deletion (e) Edit Distance Example It is possible to transform any string Q into string C, using only Substitution, Insertion and Deletion. Assume that each of these operators has a cost associated with it. The similarity between two strings can be defined as the cost of the cheapest transformation from Q to C. Note that for now we have ignored the issue of how we can find this cheapest transformation How similar are the names “Peter” and “Piotr”? Assume the following cost function Substitution1 Unit Insertion1 Unit Deletion1 Unit D( Peter,Piotr ) is 3 Piotr Pyotr Petros Pietro Pedro Pierre Piero Peter
 is 3 Piotr Pyotr Petros Pietro Pedro Pierre Piero Peter.")
41
0.3422 TGGCCGTGCTAGGCCCCACCCC CCGTGCTAGGCCCCAC What would be a good distance measure for DNA?

42
TGGCCGTGCTAGGCCCCACCCC TGGCCGTGCTAGGCCCCACCCCA What would be a good distance measure for DNA? TGGCCGTGCTAGGCCCCACCCC TGGCCGTGCTATGCCCCACCCC TGGCCGTGCTAGGCCCCACCCC ATGGCCGTGCTAGGCCCCACCCC Hamming distance? Only defined for equal length strings. Brutally sensitive to insertions/deletions

43
TGGCCGTGCTAGGCCCCACCCC TGGCCGTGCTAGGCCCCACCCCA What would be a good distance measure for DNA? String Edit Distance? Is defined for strings of different lengths Not sensitive to insertions/deletions Very slow, quadratic complexity.

44
It would be nice if the distance allowed use to imbed the DNA into Euclidean space TGGCCGTGCT GGCCGTGCTA CCGTGCTA CCGTGCTTTA

45
TGGCCGTGCTAGGCCCCACCCCTACCTTGCA GTCCCCGCAAGCTCATCTGCGCGAACCAGA ACGCCCACCACCCTTGGGTTGAAATTAAGGA GGCGGTTGGCAGCTTCCCAGGCGCACGTAC CTGCGAATAAATAACTGTCCGCACAAGGAGC CCGACGATAGTCGACCCTCTCTAGTCACGAC CTACACACAGAACCTGTGCTAGACGCCATGA GATAAGCTAACACAAAAACATTTCCCACTAC TGCTGCCCGCGGGCTACCGGCCACCCCTGG CTCAGCCTGGCGAAGCCGCCCTTCA The DNA of two species… Are they similar? CCGTGCTAGGGCCACCTACCTTGGTCCG CCGCAAGCTCATCTGCGCGAACCAGAAC GCCACCACCTTGGGTTGAAATTAAGGAG GCGGTTGGCAGCTTCCAGGCGCACGTAC CTGCGAATAAATAACTGTCCGCACAAGG AGCCGACGATAAAGAAGAGAGTCGACCT CTCTAGTCACGACCTACACACAGAACCT GTGCTAGACGCCATGAGATAAGCTAACA

46
0.200.24 0.260.30 CCGTGCTAGGGCCACCTACCTTGGTCCG CCGCAAGCTCATCTGCGCGAACCAGAAC GCCACCACCTTGGGTTGAAATTAAGGAG GCGGTTGGCAGCTTCCAGGCGCACGTAC CTGCGAATAAATAACTGTCCGCACAAGG AGCCGACGATAAAGAAGAGAGTCGACCT CTCTAGTCACGACCTACACACAGAACCT GTGCTAGACGCCATGAGATAAGCTAACA AC GT

47
AACACACC AGAGATATCGCGCTCT GAGAGCGCTATATCTC GGGTGTTGTGTT AC GT AAAAACACAACAACC AAGAATACGACGACTACT AGAAGAAGCAGCATAATAATCATC AGGAGTAGTATGATGATT GAAGACGACGCAGCAGCC GAGGAGGATGATGCGGCGGCTGCT GGAGGCGTAGTAGTCGTC GGGGGTGTGGTGGTT CAACACCACCCACCC CAGCAGCATCATCCGCCT CGACGACGCCGCCTACTACTCCTC CGGCGTCGTCTGCTGCTT TAATACTACTCATCATCC TAGTAGTATTATTCGTCGTCTTCT TGATGATGCTGCTTATTC TGGTGTTGTTTGTTT ACAC l=1 l=2 l=3 l stands for “Level”

48
CCGTGCTAGGCCCCACCCCTACCTTGCA GTCCCCGCAAGCTCATCTGCGCGAACCA GAACGCCCACCACCCTTGGGTTGAAATT AAGGAGGCGGTTGGCAGCTTCCCAGGCG CACGTACCTGCGAATAAATAACTGTCCGC ACAAGGAGCCCGACGATAGTCGACCCTC TCTAGTCACGACCTACACACAGAACCTG TGCTAGACGCCATGAGATAAGCTAACA 0.020.04 0.03 0.09 0.04 0.07 0.02 0.11 0.03 0 1

49
CCGTGCTAGGCCCCACCCCTACCTTGCA GTCCCCGCAAGCTCATCTGCGCGAACCA GAACGCCCACCACCCTTGGGTTGAAATT AAGGAGGCGGTTGGCAGCTTCCCAGGCG CACGTACCTGCGAATAAATAACTGTCCGC ACAAGGAGCCCGACGATAGTCGACCCTC TCTAGTCACGACCTACACACAGAACCTG TGCTAGACGCCATGAGATAAGCTAACA OK. Given any DNA string I can make a colored bitmap, so what?

50
Note Elephas maximus is the Indian Elephant, Loxodonta africana is the African elephant Pan troglodytes is the chimpanzee

51
0.030.01 0.03 0.10 0.02 0.06 0.02 0.08 0.04 0.02 0.04 0.03 0.09 0.04 0.07 0.02 0.11 0.03 D(A,B) = sqrt(sum( (0.03-0.02) 2 + (0.03-0.02) 2 + … )) What would be a good distance measure for DNA?
 = sqrt(sum( ( ) 2 + ( ) 2 + … )) What would be a good distance measure for DNA")
52
chimpanzee pygmy chimpanzee Human orangutan rhesus monkey hippopotamus pygmy sperm whale sperm whale Indian rhinoceros white rhinoceros African elephant Asiatic elephant Placental Mammals AfrotheresLaurasiatheres Perissodactyla CetartiodactylaPrimates Cercopithecidae Hominidae Homo/Pan/ Gorilla group Pongo Pan Cetacea A dendrogram for 12 mammals created using only the information contained in their 8 by 8 Intelligent Icons. The dendrogram agrees with the modern consensus except the two bifurcations marked with red dots are in the wrong order.

53
10 12345678 9 1 2 3 4 5 6 7 8 9 TGGCCGTGCT GGCCGTGCTA CCGTGCTA CCGTGCTTTA AACACACC AGAGATATCGCGCTCT GAGAGCGCTATATCTC GGGTGTTGTGTT AC GT AAAAACACAACA ACC AAGAATACGACGACTACT AGAAGAAGCAGCATAATAATCATC AGGAGTAGTATGATGATT GAAGACGACGCAGCAGCC GAGGAGGATGATGCGGCGGCTGCT GGAGGCGTAGTAGTCGTC GGGGGTGTGGTGGTT CAACACCACCCACCC CAGCAGCATCATCCGCCT CGACGACGCCGCCTACTACTCCTC CGGCGTCGTCTGCTGCTT TAATACTACTCATCATCC TAGTAGTATTATTCGTCGTCTTCT TGATGATGCTGCTTATTC TGGTGTTGTTTGTTT ACAC In summary, we have seen a method that allows us to project long DNA strings into 4,16, 64… dimensions. It is a good example of : Designing a distance measure Dimensionality reduction Feature generation

54
"a", "and", "as", "be", "but", "for", "have", "he", "him", "his", "i", "in", "is", "it", "me", "my", "not", "of", "p_apos", "p_colon", "p_comma", "p_exlam", "p_hyphen", "p_period", "p_ques", "p_semi", "so", "that", "the", "this", "thou", "to", "what", "will", "with", "you", "your".

55
Partitional Clustering Nonhierarchical, each instance is placed in exactly one of K nonoverlapping clusters. Since only one set of clusters is output, the user normally has to input the desired number of clusters K.

56
Squared Error 10 123456789 1 2 3 4 5 6 7 8 9 Objective Function

57
Algorithm k-means 1. Decide on a value for k. 2. Initialize the k cluster centers (randomly, if necessary). 3. Decide the class memberships of the N objects by assigning them to the nearest cluster center. 4. Re-estimate the k cluster centers, by assuming the memberships found above are correct. 5. If none of the N objects changed membership in the last iteration, exit. Otherwise goto 3.
. 3. Decide the class memberships of the N objects by assigning them to the nearest cluster center. 4. Re-estimate the k cluster centers, by assuming the memberships found above are correct. 5. If none of the N objects changed membership in the last iteration, exit. Otherwise goto 3..")
58
0 1 2 3 4 5 012345 K-means Clustering: Step 1 Algorithm: k-means, Distance Metric: Euclidean Distance k1k1 k2k2 k3k3

59
0 1 2 3 4 5 012345 K-means Clustering: Step 2 Algorithm: k-means, Distance Metric: Euclidean Distance k1k1 k2k2 k3k3

60
0 1 2 3 4 5 012345 K-means Clustering: Step 3 Algorithm: k-means, Distance Metric: Euclidean Distance k1k1 k2k2 k3k3

61
0 1 2 3 4 5 012345 K-means Clustering: Step 4 Algorithm: k-means, Distance Metric: Euclidean Distance k1k1 k2k2 k3k3

62
K-means Clustering: Step 5 Algorithm: k-means, Distance Metric: Euclidean Distance k1k1 k2k2 k3k3

63
Comments on the K-Means Method Strength –Relatively efficient: O(tkn), where n is # objects, k is # clusters, and t is # iterations. Normally, k, t << n. –Often terminates at a local optimum. The global optimum may be found using techniques such as: deterministic annealing and genetic algorithms Weakness –Applicable only when mean is defined, then what about categorical data? –Need to specify k, the number of clusters, in advance –Unable to handle noisy data and outliers –Not suitable to discover clusters with non-convex shapes

64
The K-Medoids Clustering Method Find representative objects, called medoids, in clusters PAM (Partitioning Around Medoids, 1987) –starts from an initial set of medoids and iteratively replaces one of the medoids by one of the non-medoids if it improves the total distance of the resulting clustering –PAM works effectively for small data sets, but does not scale well for large data sets
 –starts from an initial set of medoids and iteratively replaces one of the medoids by one of the non-medoids if it improves the total distance of the resulting clustering –PAM works effectively for small data sets, but does not scale well for large data sets")
65
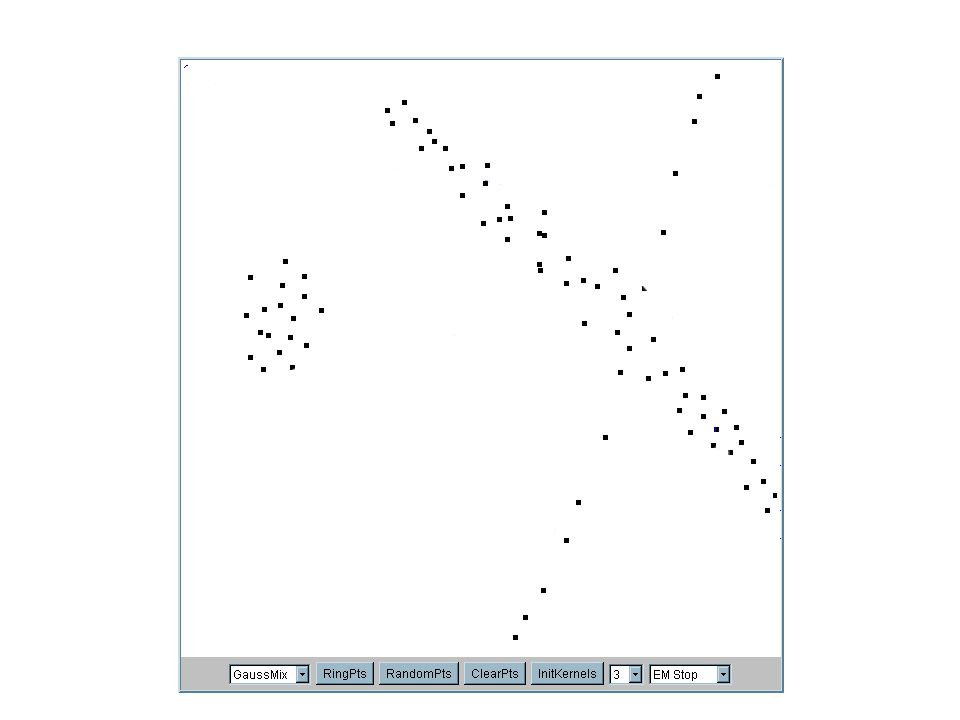
EM Algorithm Initialize K cluster centers Iterate between two steps –Expectation step: assign points to clusters –Maximation step: estimate model parameters

69
Iteration 1 The cluster means are randomly assigned

70
Iteration 2

71
Iteration 5

72
Iteration 25

73
Nearest Neighbor Clustering Not to be confused with Nearest Neighbor Classification Items are iteratively merged into the existing clusters that are closest. Incremental Threshold, t, used to determine if items are added to existing clusters or a new cluster is created. What happens if the data is streaming…

74
10 Threshold t t 1 2

75
10 New data point arrives… It is within the threshold for cluster 1, so add it to the cluster, and update cluster center. 1 2 3

76
10 New data point arrives… It is not within the threshold for cluster 1, so create a new cluster, and so on.. 1 2 3 4 Algorithm is highly order dependent… It is difficult to determine t in advance…

77
Partitional Clustering Algorithms Clustering algorithms have been designed to handle very large datasets E.g. the Birch algorithm Main idea: use an in-memory R-tree to store points that are being clustered Insert points one at a time into the R-tree, merging a new point with an existing cluster if is less than some distance away If there are more leaf nodes than fit in memory, merge existing clusters that are close to each other At the end of first pass we get a large number of clusters at the leaves of the R-tree Merge clusters to reduce the number of clusters

78
Partitional Clustering Algorithms The Birch algorithm R10 R11 R12 R1 R2 R3R4 R5 R6R7 R8 R9 Data nodes containing points R10R11 R12 We need to specify the number of clusters in advance, I have chosen 2

79
Partitional Clustering Algorithms The Birch algorithm R10 R11 R12 {R1,R2} R3R4 R5 R6R7 R8 R9 Data nodes containing points R10R11 R12

80
Partitional Clustering Algorithms The Birch algorithm R10R11 R12

81
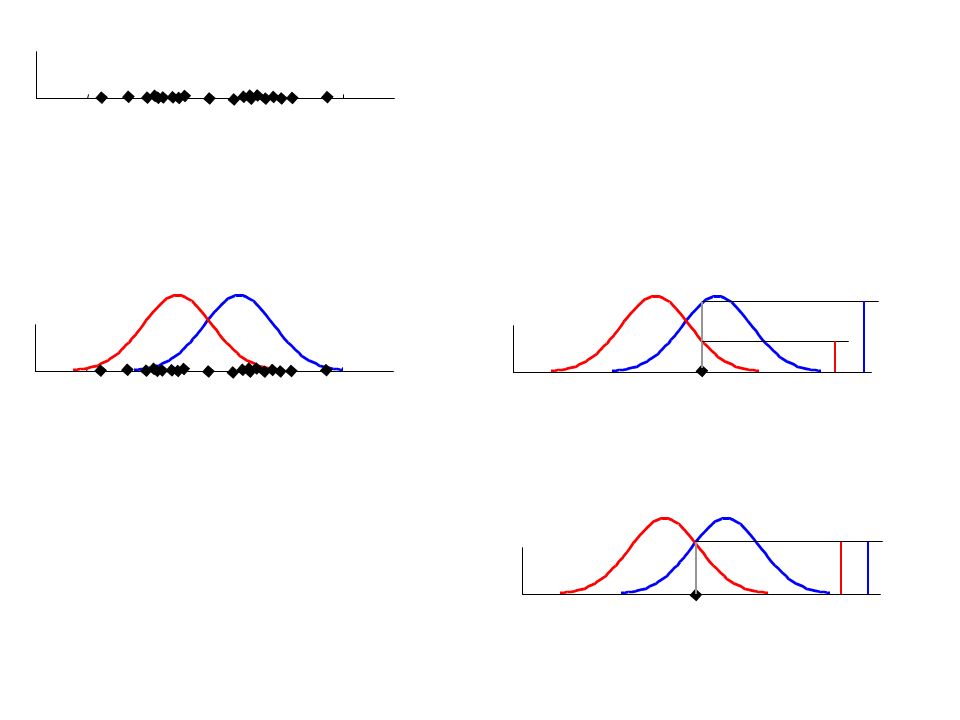
How can we tell the right number of clusters? In general, this is a unsolved problem. However there are many approximate methods. In the next few slides we will see an example. For our example, we will use the familiar katydid/grasshopper dataset. However, in this case we are imagining that we do NOT know the class labels. We are only clustering on the X and Y axis values.

82
12345678910 When k = 1, the objective function is 873.0

83
12345678910 When k = 2, the objective function is 173.1

84
12345678910 When k = 3, the objective function is 133.6

85
0.00E+00 1.00E+02 2.00E+02 3.00E+02 4.00E+02 5.00E+02 6.00E+02 7.00E+02 8.00E+02 9.00E+02 1.00E+03 123456 We can plot the objective function values for k equals 1 to 6… The abrupt change at k = 2, is highly suggestive of two clusters in the data. This technique for determining the number of clusters is known as “knee finding” or “elbow finding”. Note that the results are not always as clear cut as in this toy example k Objective Function

Similar presentations


 Vipin Kumar Army High Performance.>")


