Download presentation
Presentation is loading. Please wait.

1
Porter Thorndike Systems Engineer

2
Topics Micrographs Interactive PDF documents Cascading Stylesheets and Gradients Customer Examples Lightning Round

3
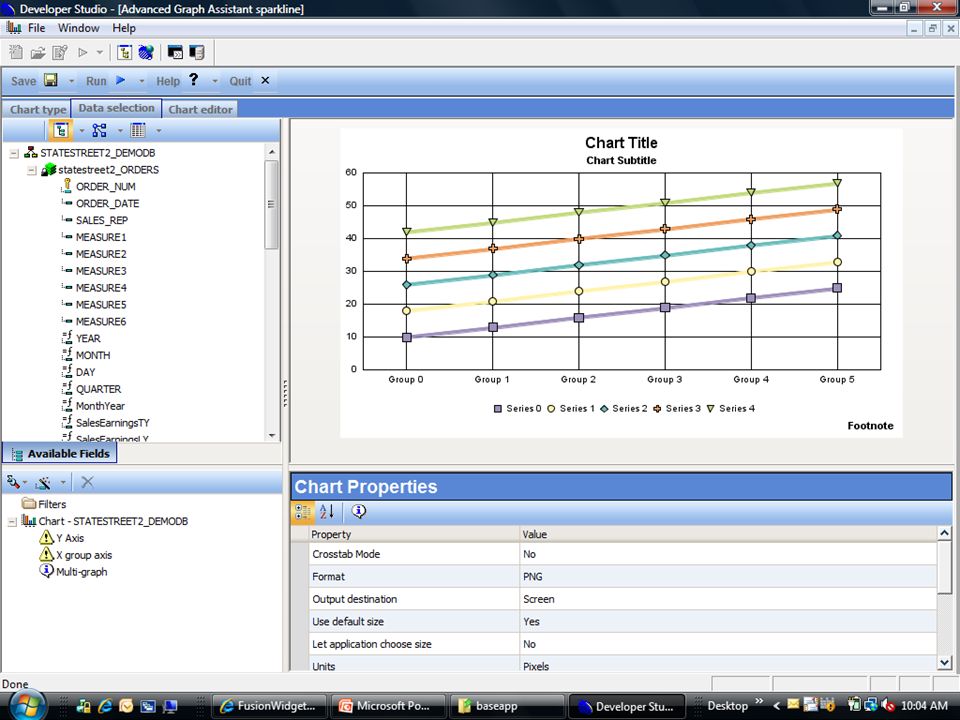
Topic 1 - Micrographs

4
What are they? Why use them? Is there training on them?

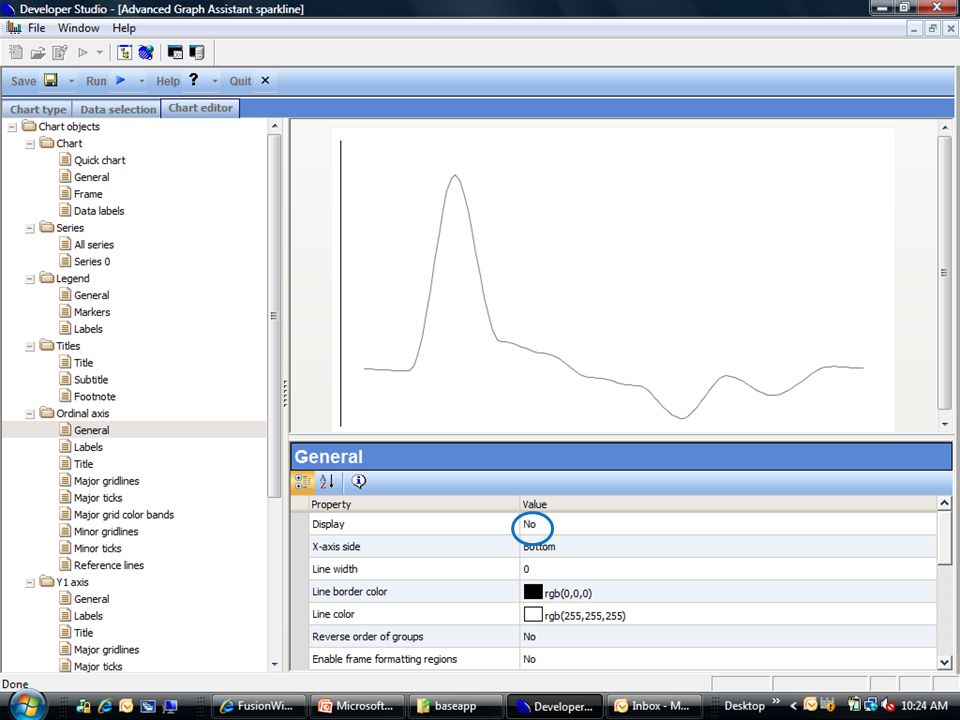
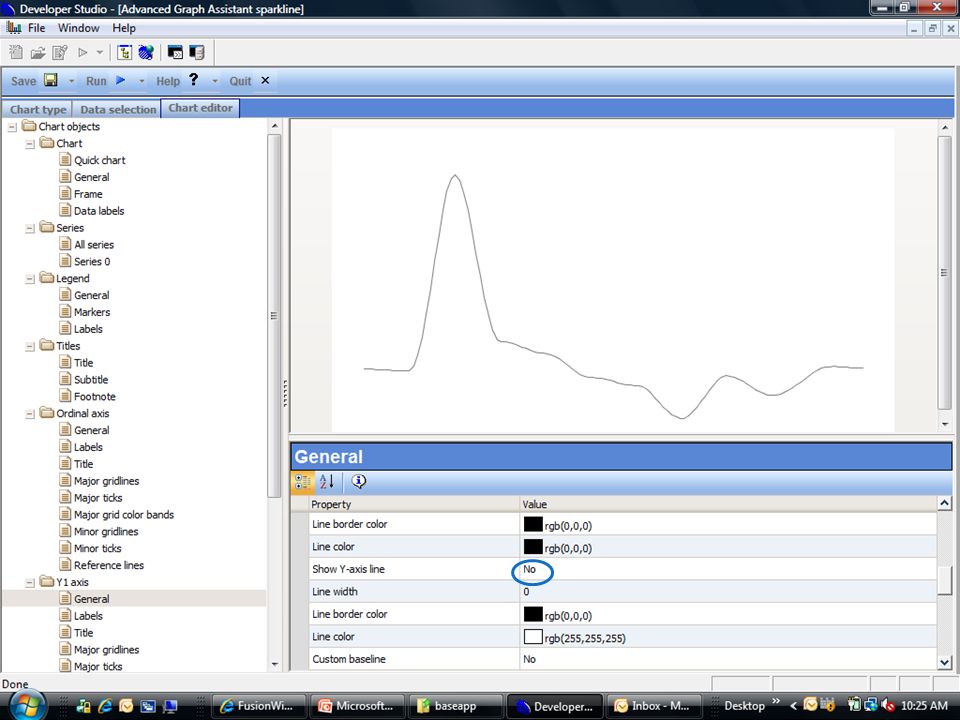
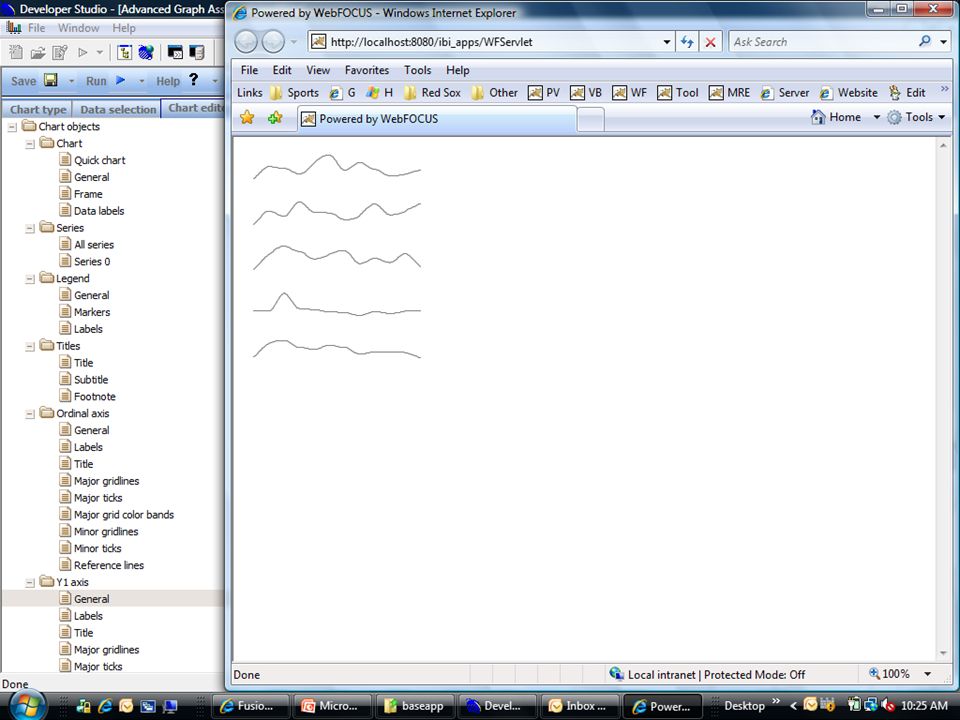
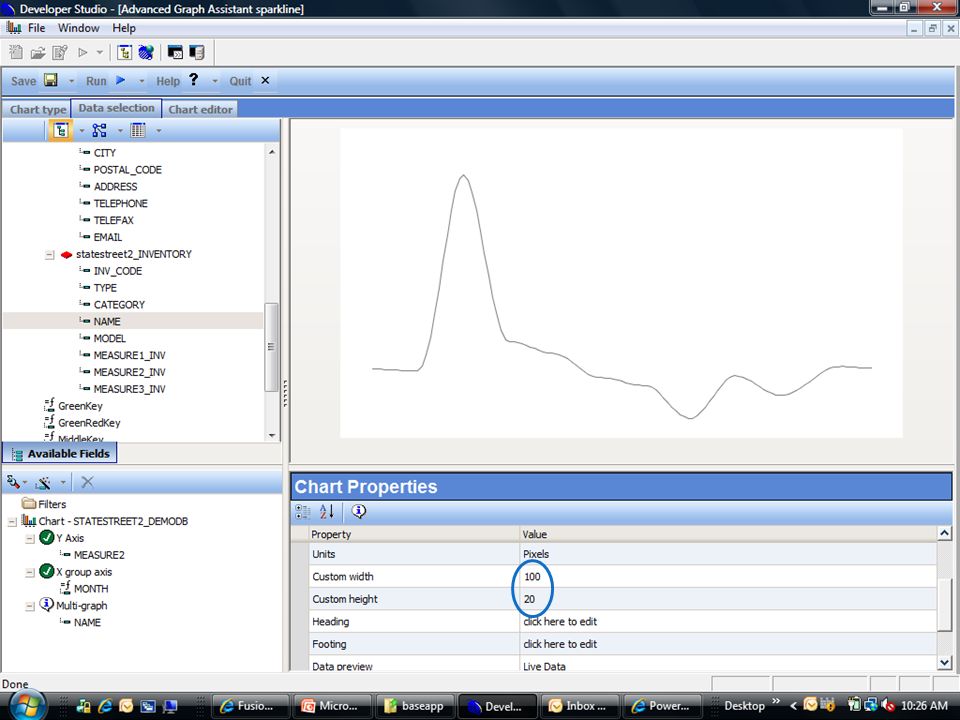
5
What are other people doing with them? http://www.bonavistasystems.com/OnlineDemoReports.html http://www.fusioncharts.com/ http://www.fusioncharts.com/widgets/Gallery.asp
6
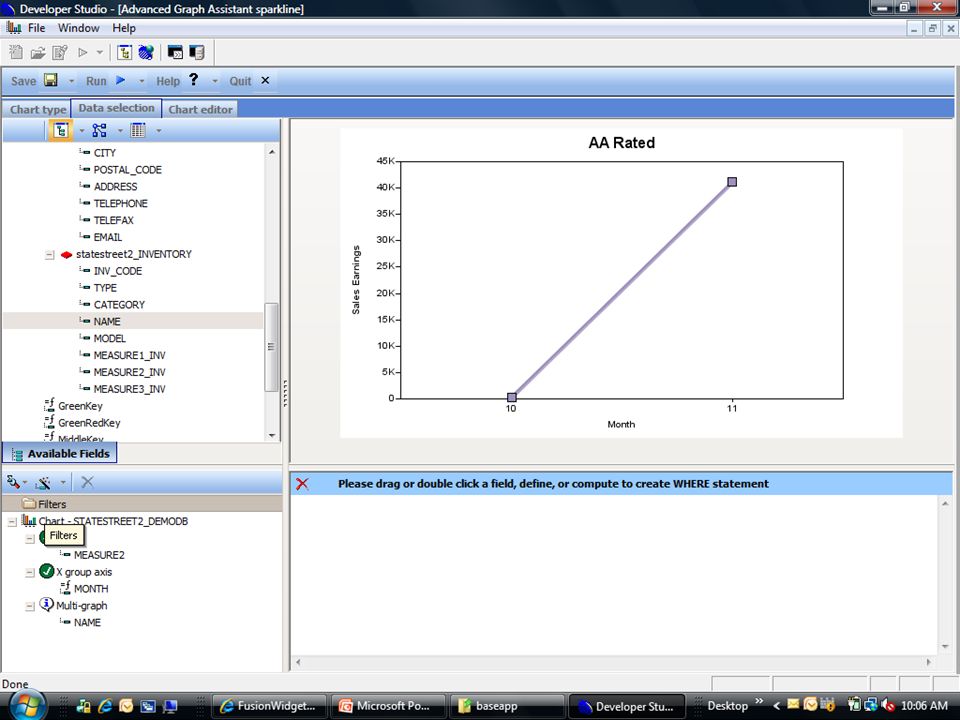
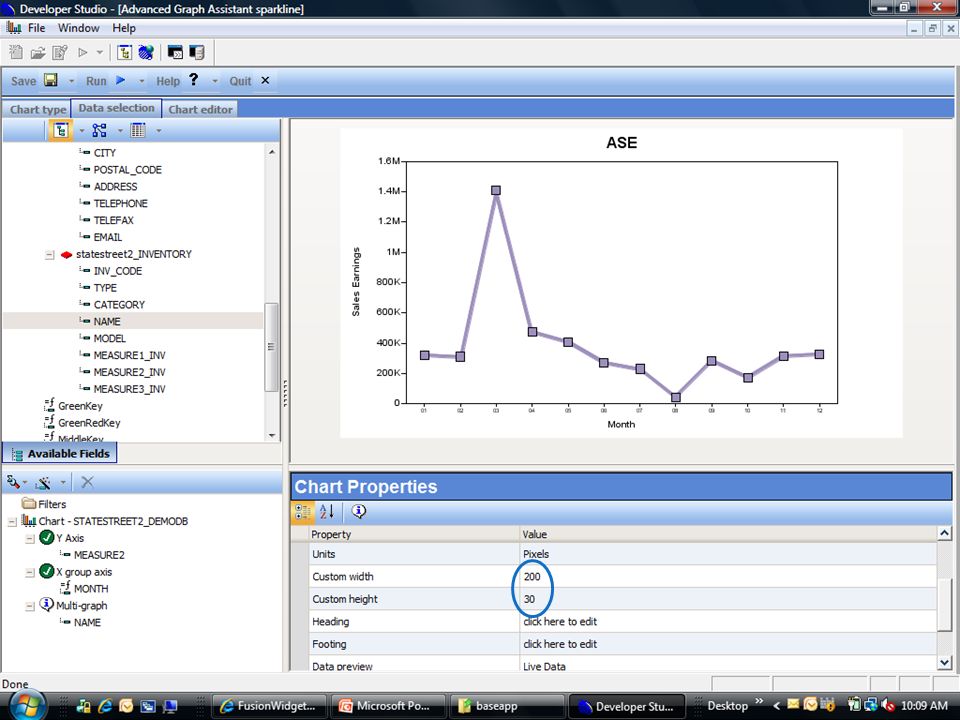
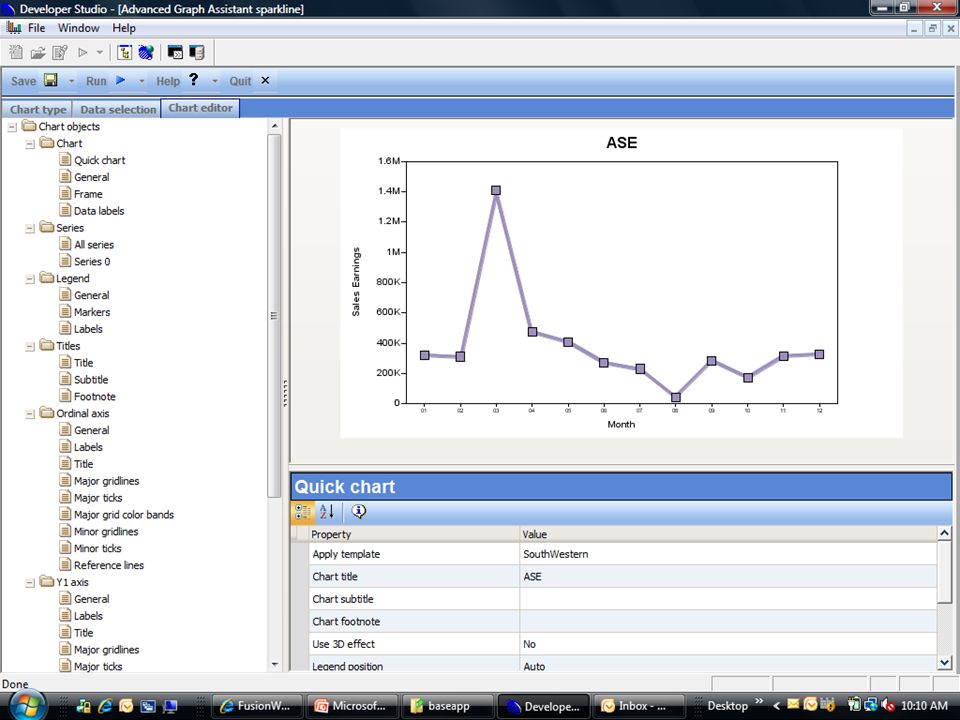
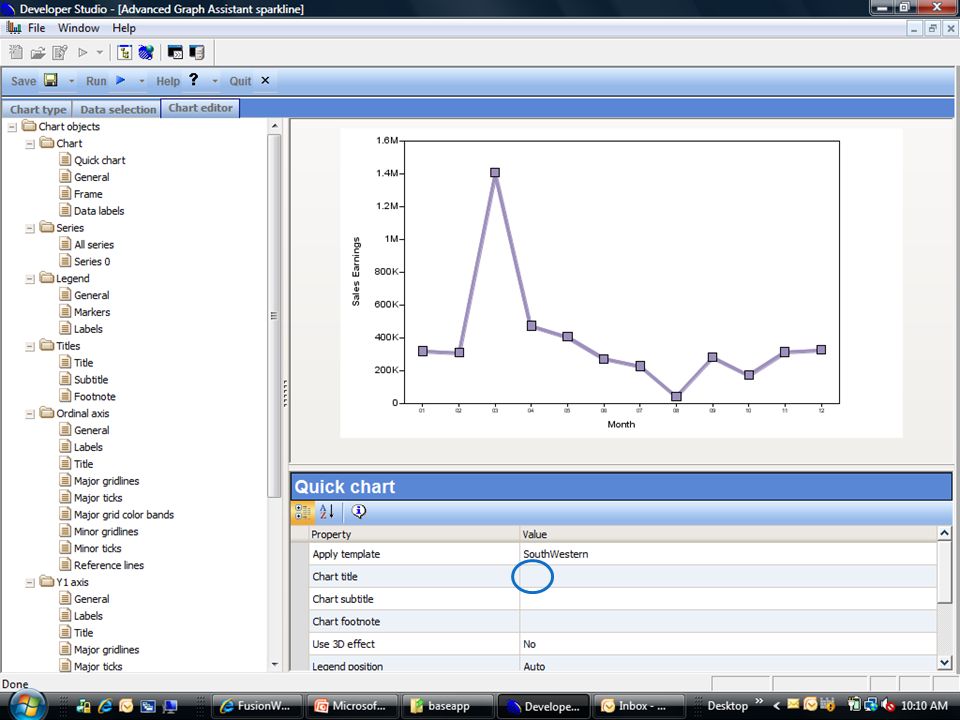
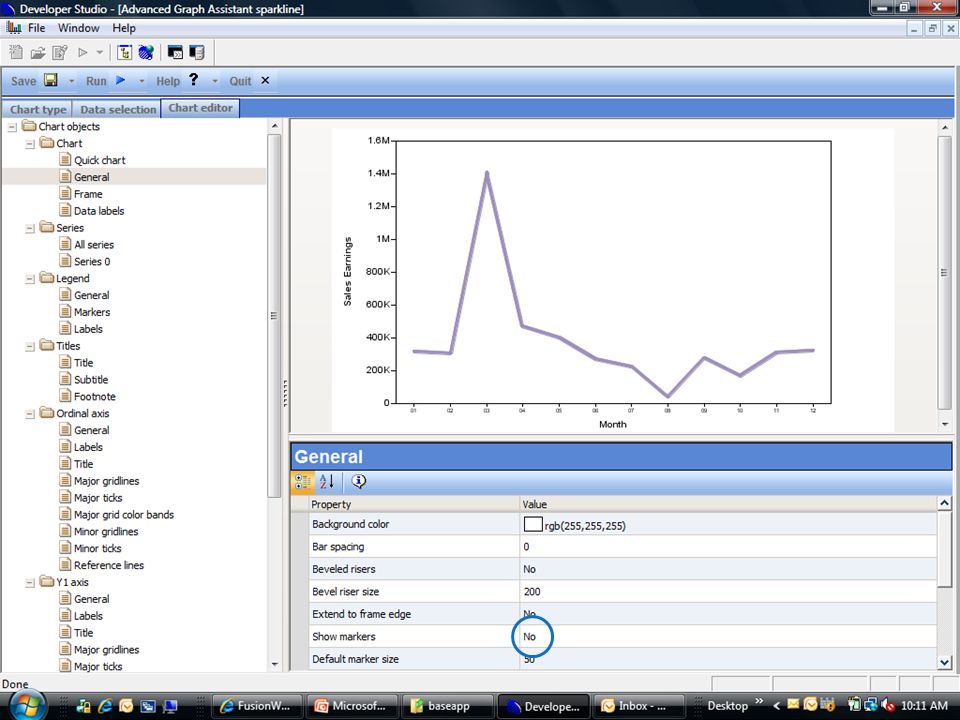
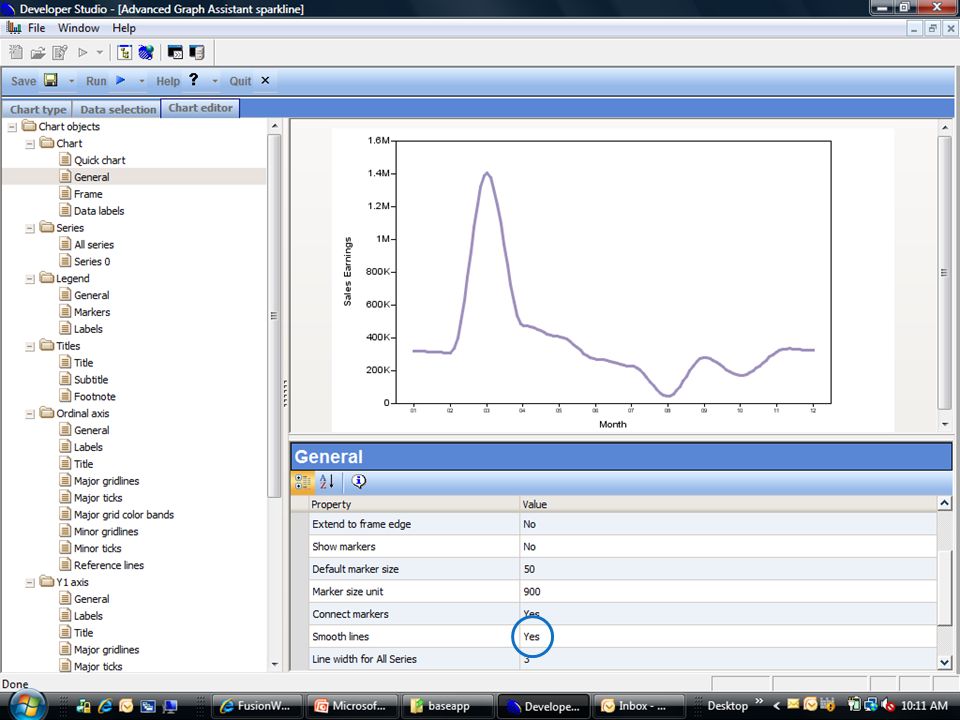
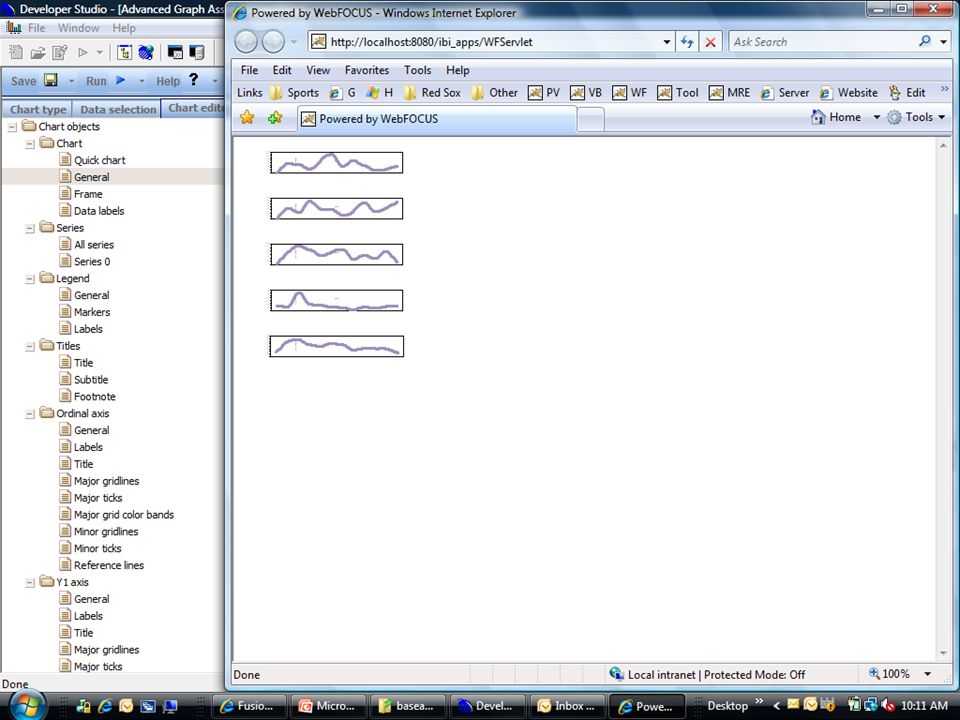
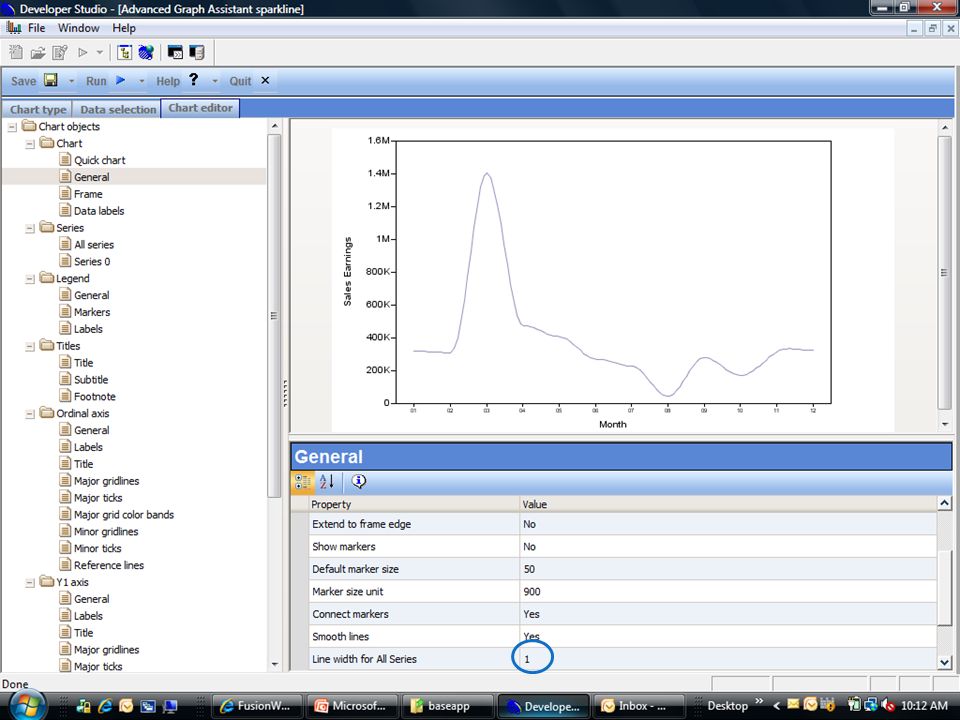
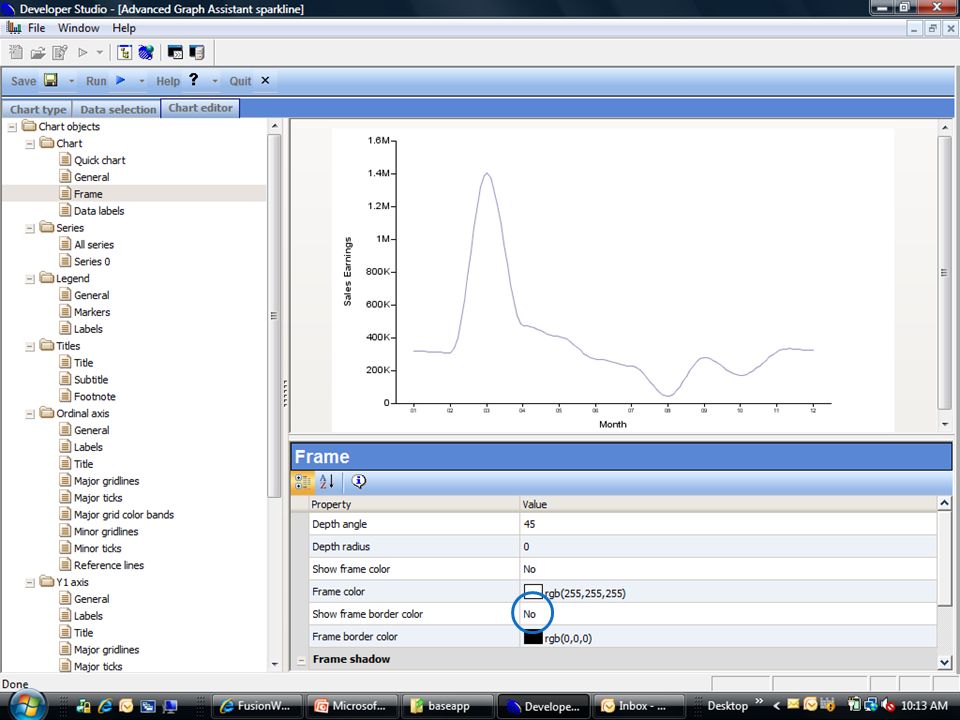
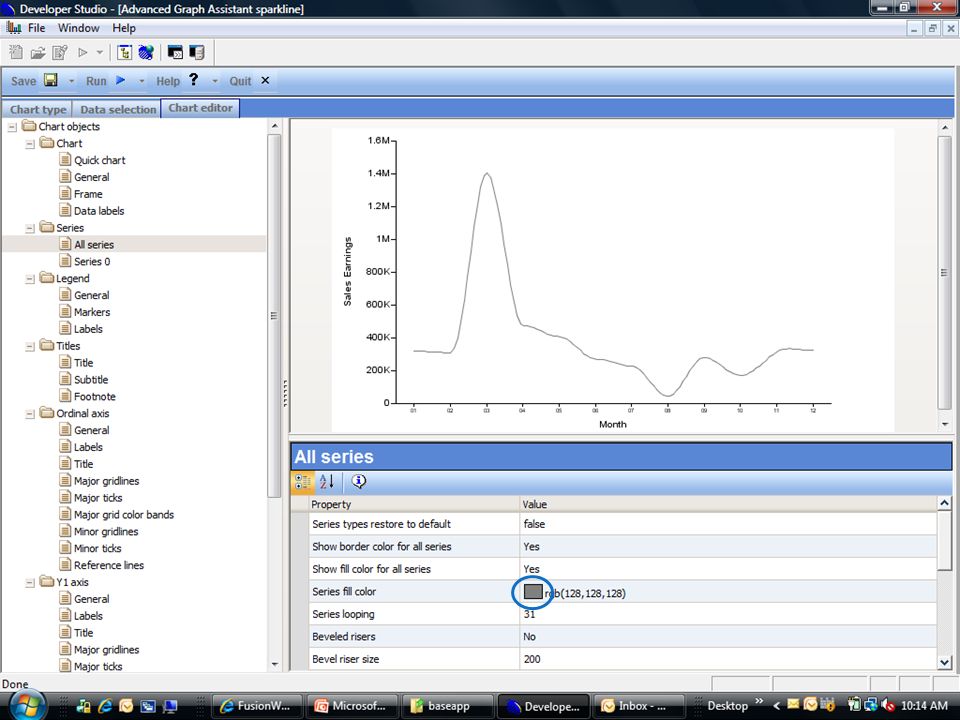
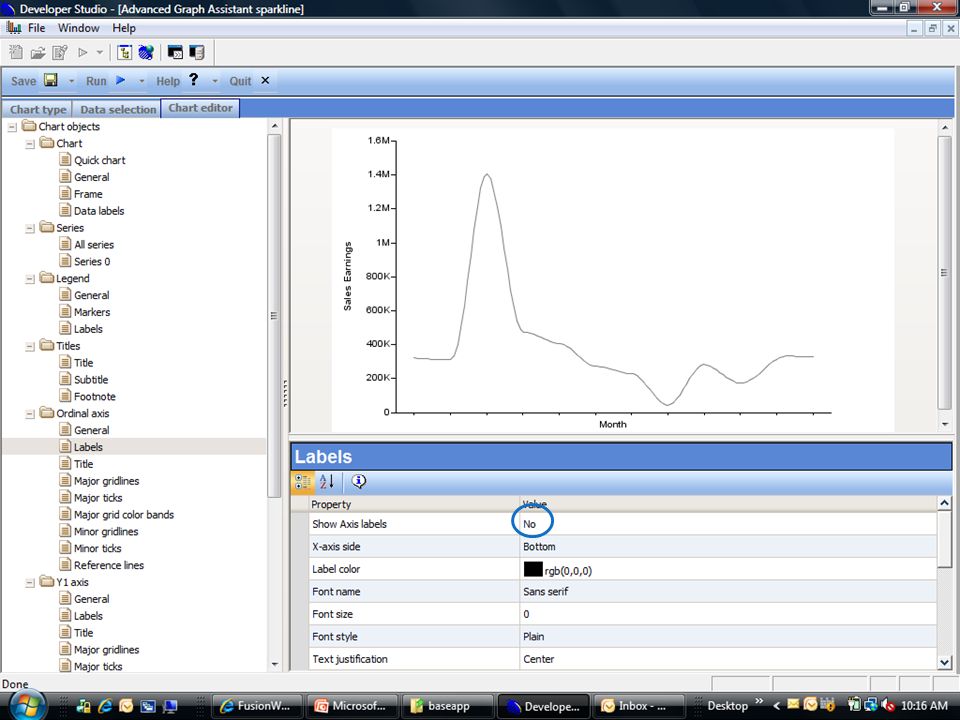
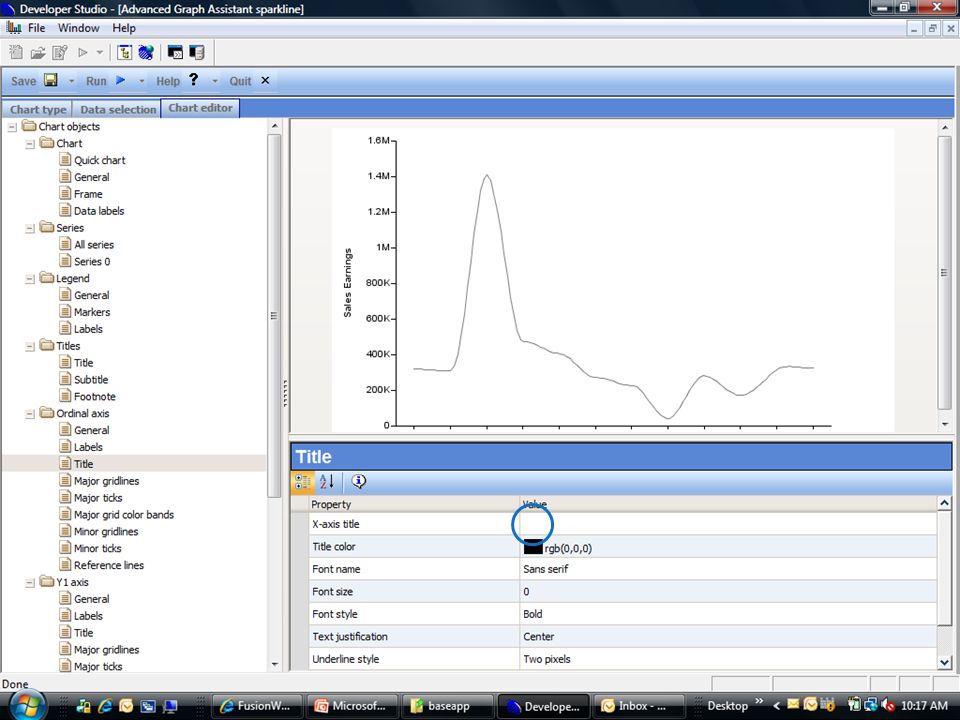
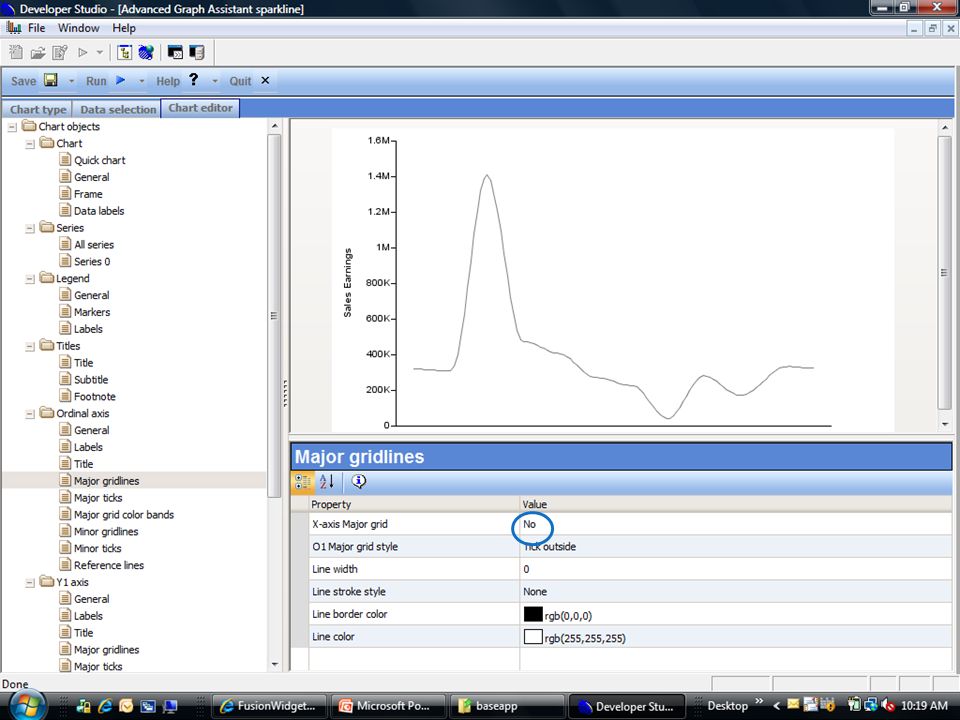
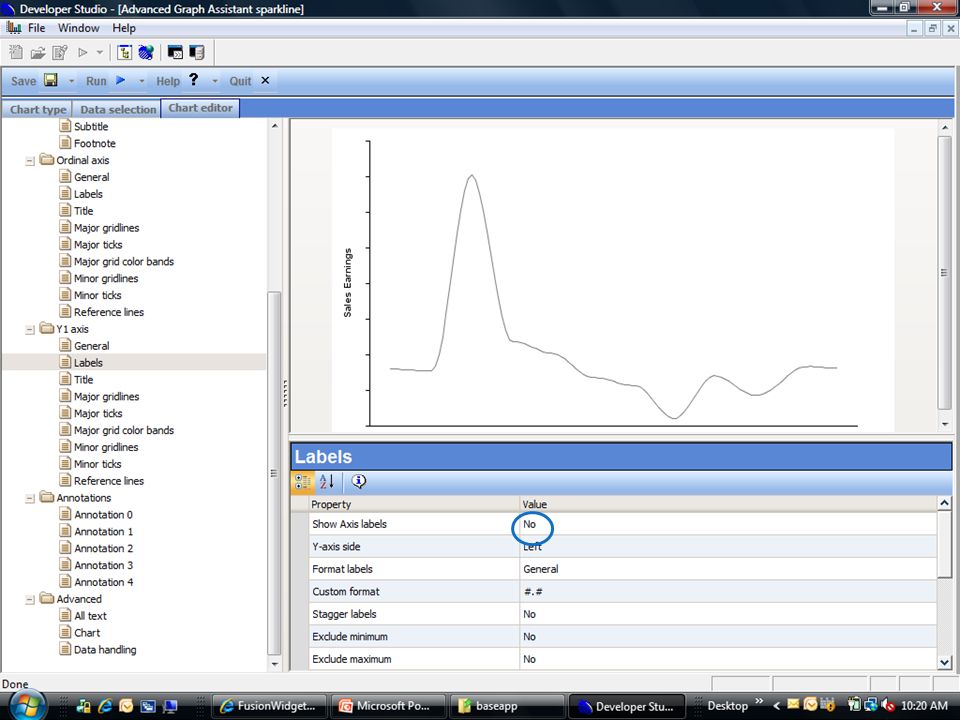
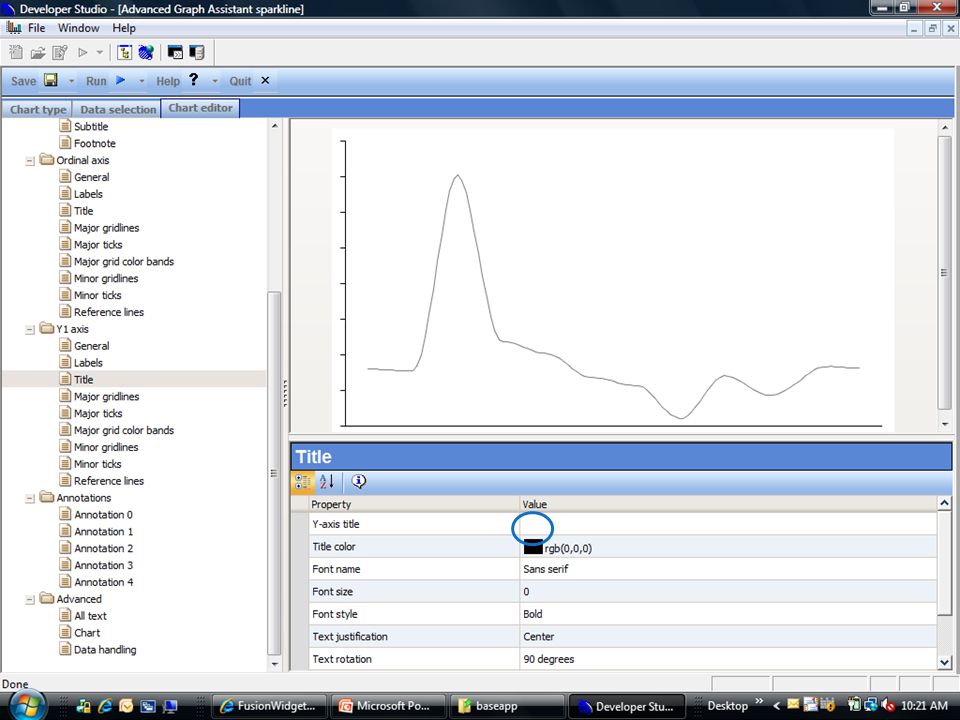
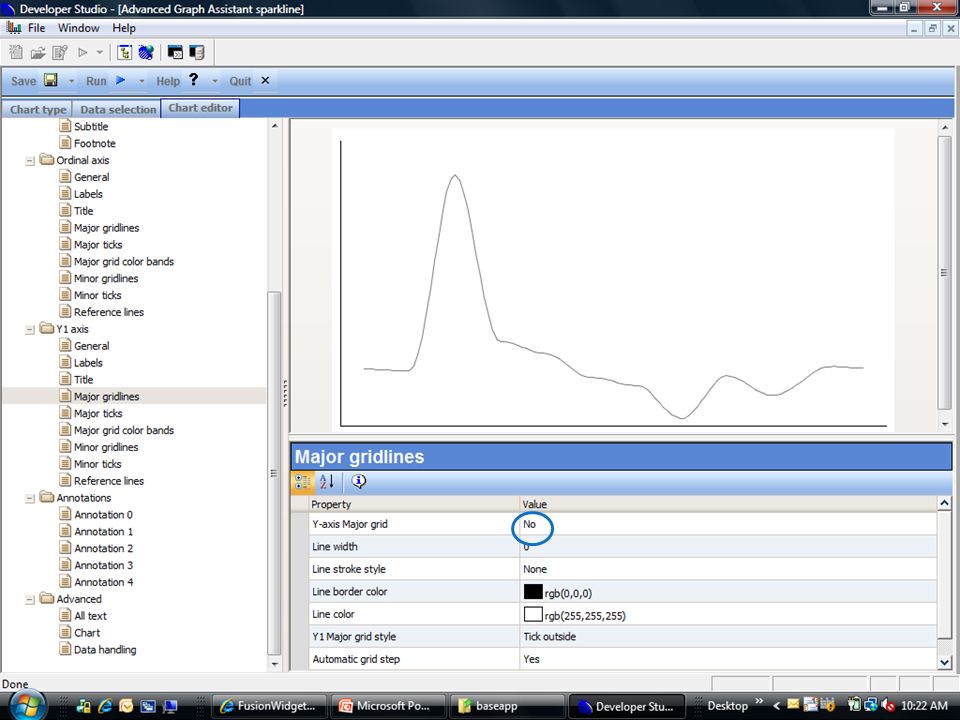
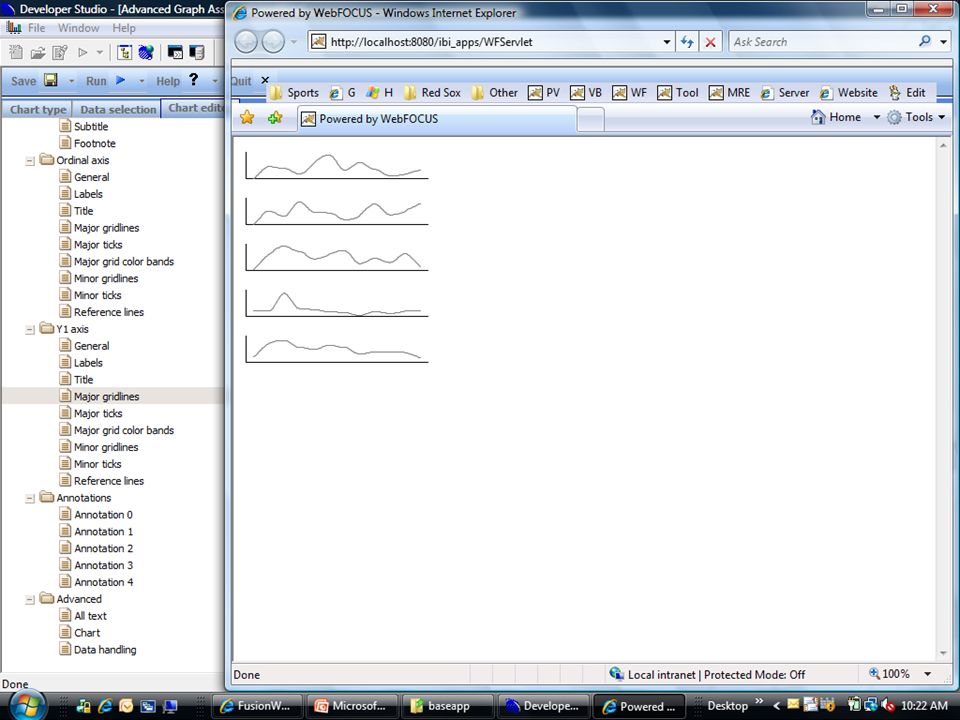
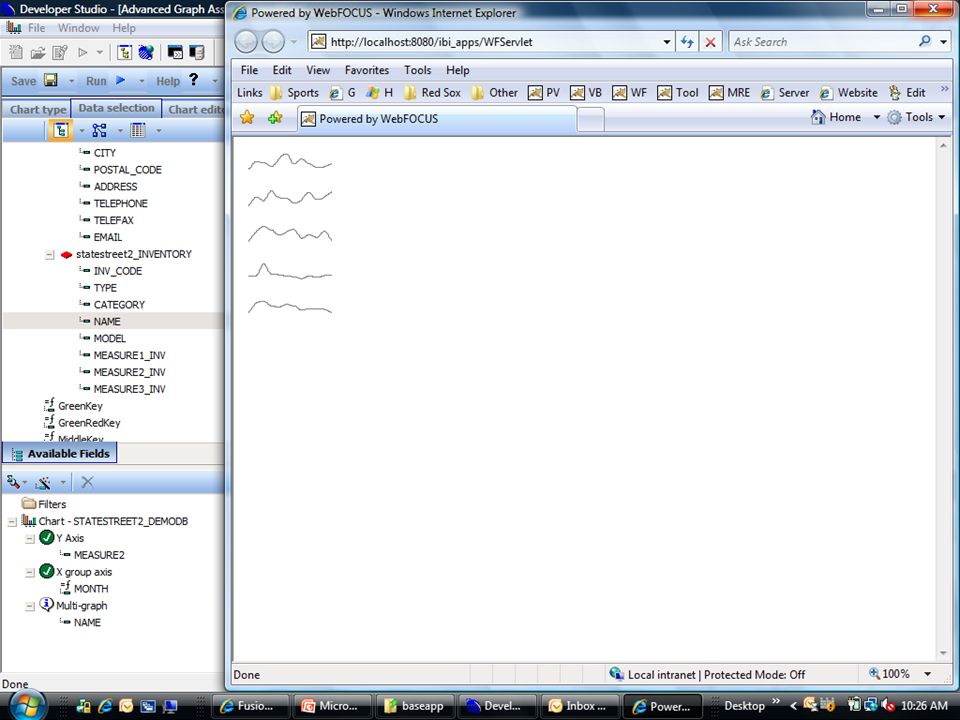
Sparkline A Sparkline is a type of information graphics characterized by its small size and data density. Sparklines present trends and variations associated with some measurement, such as average temperature or stock market activity, in a simple and condensed way. Several sparklines are often used together as elements of a small multiple. The term 'Sparkline' was proposed by Edward Tufte for "small, high resolution graphics embedded in a context of words, numbers, images." Tufte describes sparklines as "data-intense, design-simple, word-sized graphics".[1]. Whereas the typical chart is designed to show as much data as possible, and is set off from the flow of text (as in the box below), sparklines are intended to be succinct, memorable, and located where they are discussed. Sparklines used inline are typically made about the same height as the text around them.
, sparklines are intended to be succinct, memorable, and located where they are discussed. Sparklines used inline are typically made about the same height as the text around them..")
7
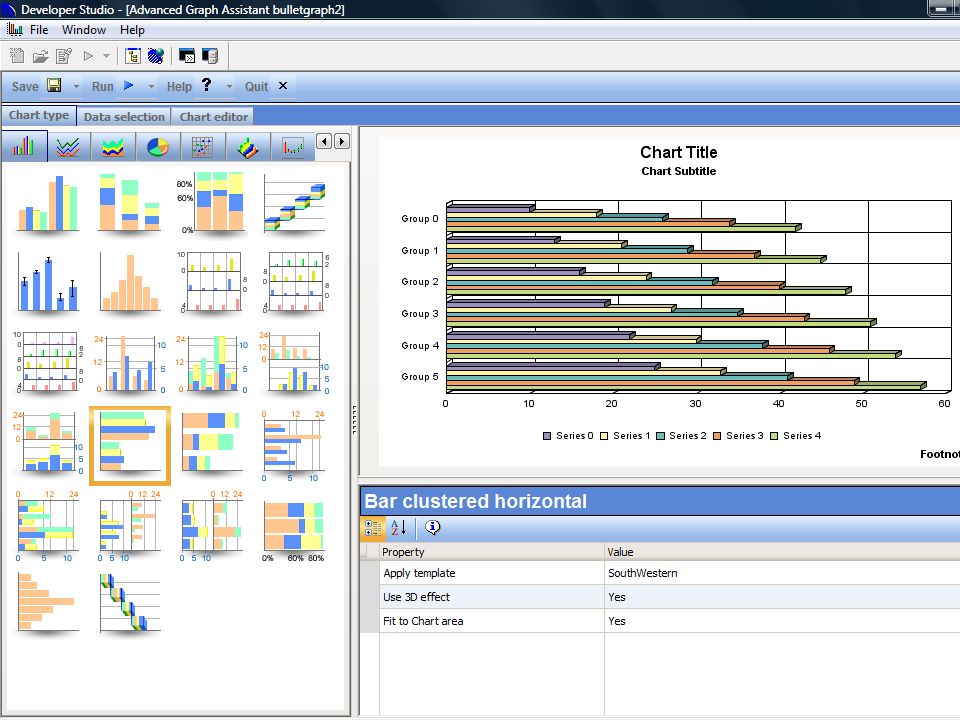
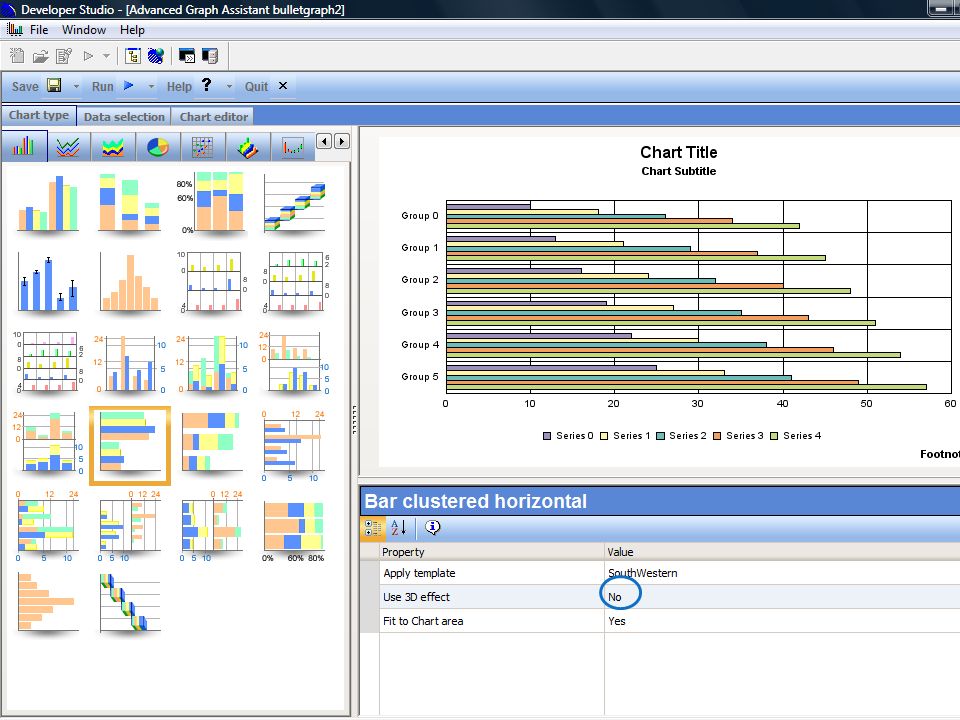
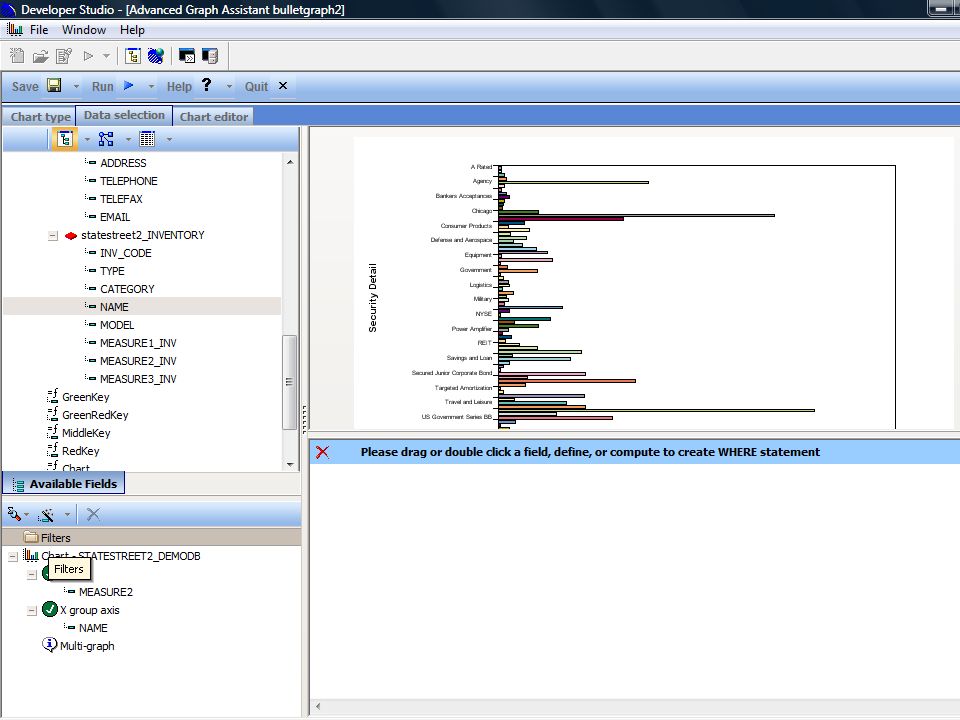
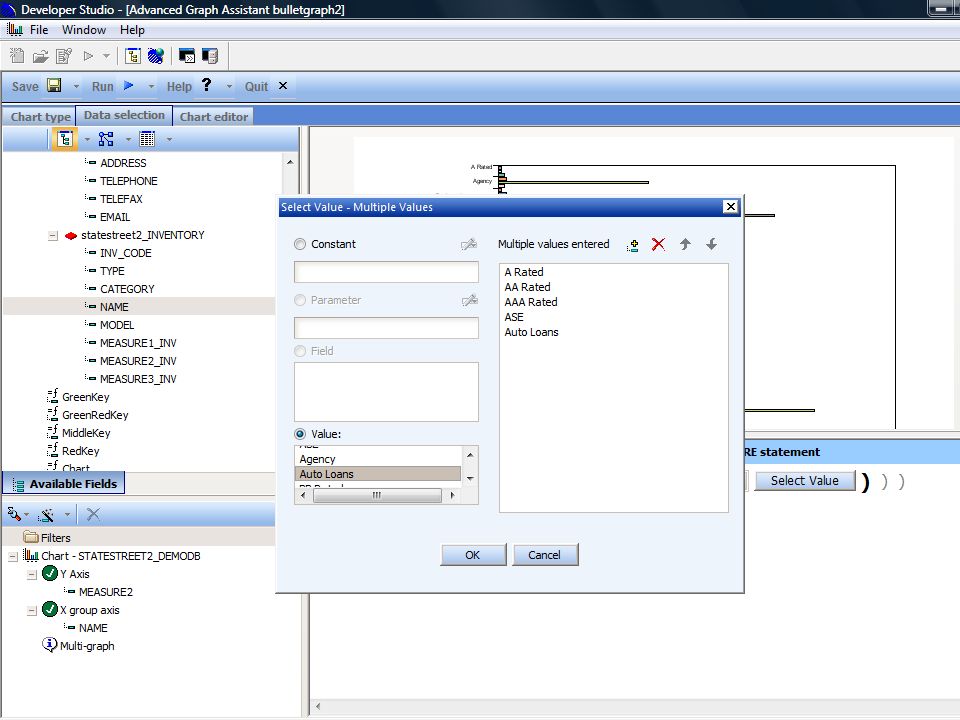
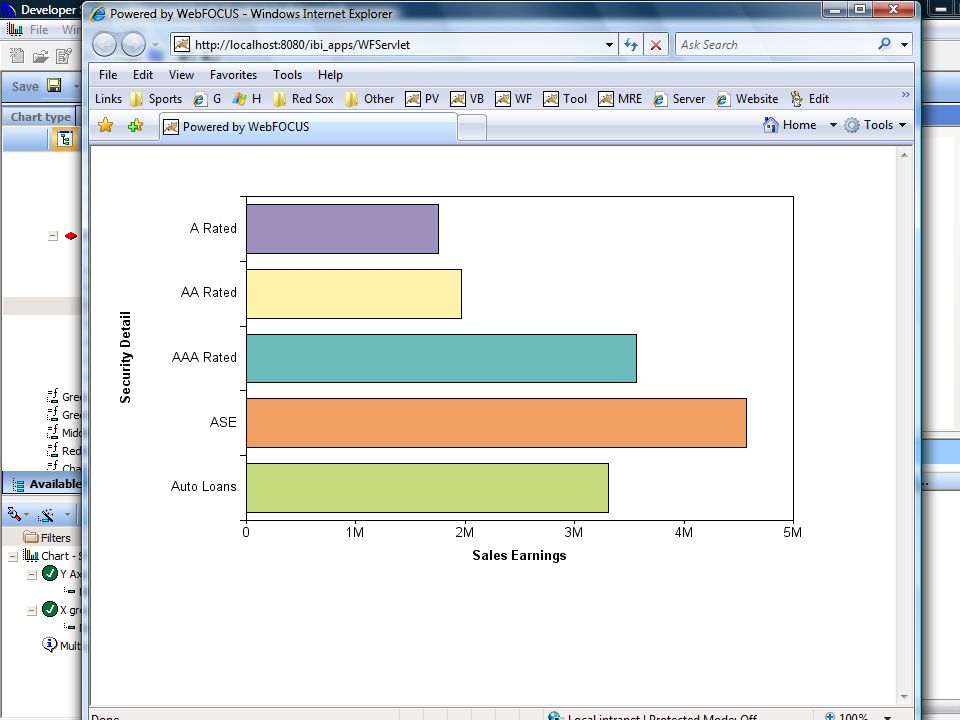
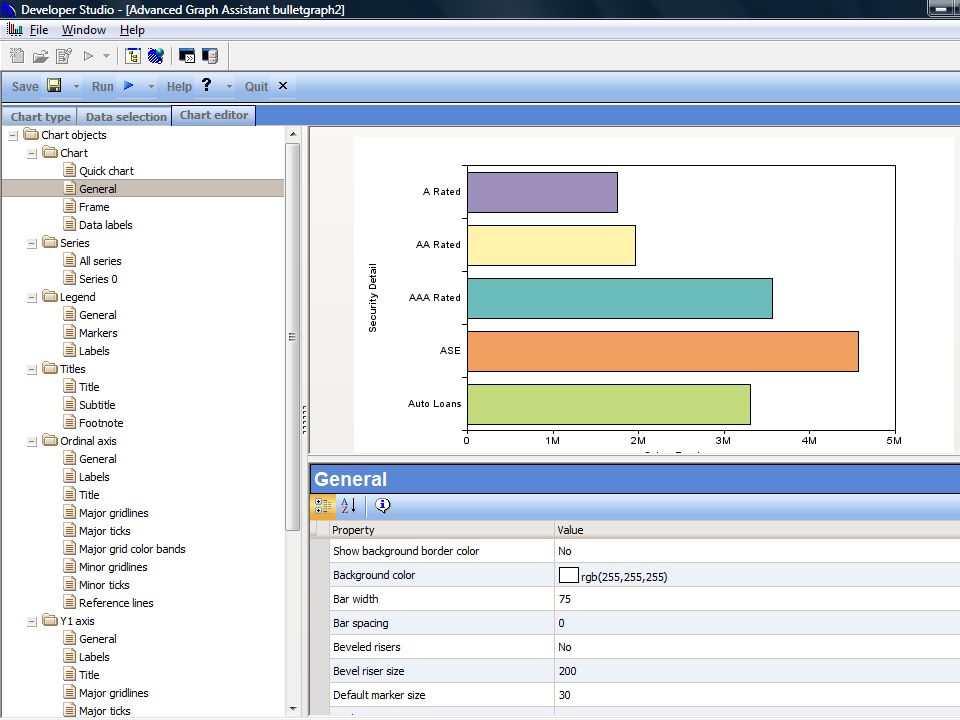
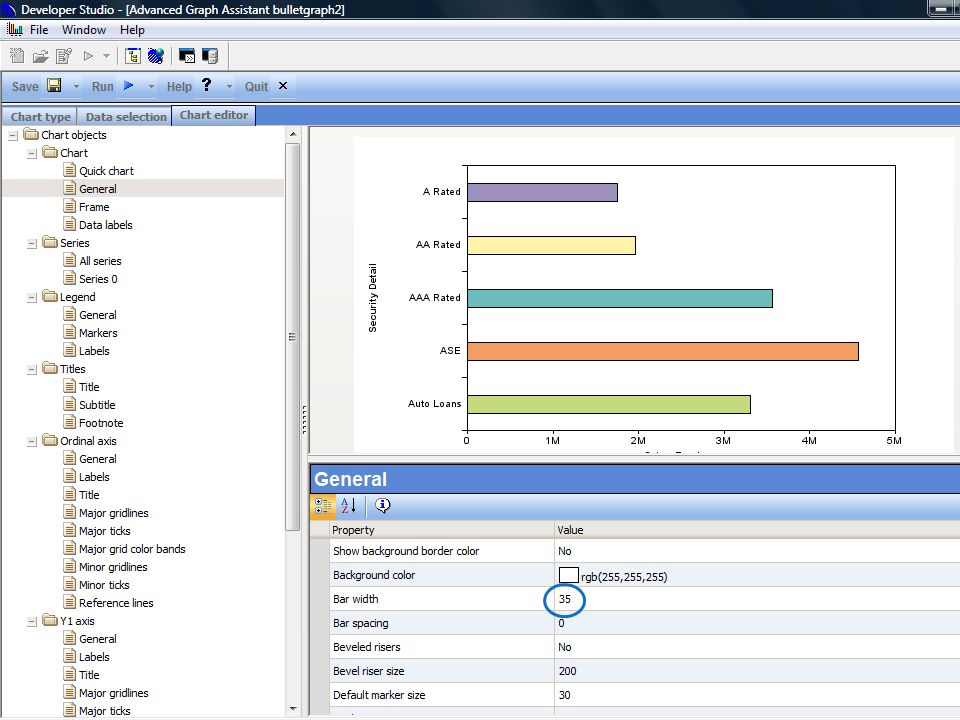
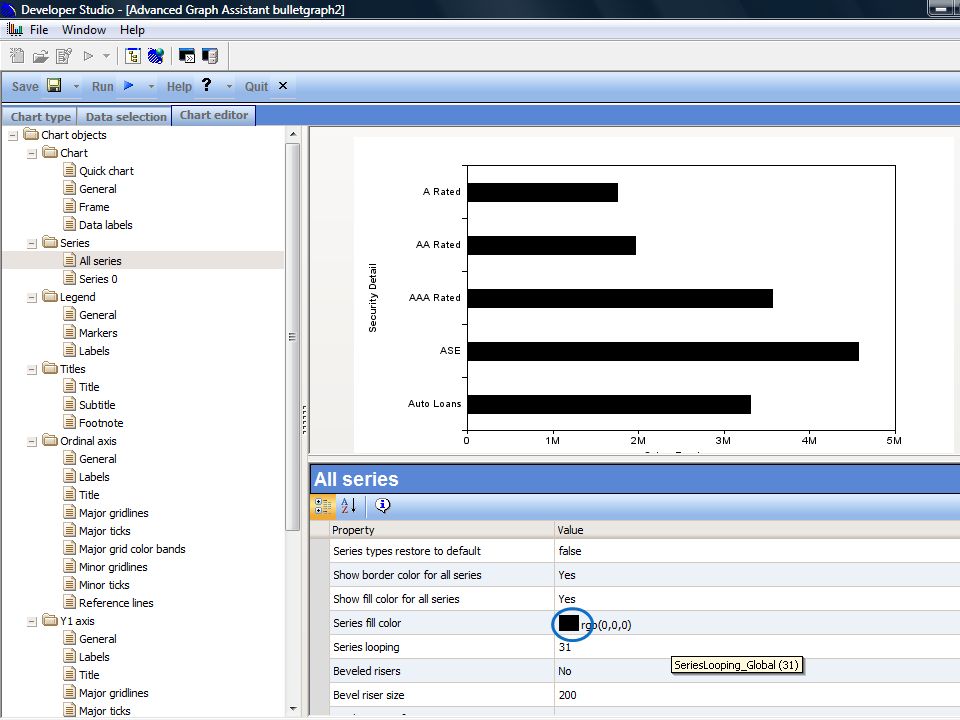
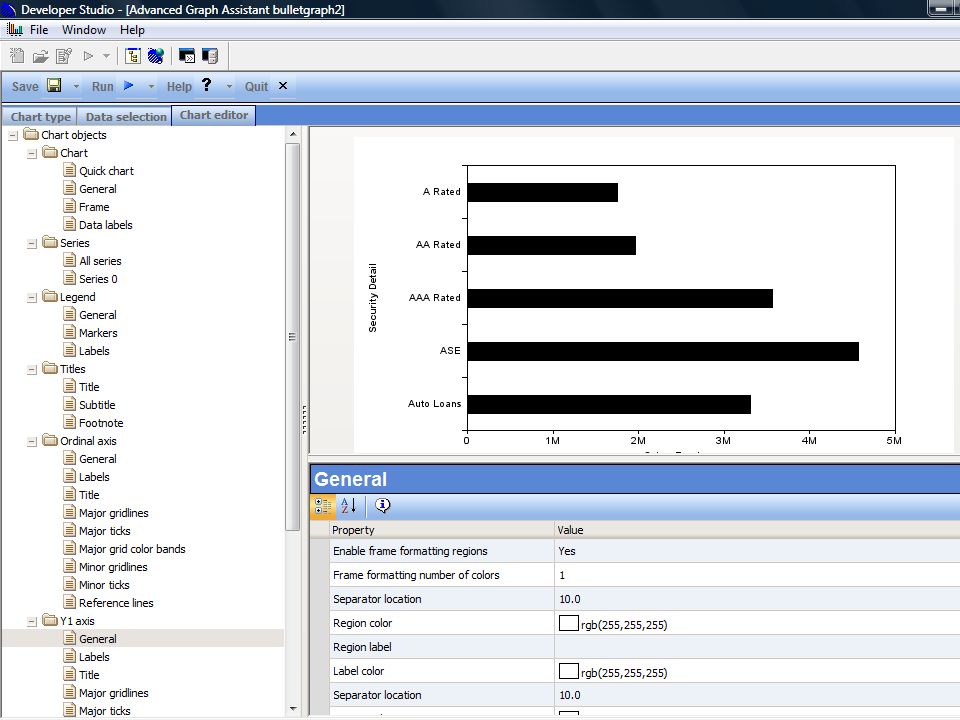
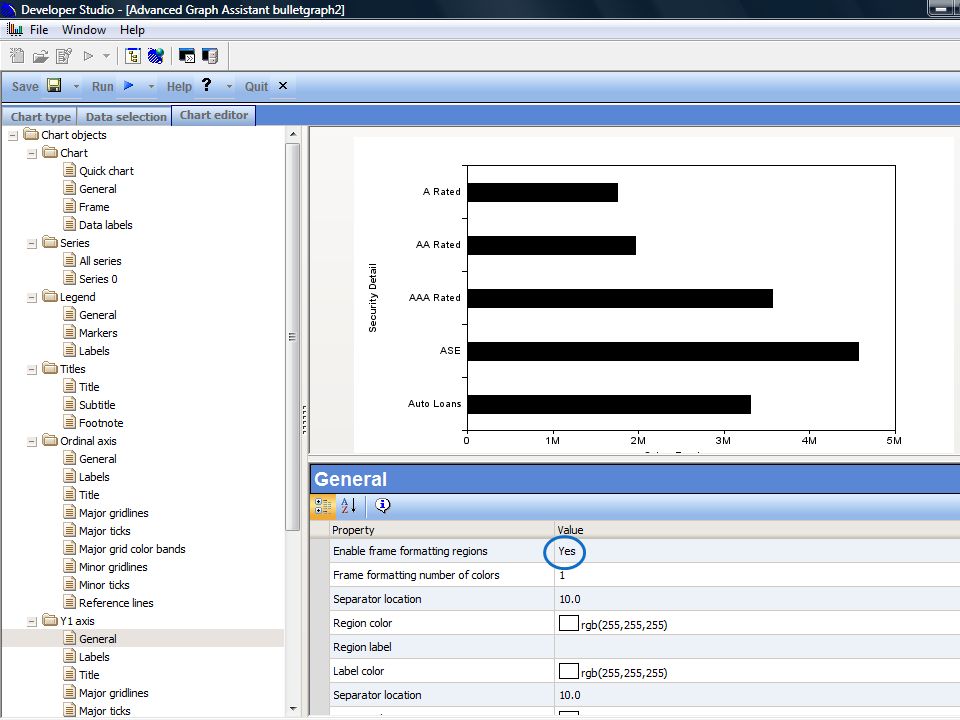
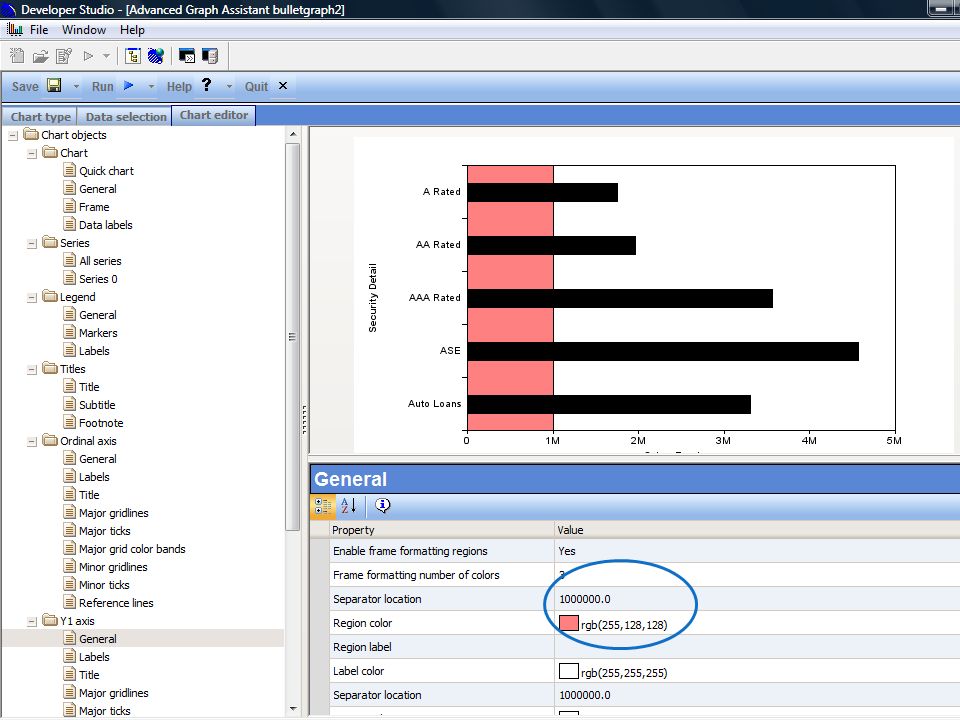
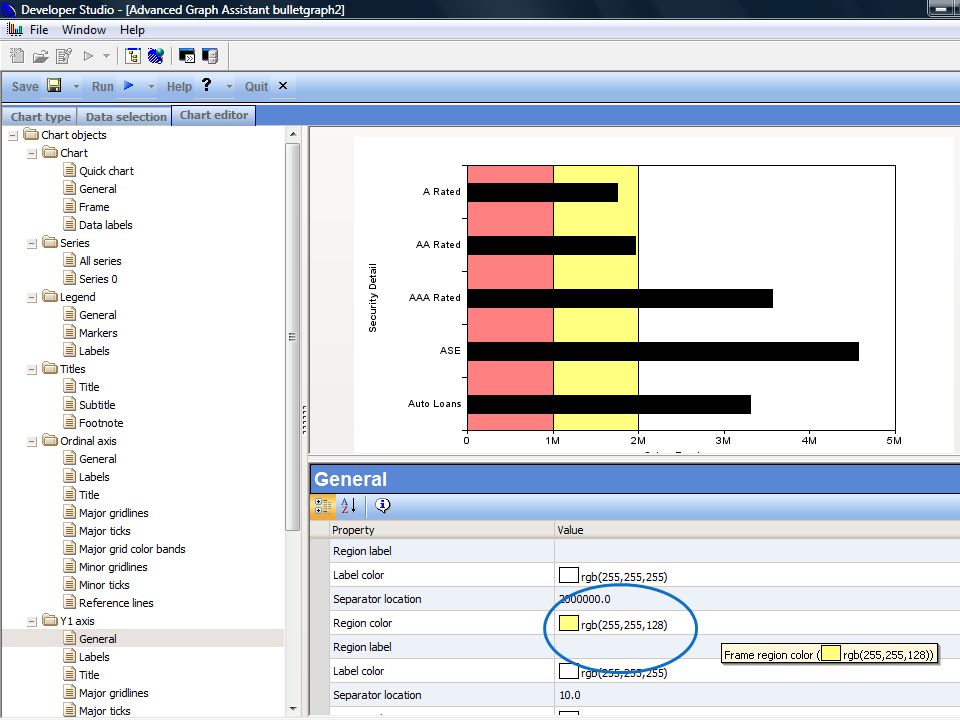
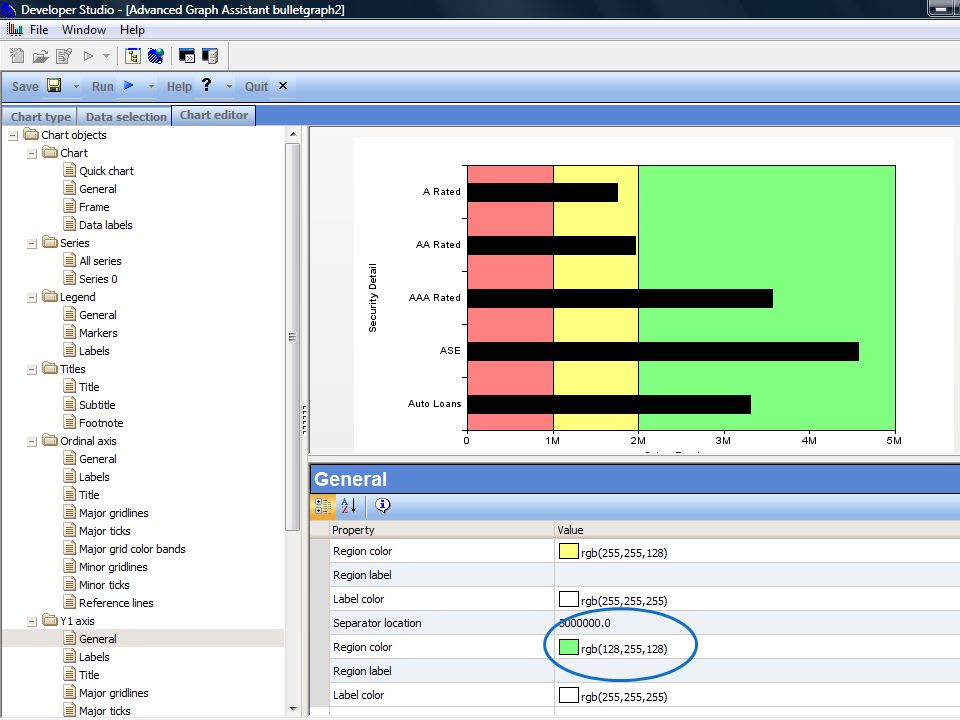
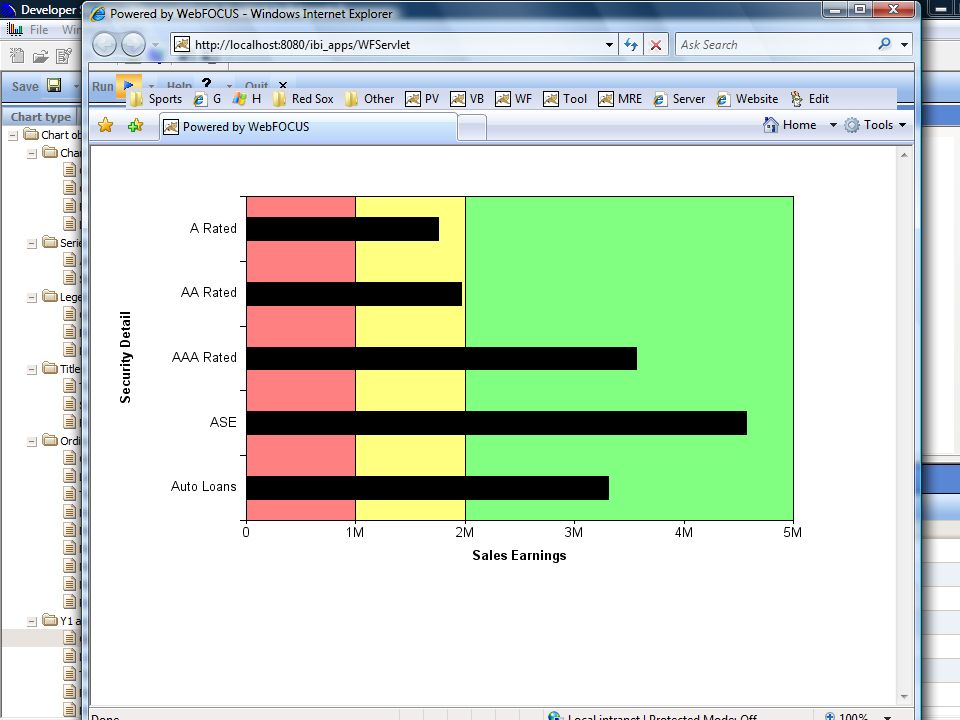
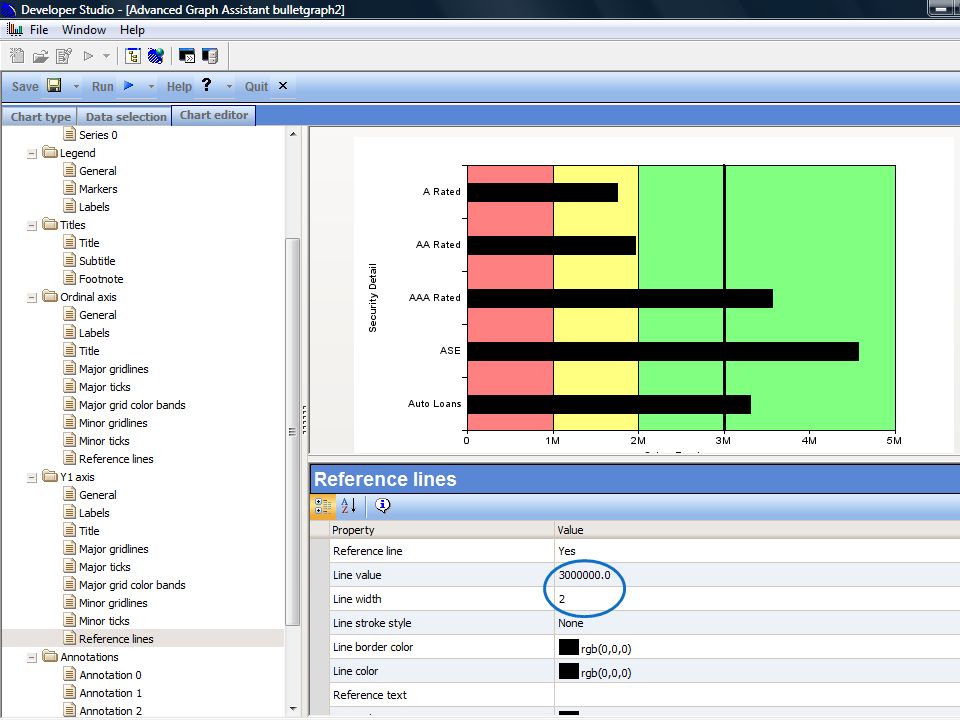
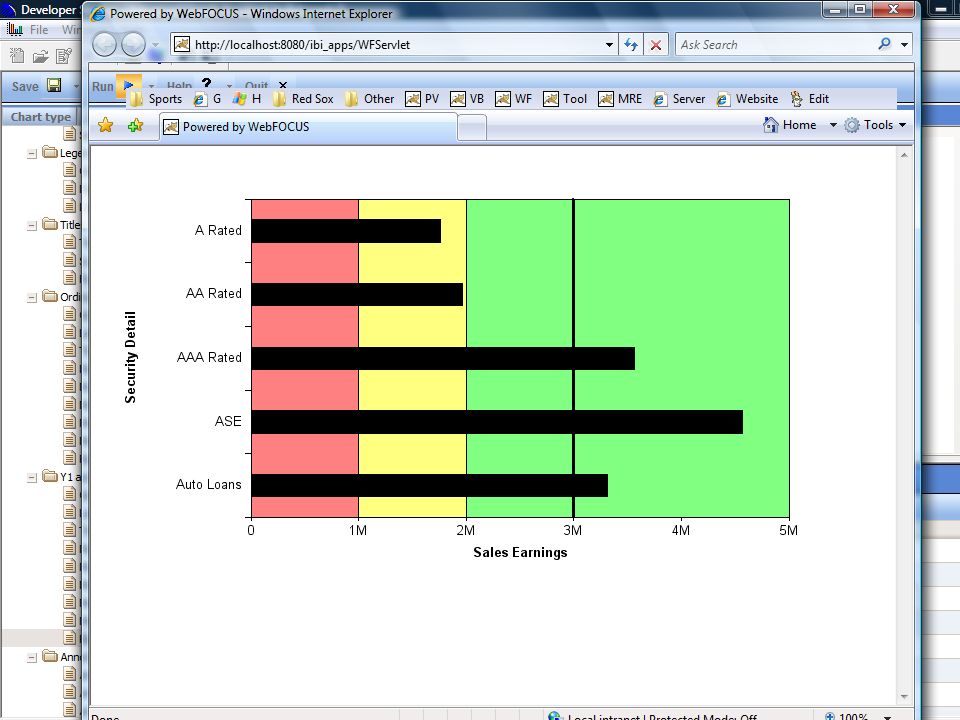
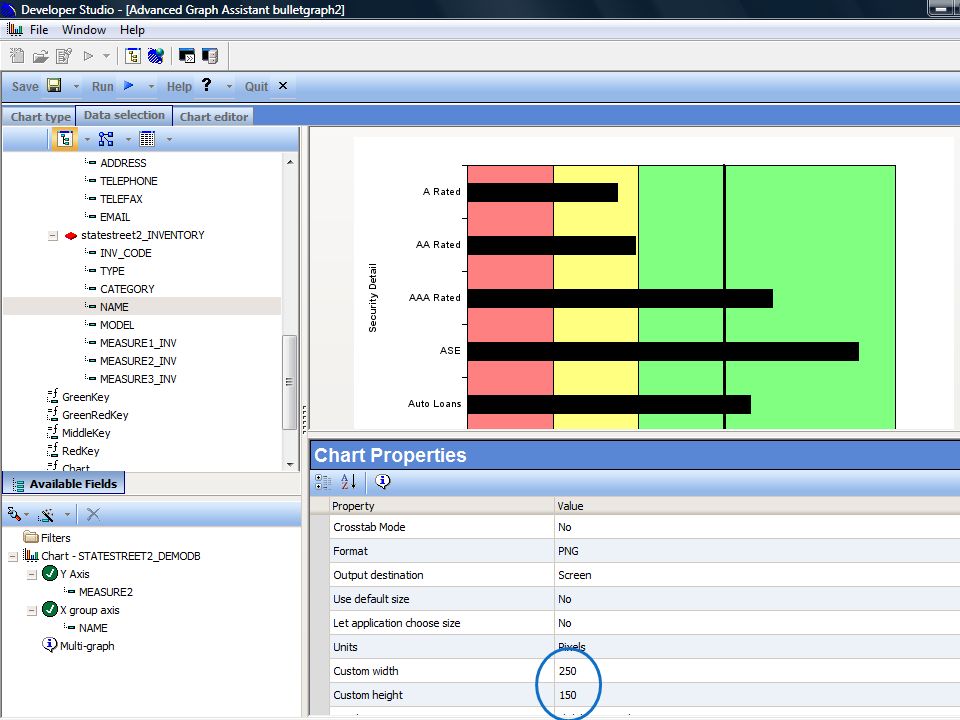
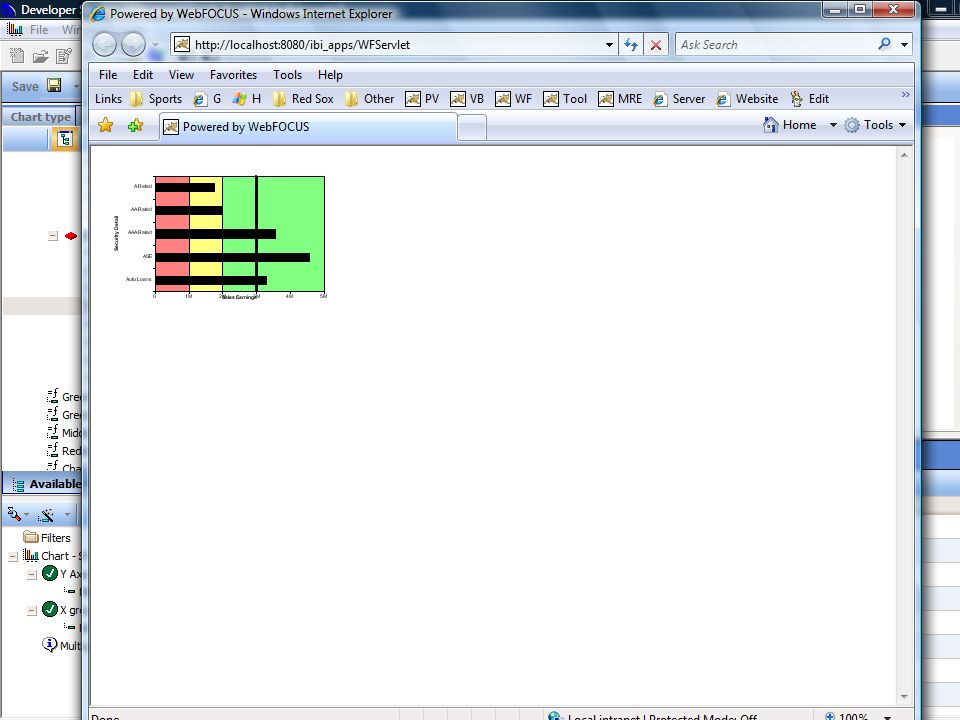
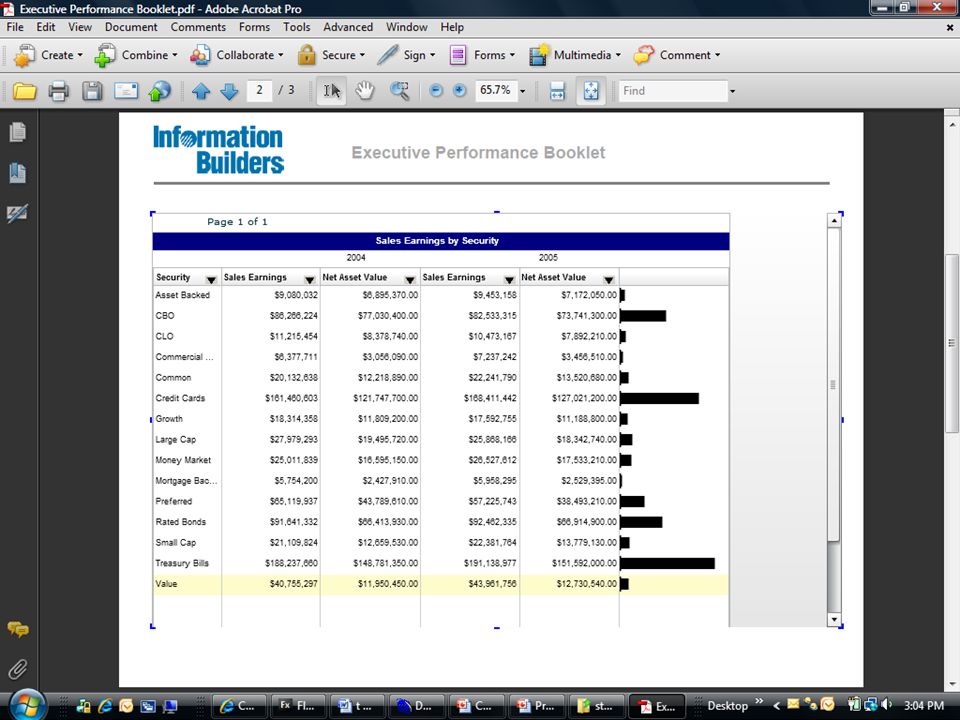
Bullet Graph A bullet graph is a variation of a bar graph developed by Stephen Few. Seemingly inspired by the traditional thermometer charts and progress bars found in many dashboards, the bullet graph serves as a replacement for dashboard gauges and meters. Few developed bullet graphs to overcome the fundamental issues of gauges and meters; they typically display too little information, require too much space, and are cluttered with useless and distracting decoration. The bullet graph features a single, primary measure (for example, current year-to-date revenue), compares that measure to one or more other measures to enrich its meaning (for example, compared to a target), and displays it in the context of qualitative ranges of performance, such as poor, satisfactory, and good. The qualitative ranges are displayed as varying intensities of a single hue to make them discernible by those who are color blind and to restrict the use of colors on the dashboard to a minimum.
, compares that measure to one or more other measures to enrich its meaning (for example, compared to a target), and displays it in the context of qualitative ranges of performance, such as poor, satisfactory, and good. The qualitative ranges are displayed as varying intensities of a single hue to make them discernible by those who are color blind and to restrict the use of colors on the dashboard to a minimum..")
40
Bullet Graphs

64
Provided materials Sparkline example Bullet Graph example Report with Sparkline example The app needed to create this example This PowerPoint

65
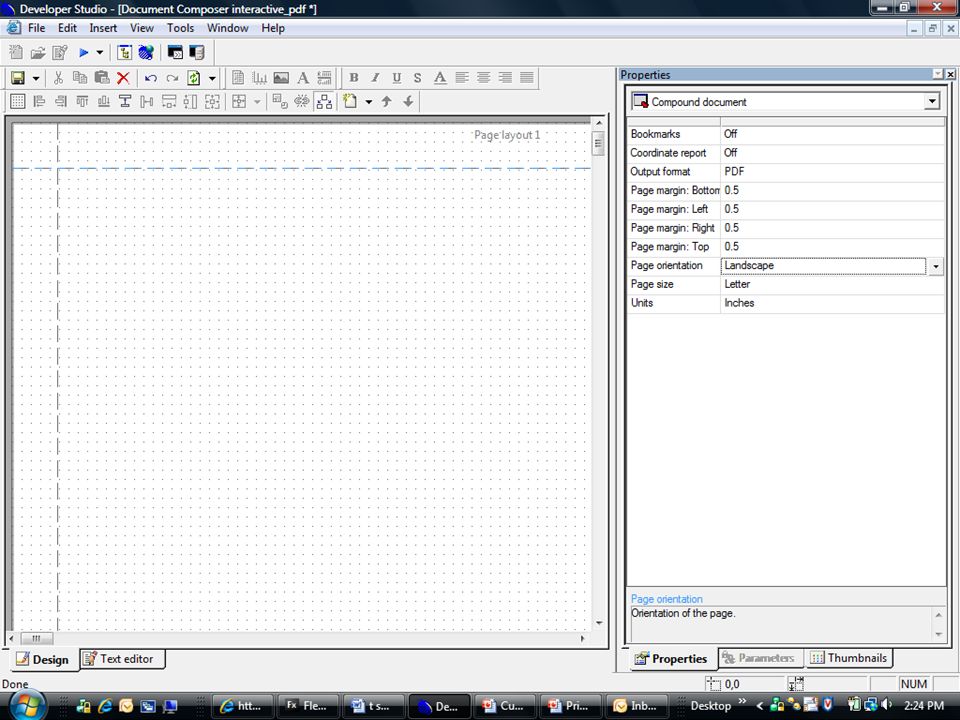
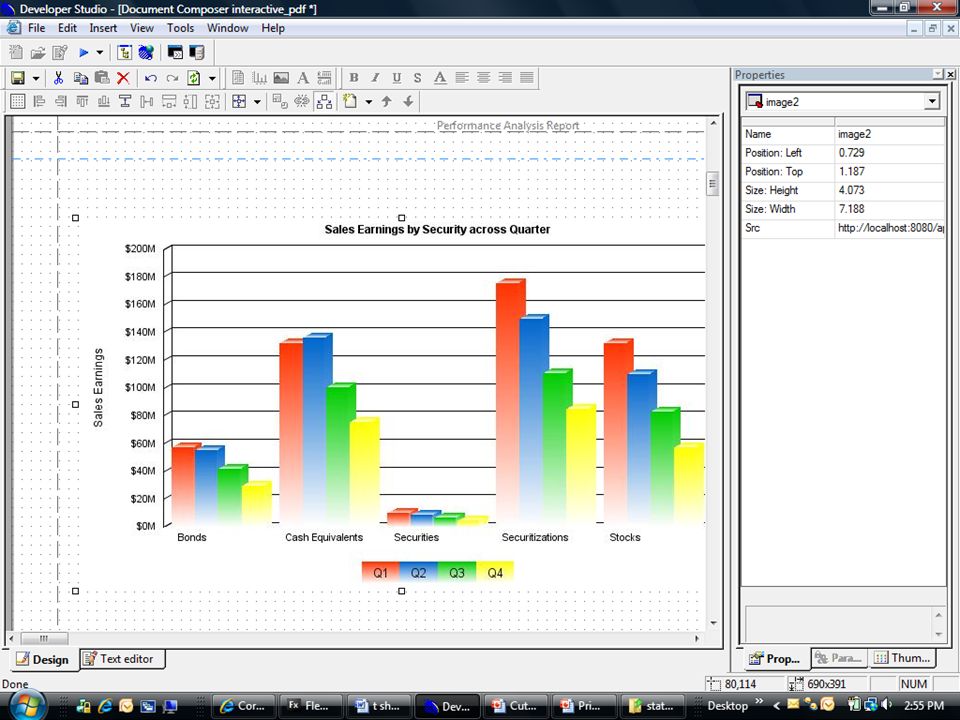
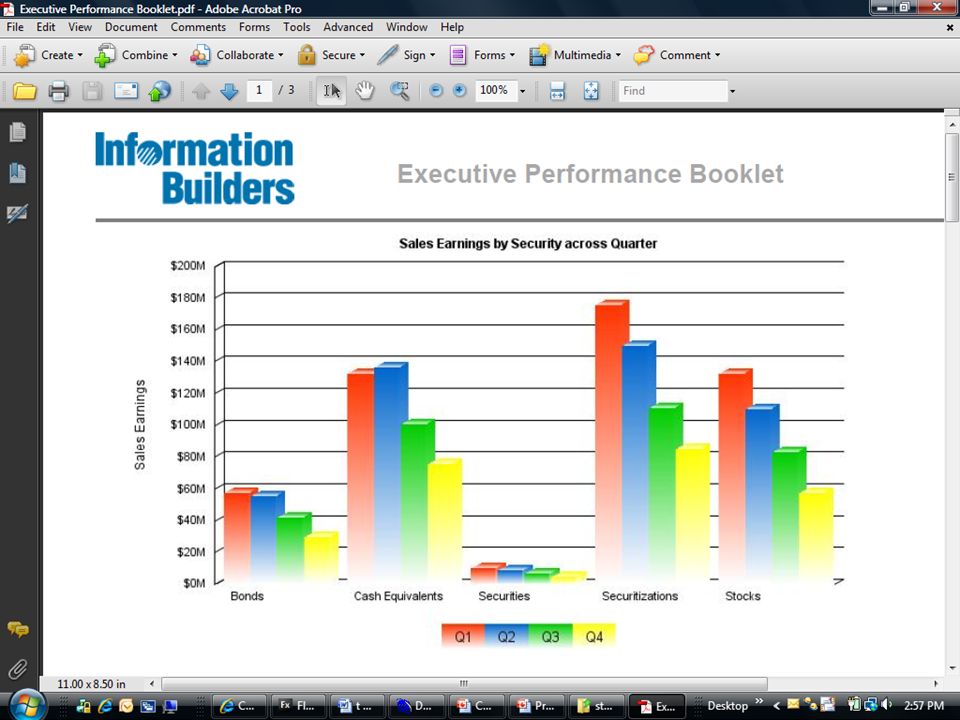
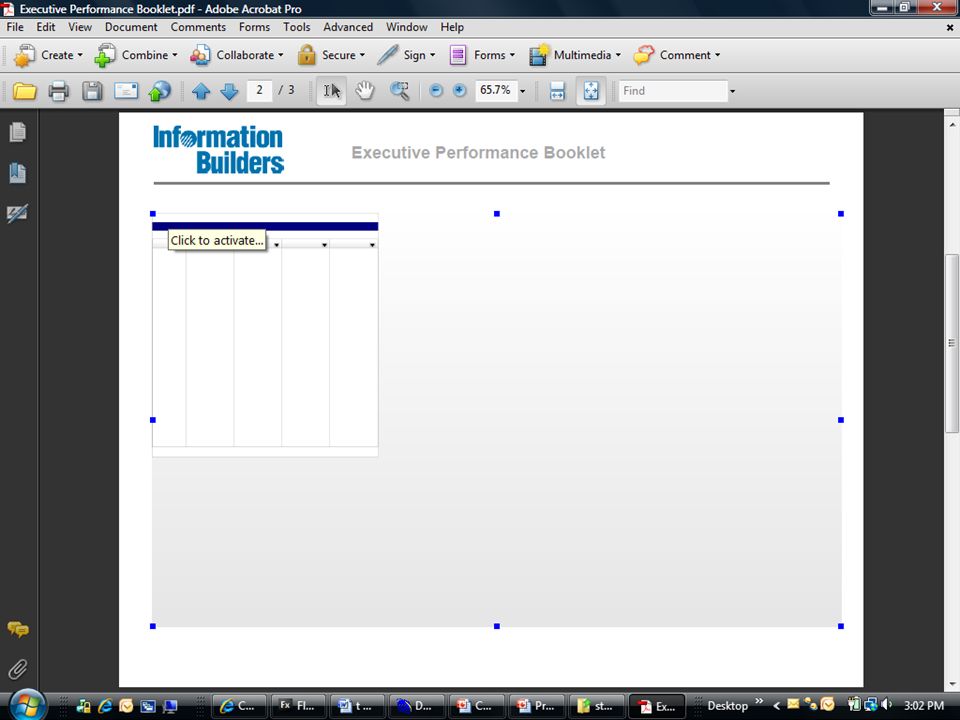
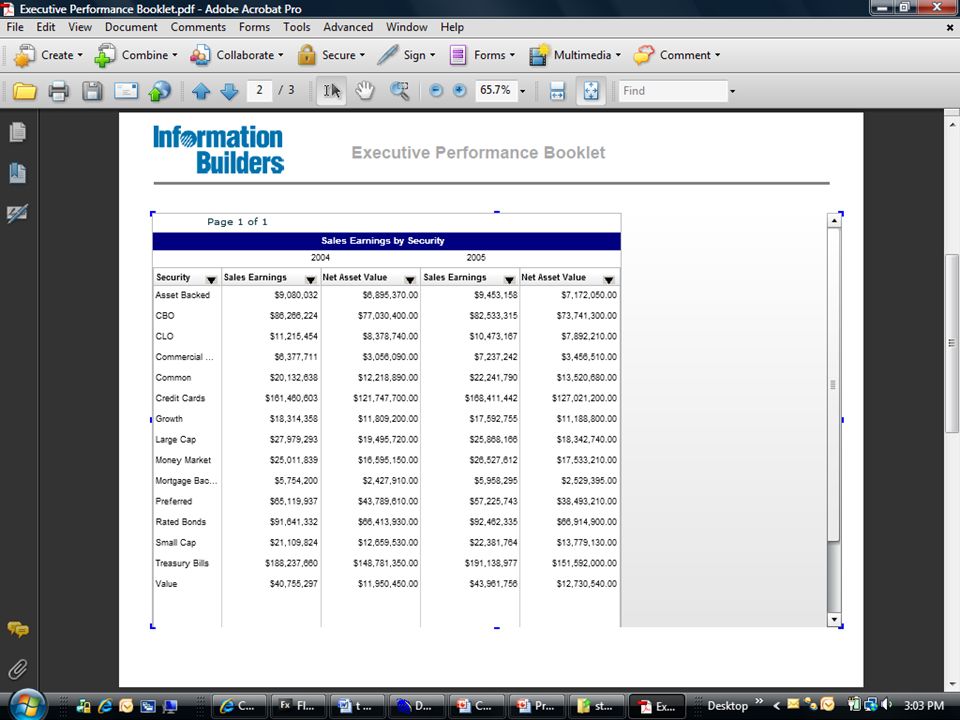
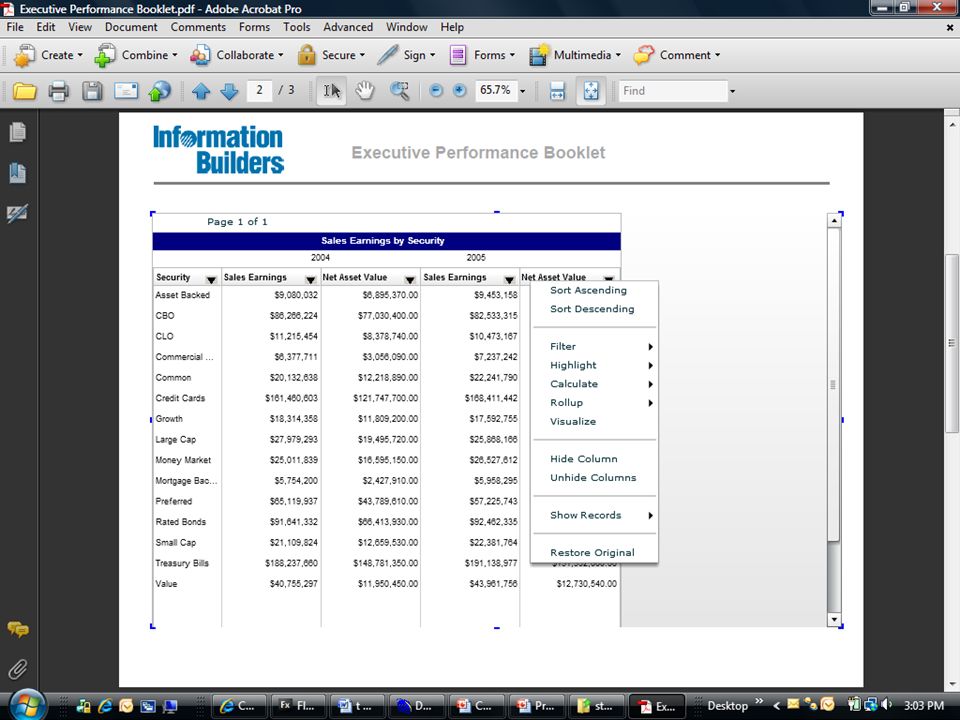
Topic 2 – Interactive PDF’s

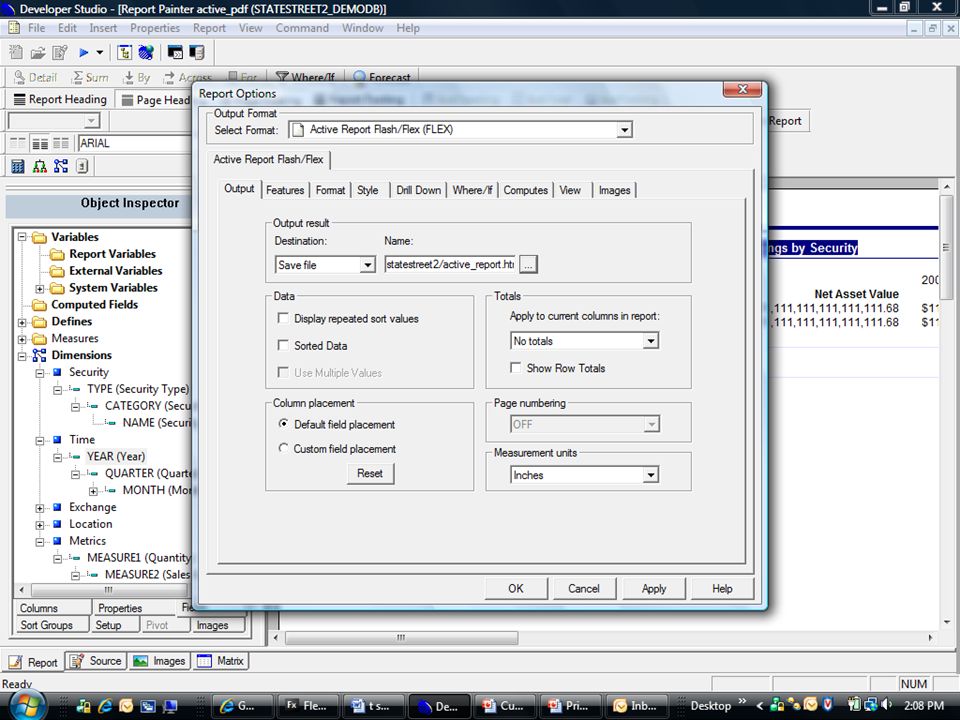
66
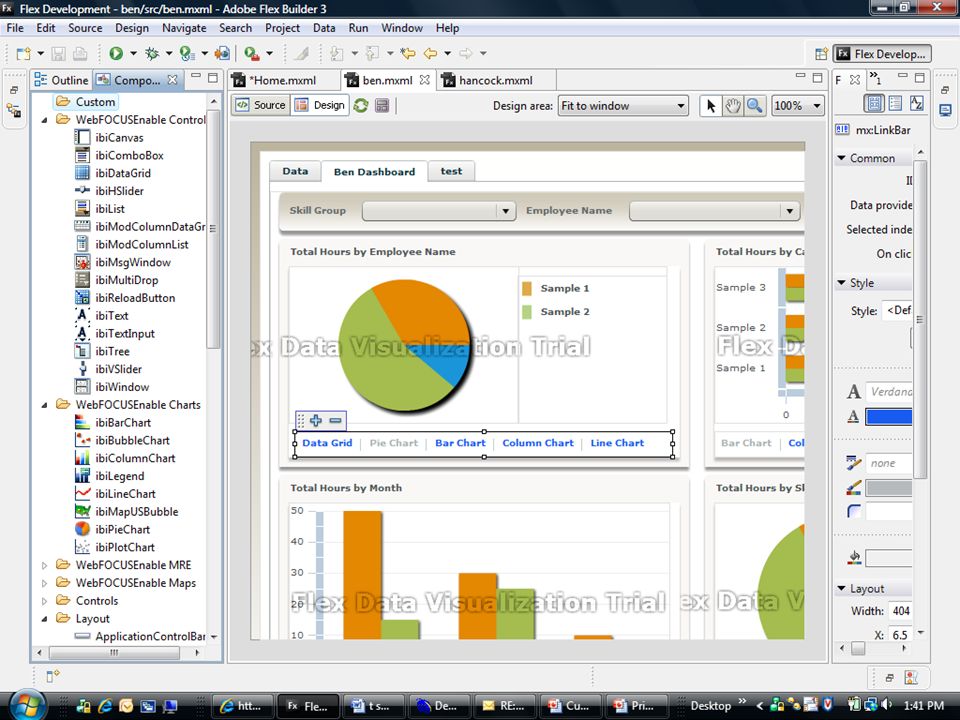
Step 1 Create a FLEX dashboard

70
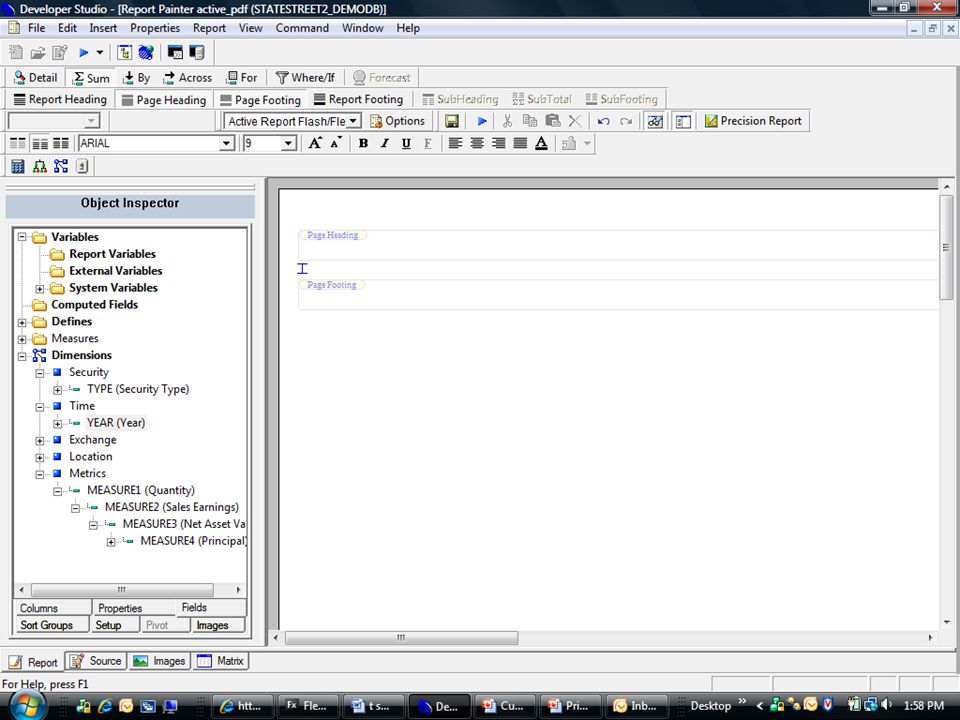
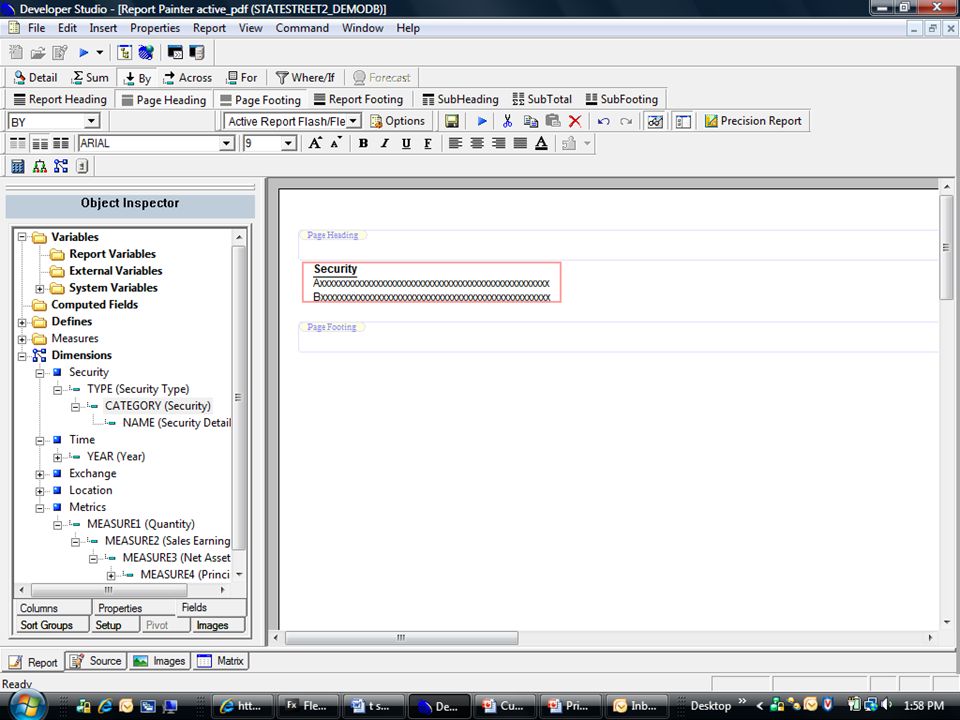
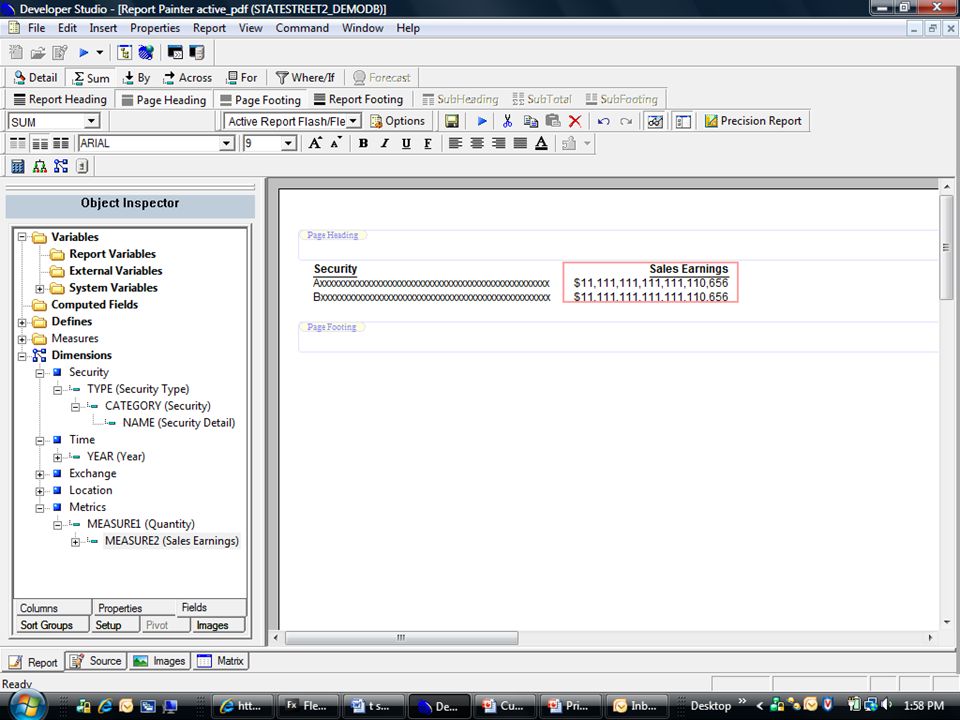
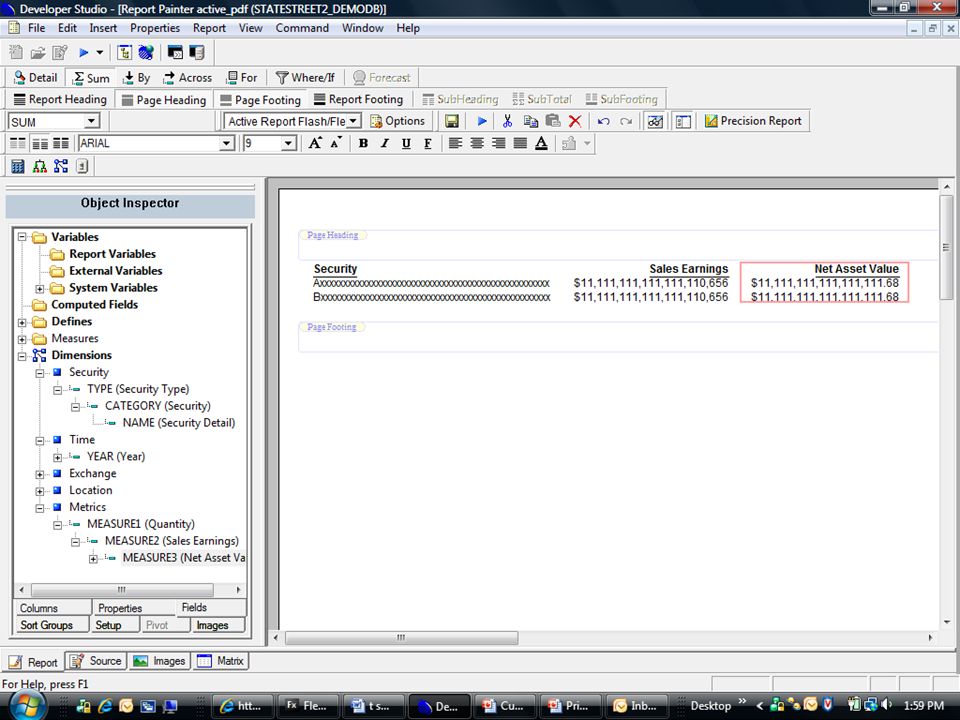
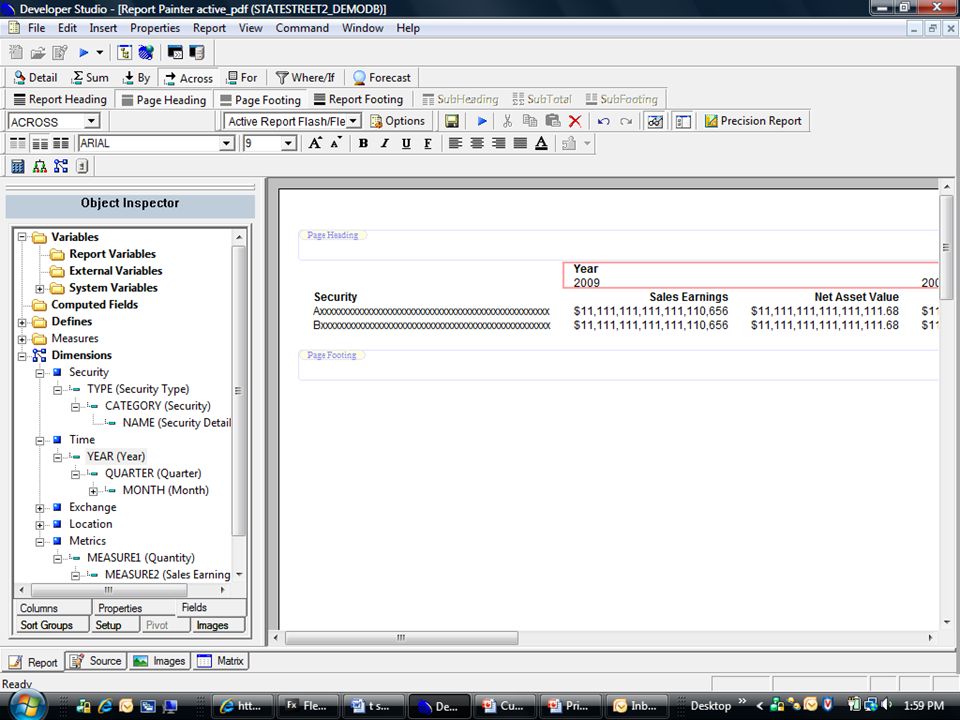
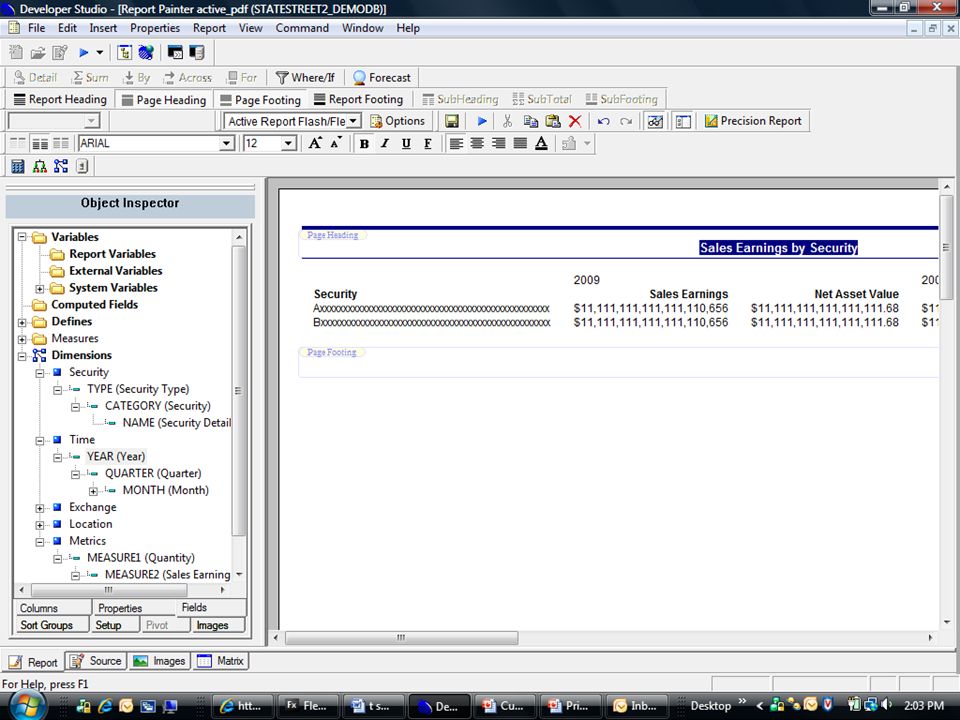
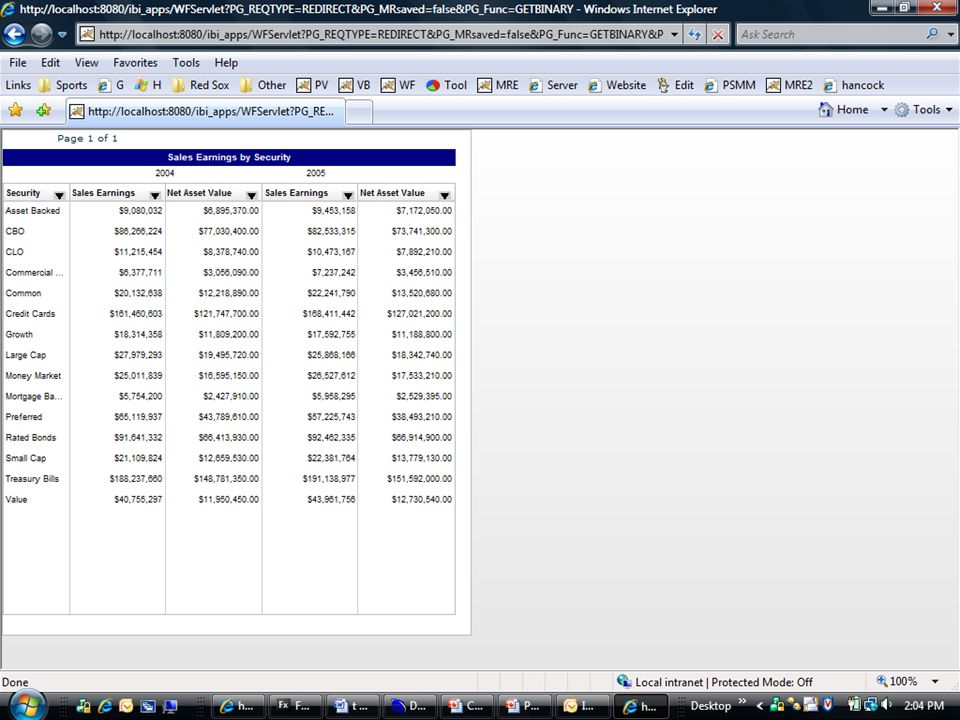
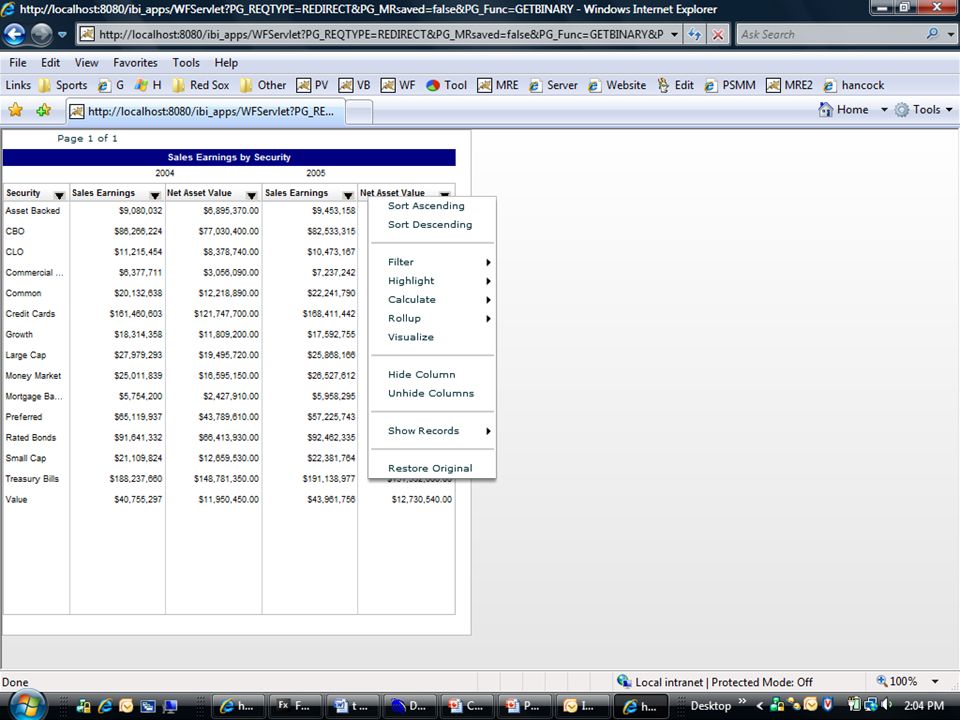
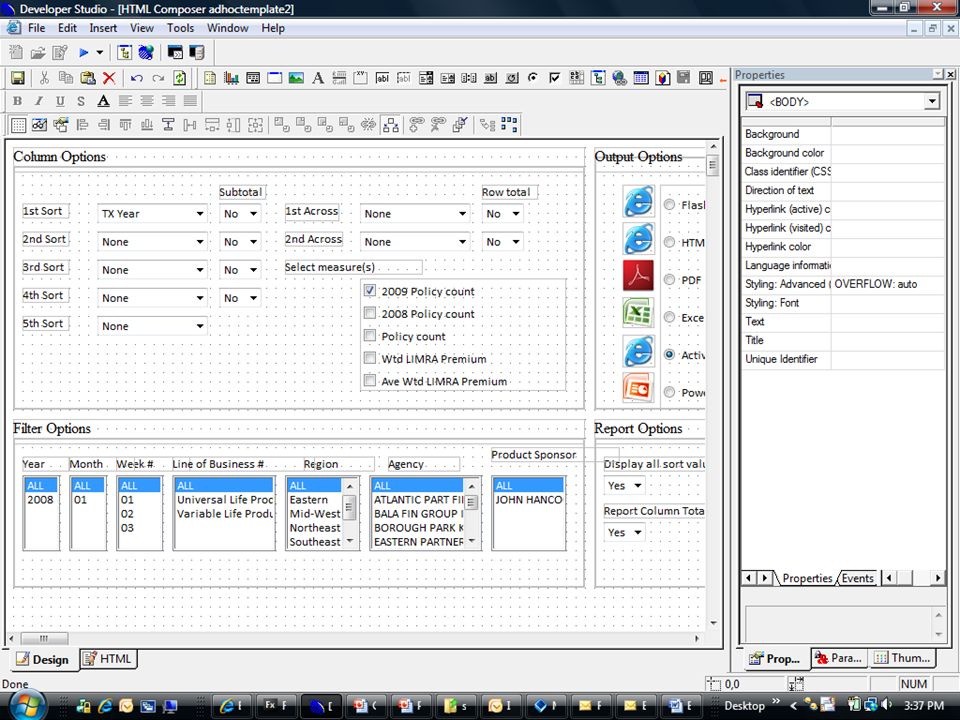
Step 2 Create FLEX Active report

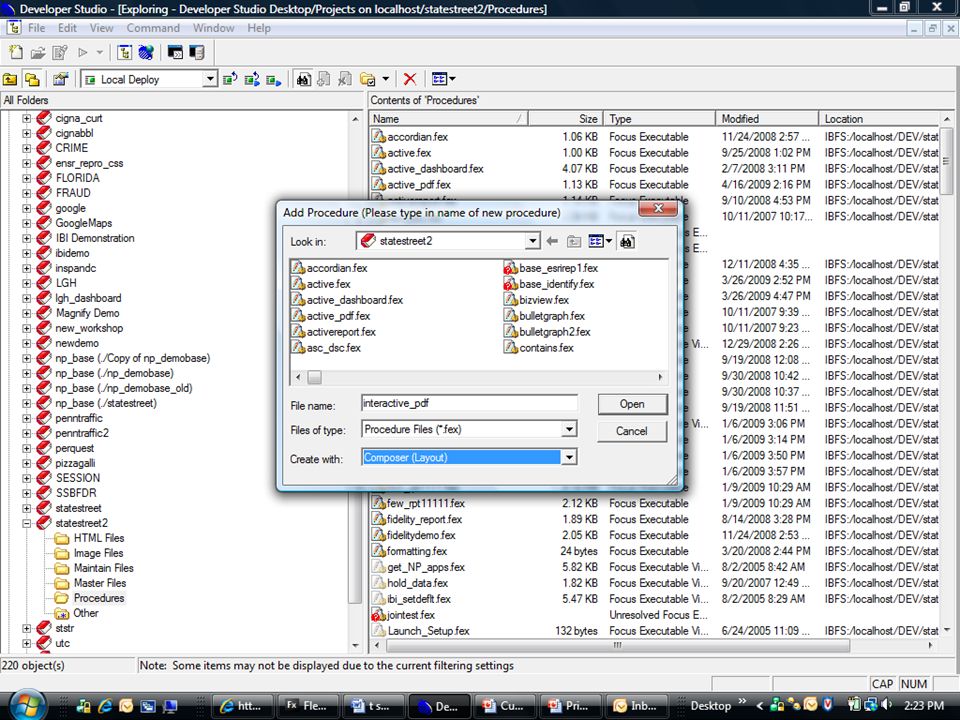
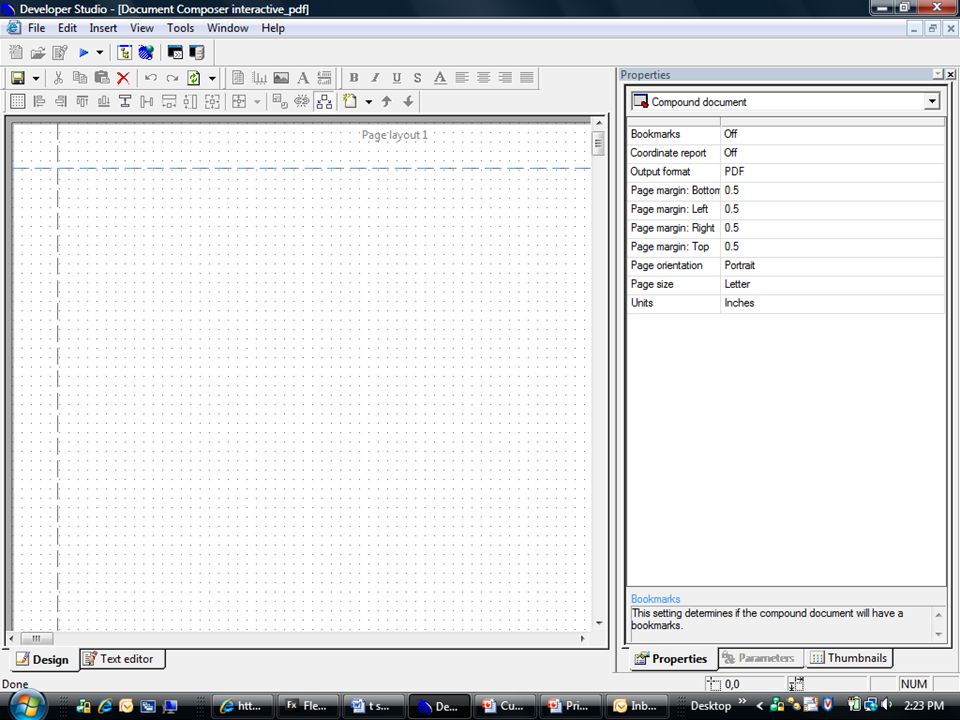
83
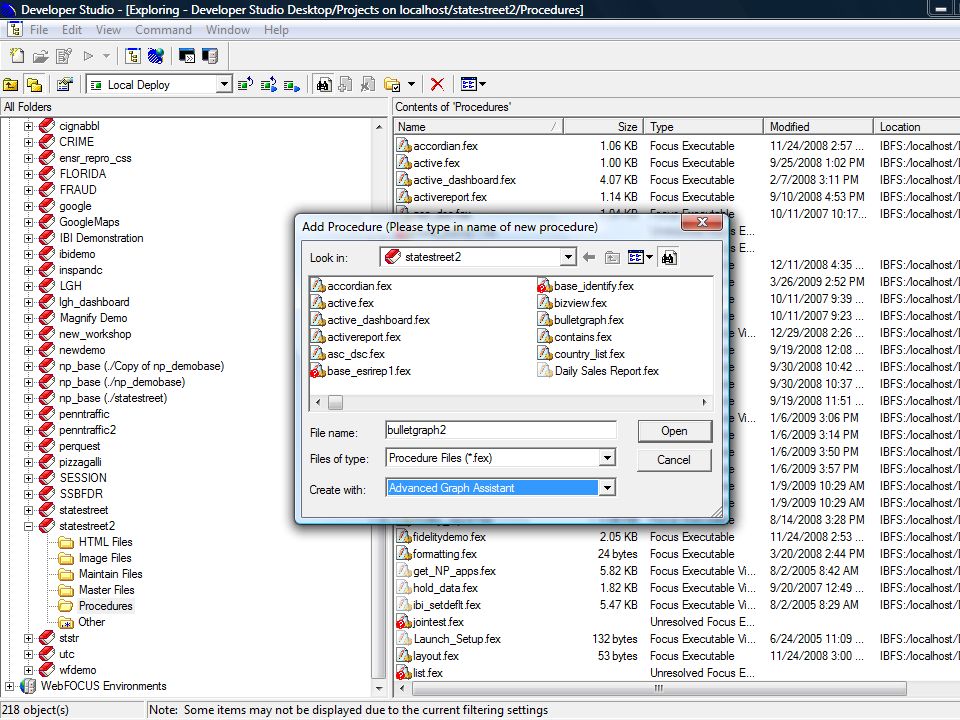
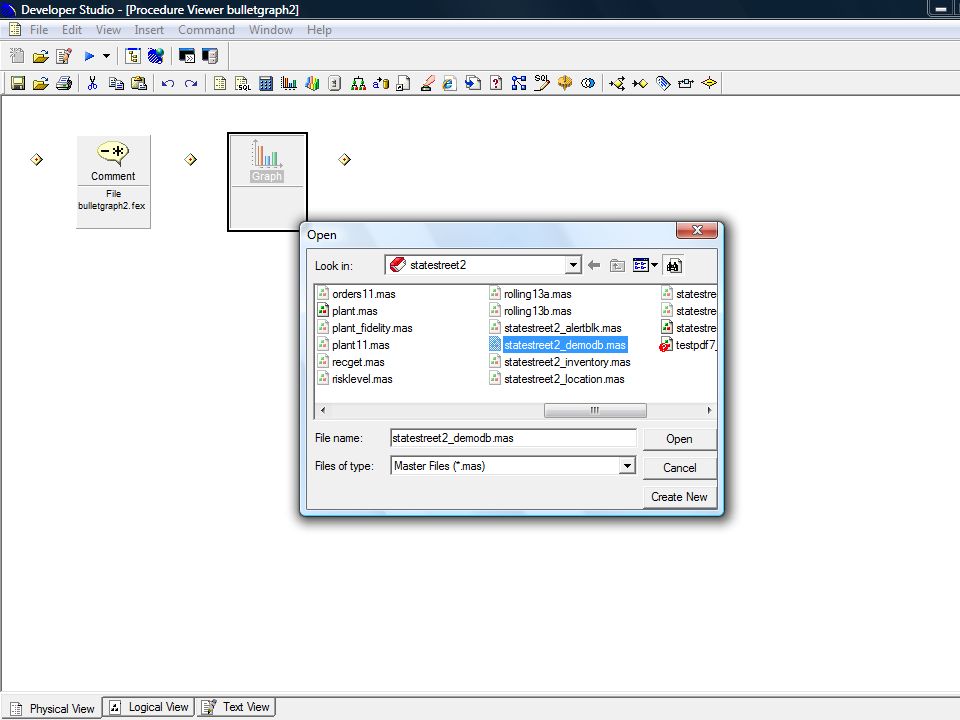
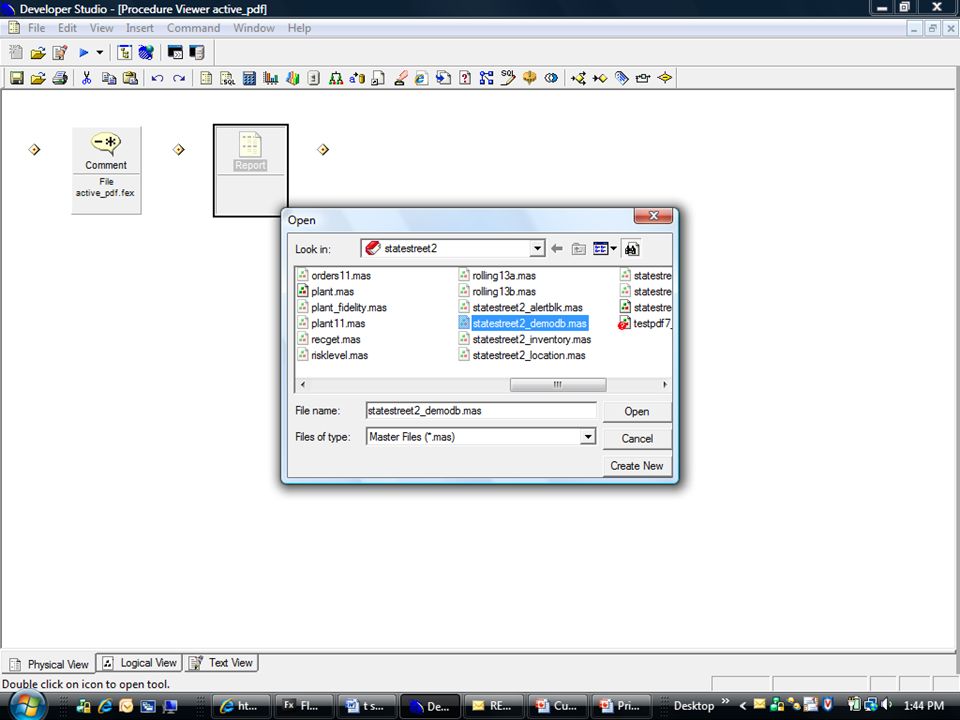
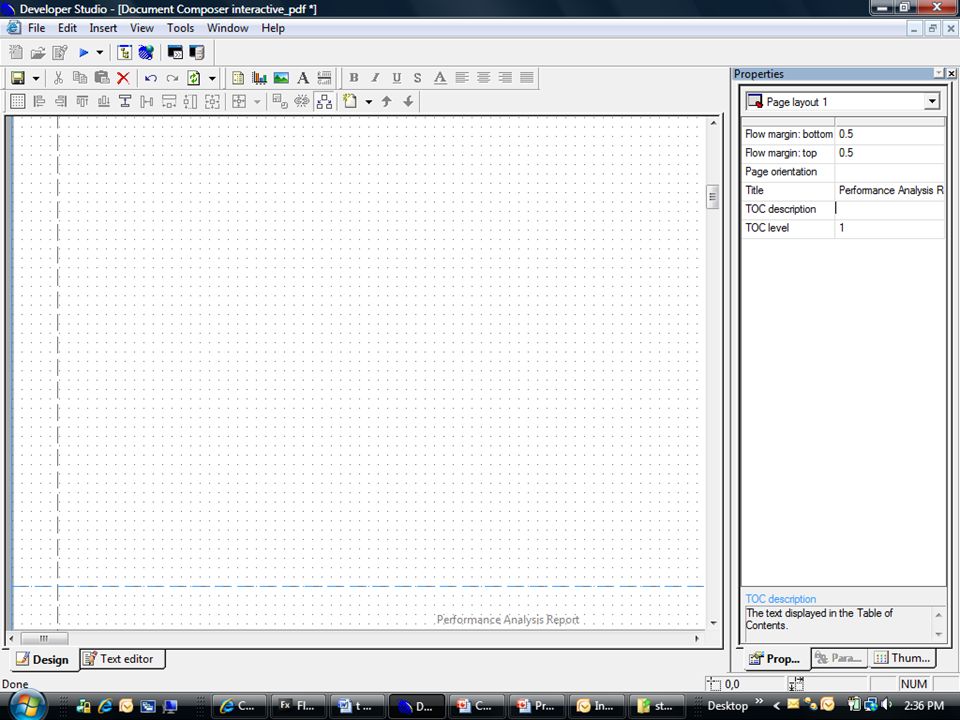
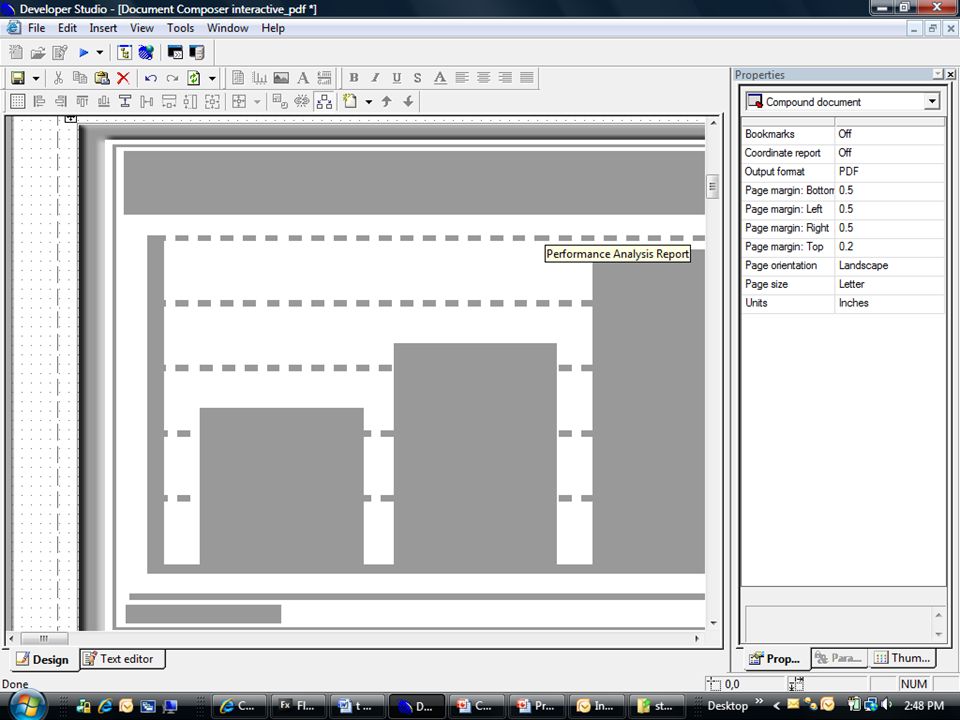
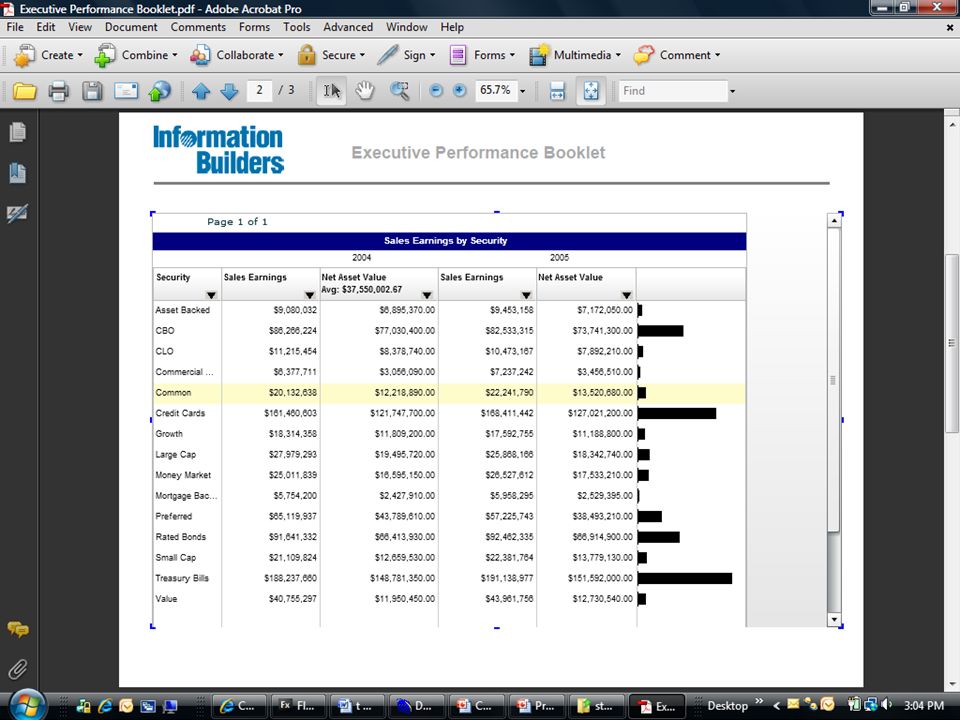
Step 3 Create new PDF document OR Open existing PDF document

101
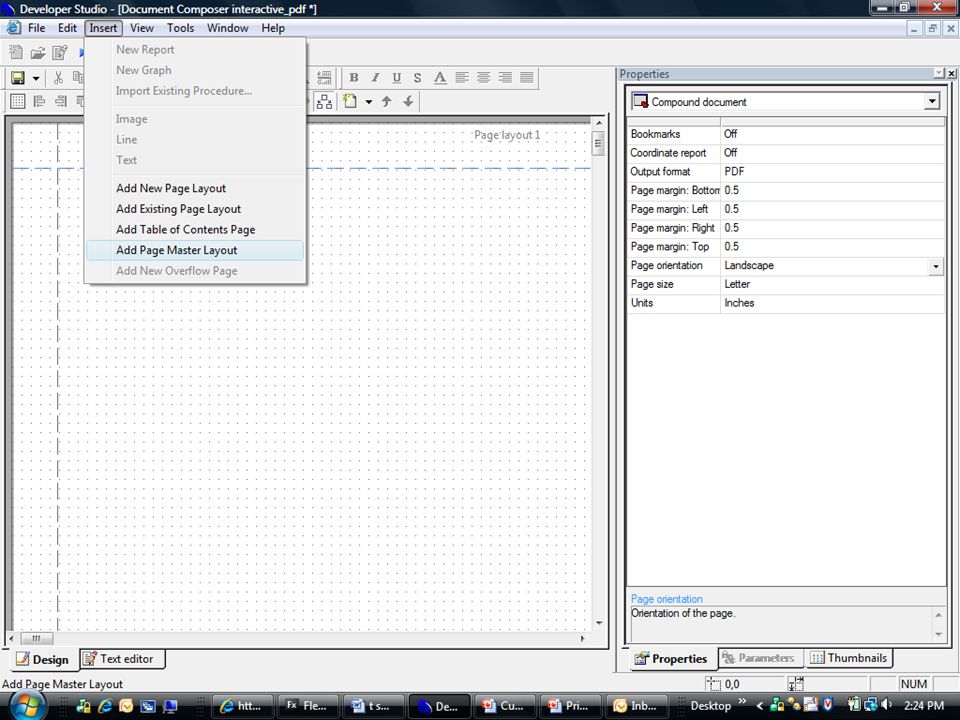
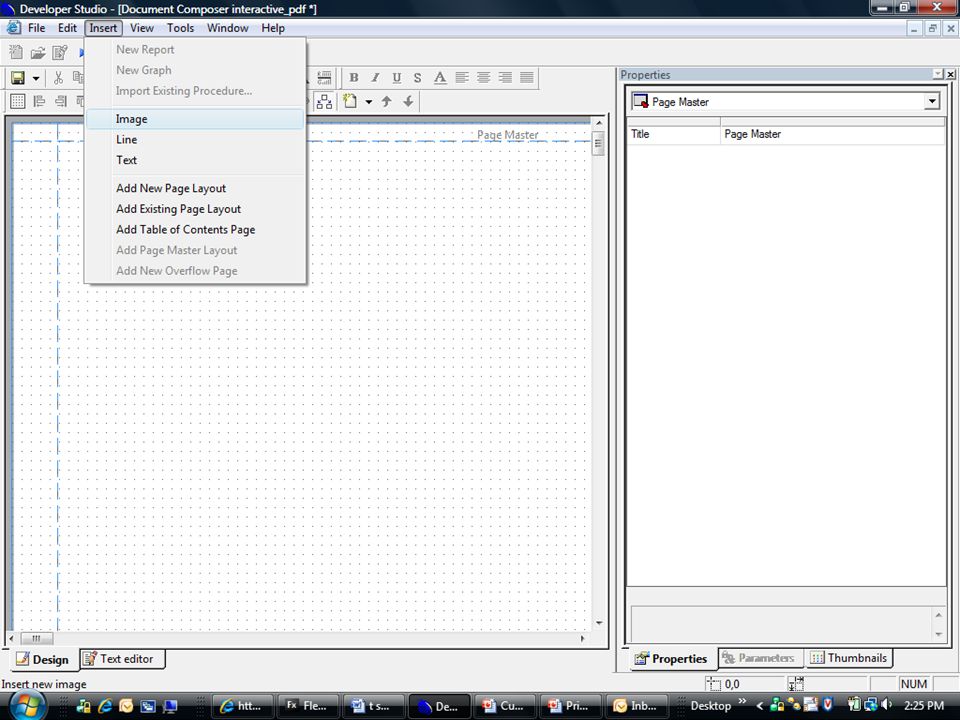
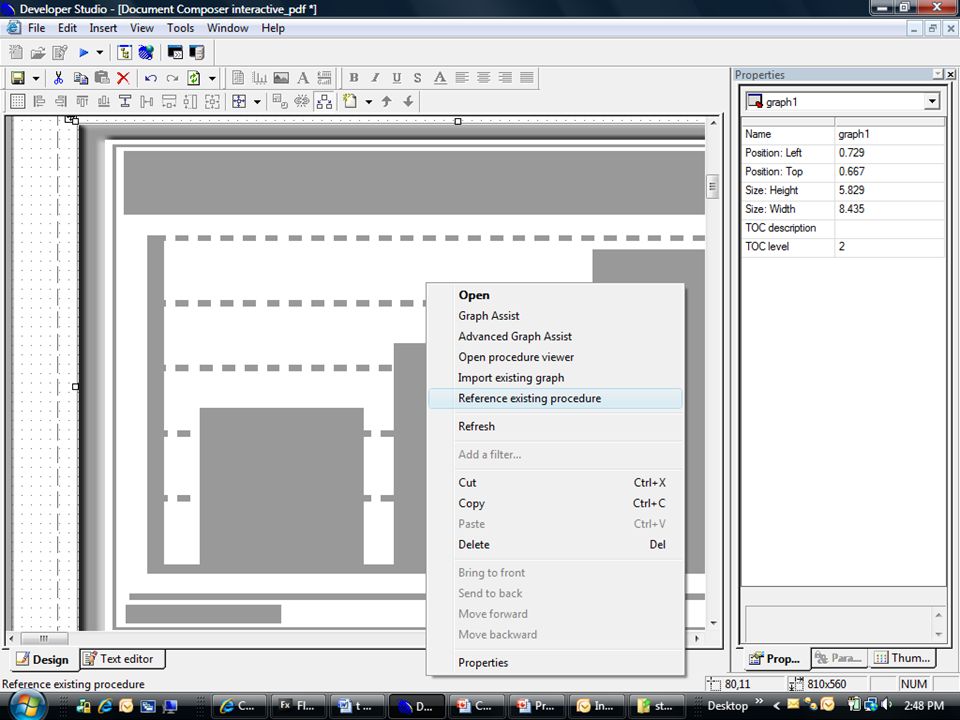
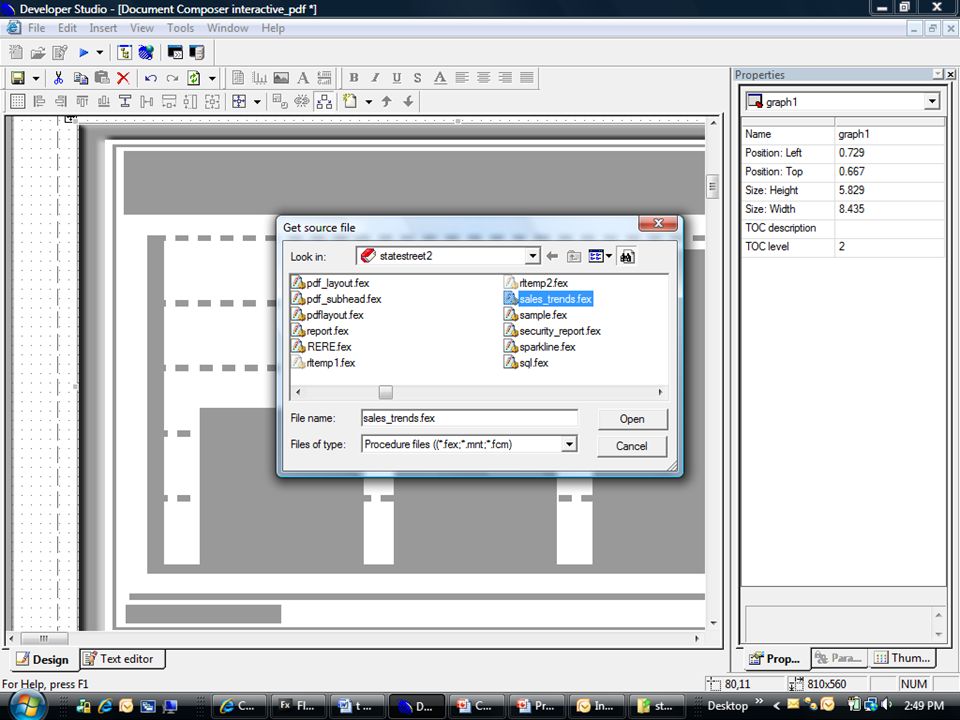
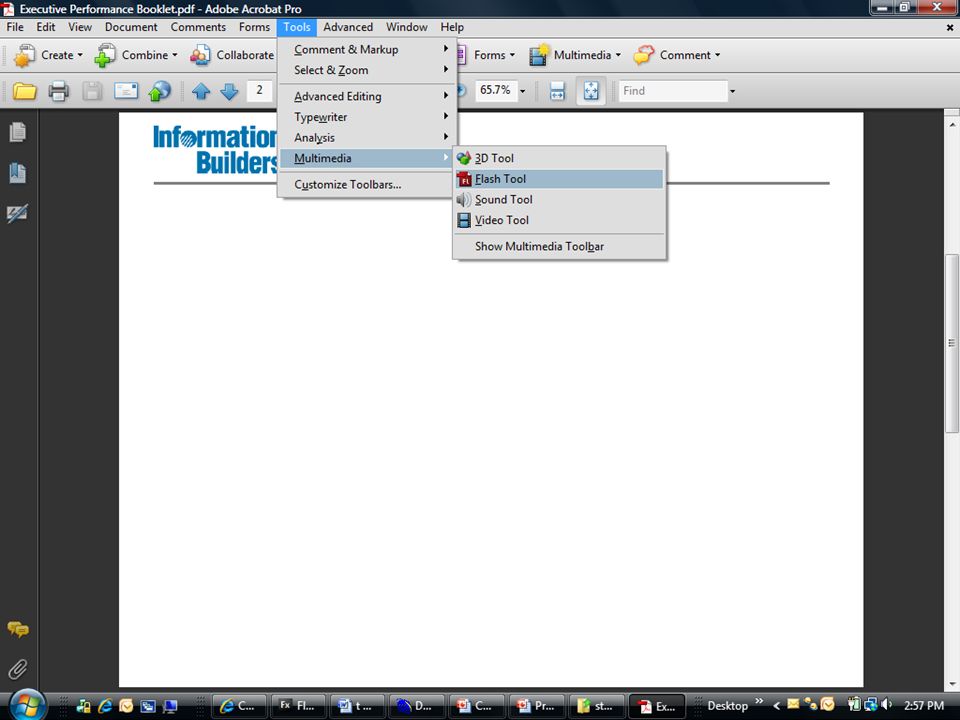
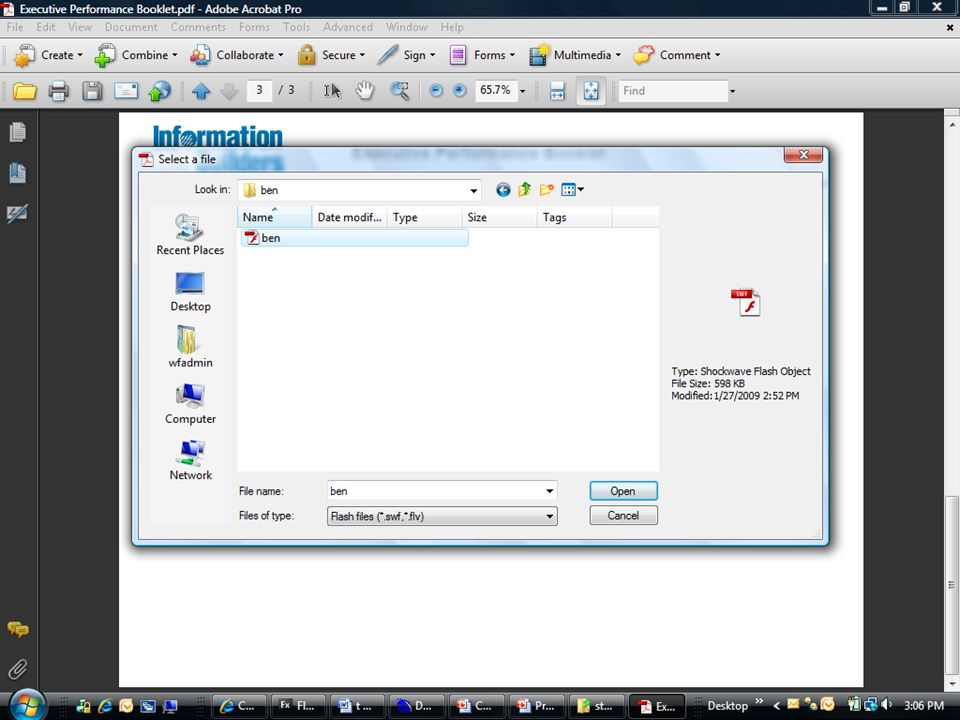
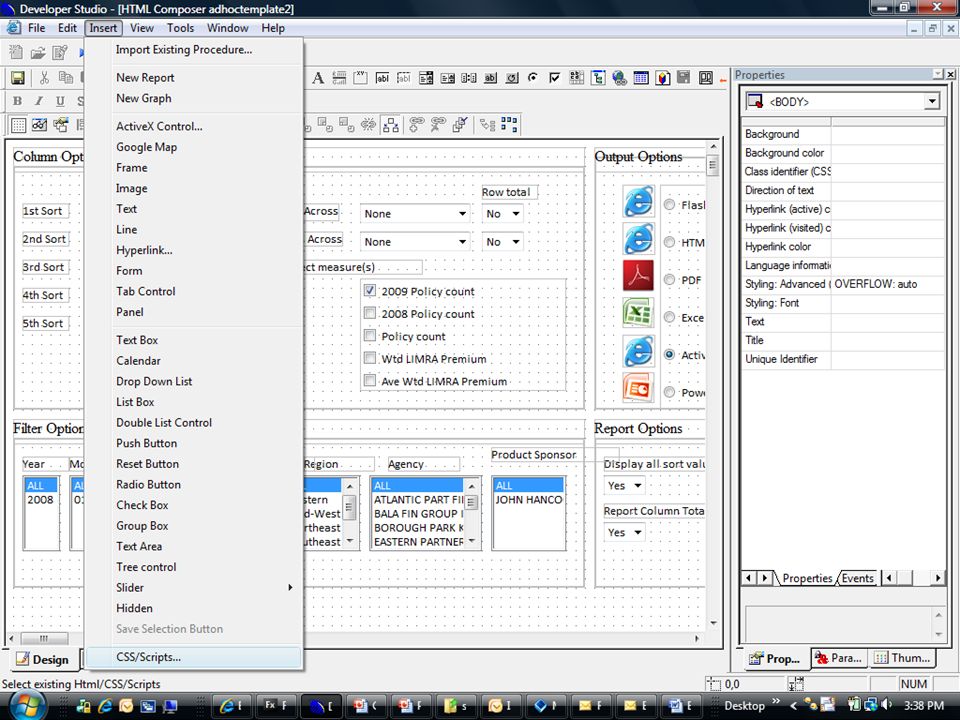
Step 4 InsertFLEX Active report

110
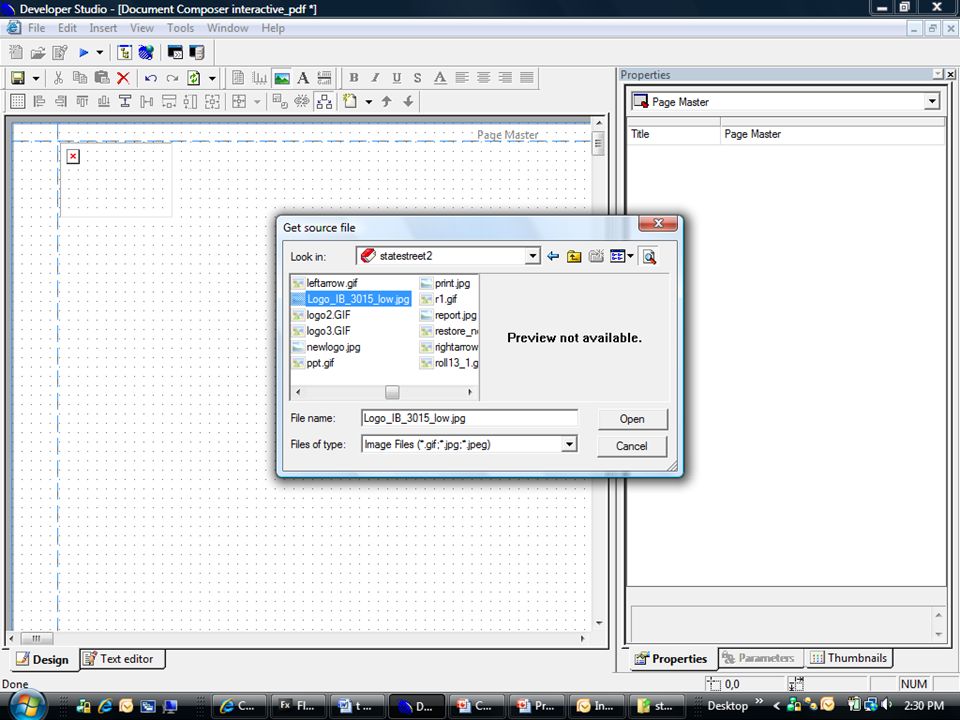
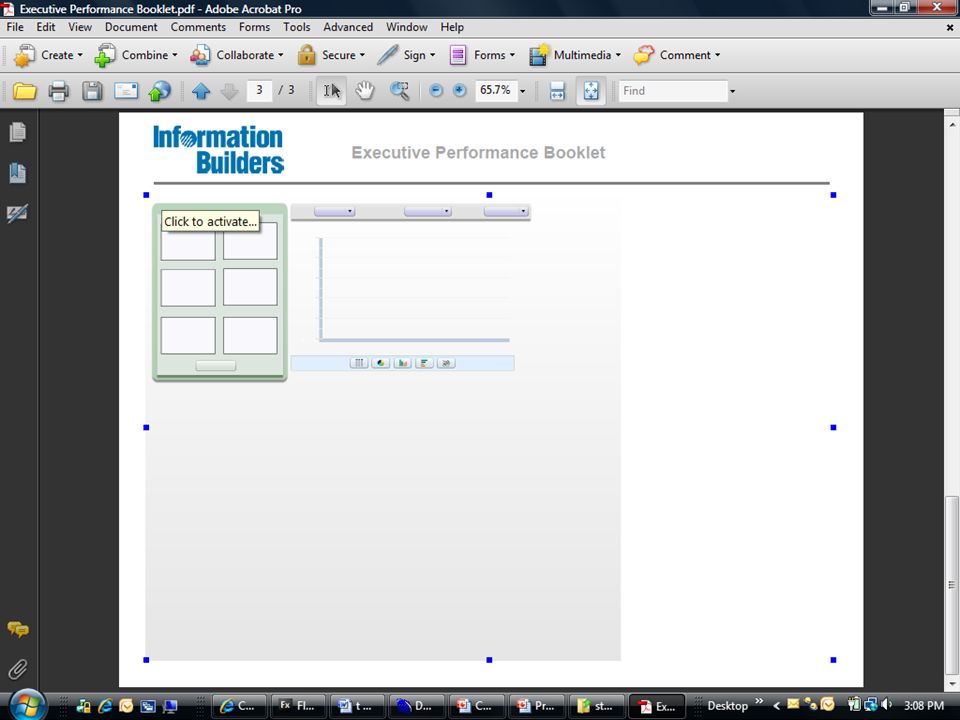
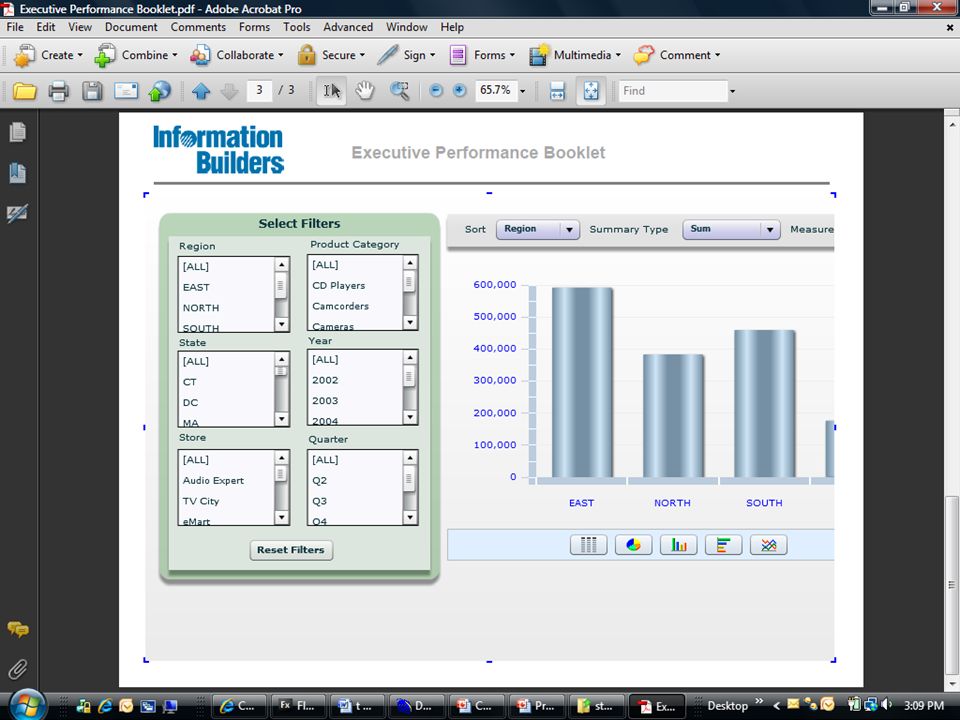
Step 5 Insert FLEX dashboard

115
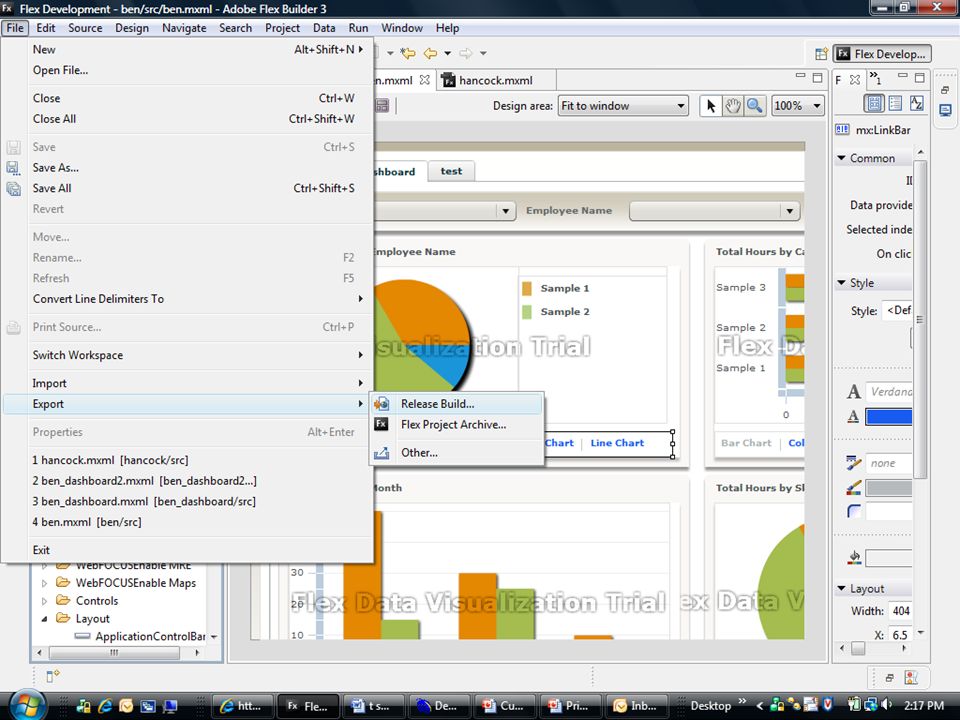
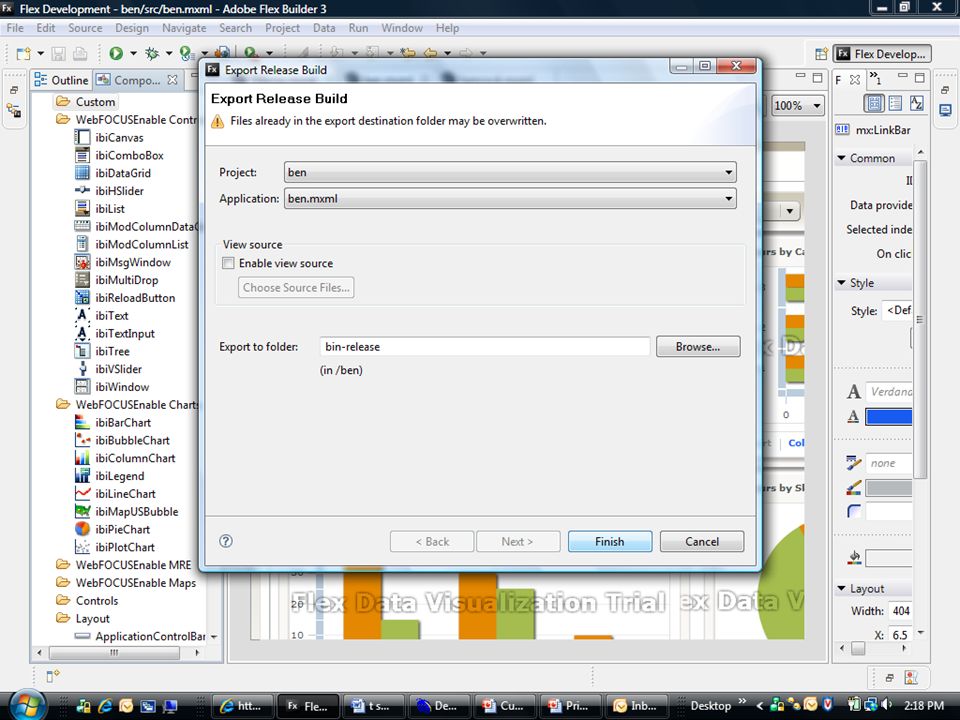
Step 6 Revel in your awesomeness

116
Topic 3 – Gradients

117
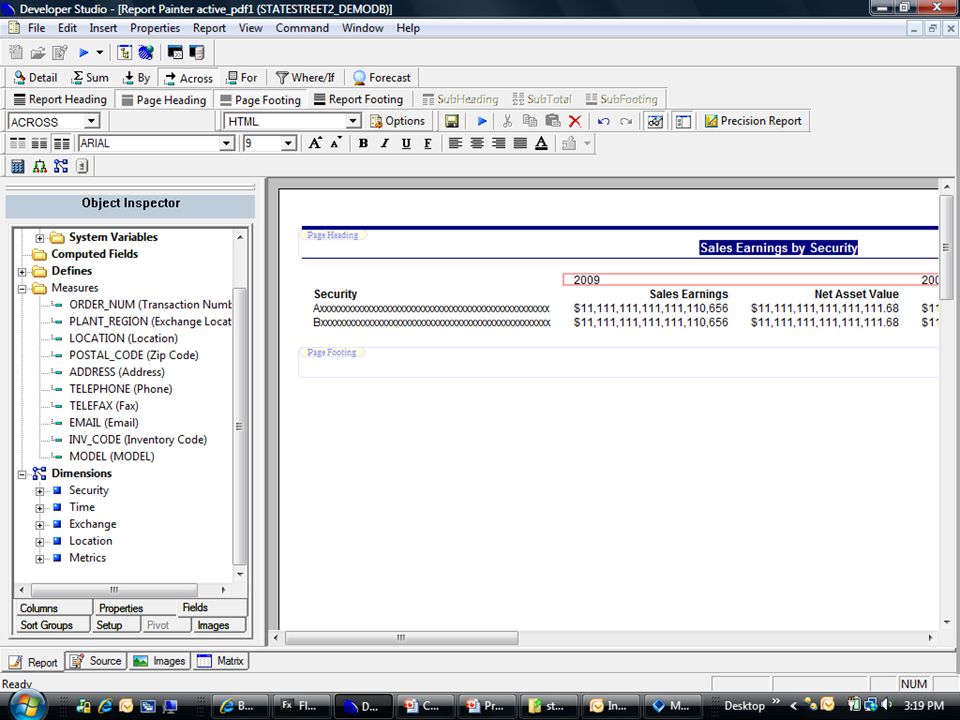
Step 1 Open existing report OR Create new report

119
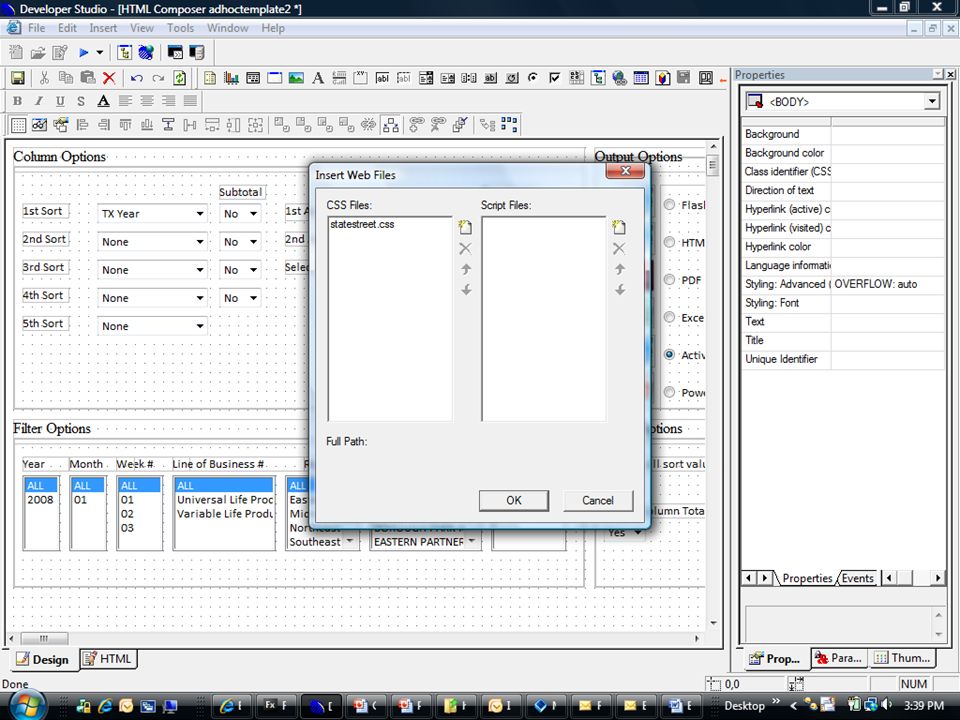
Step 2 Create new Cascading Stylesheet OR Open existing Cascading Stylesheet

120
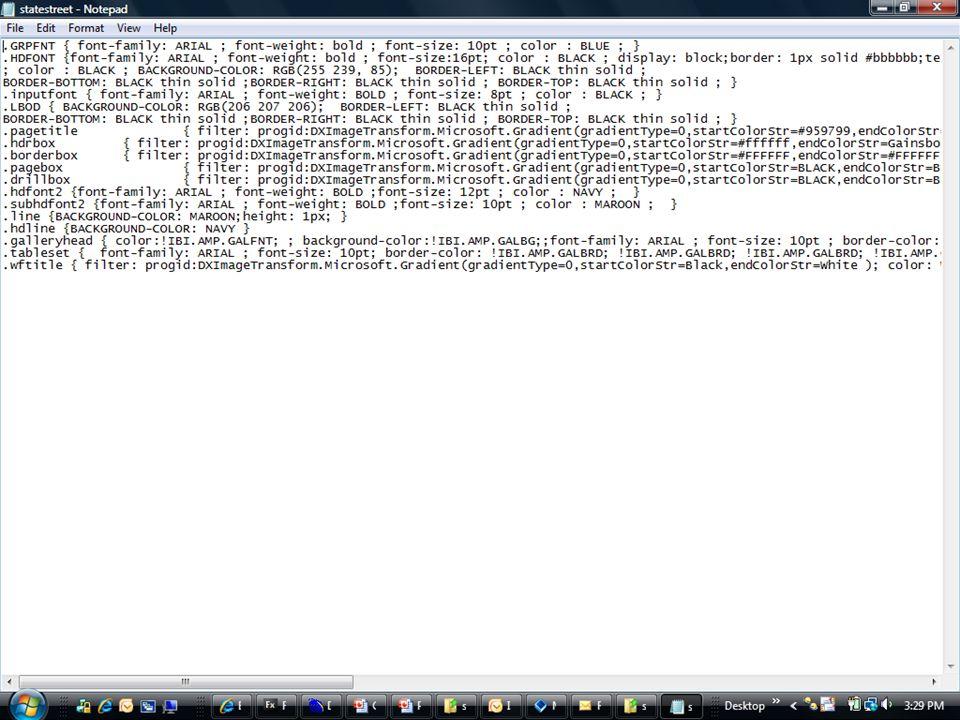
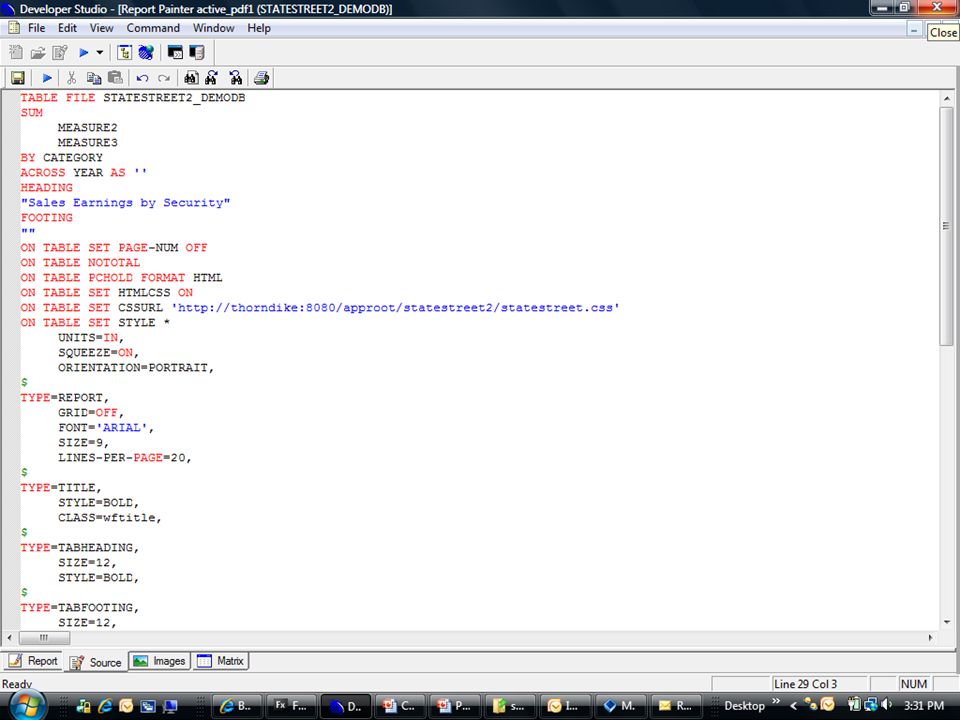
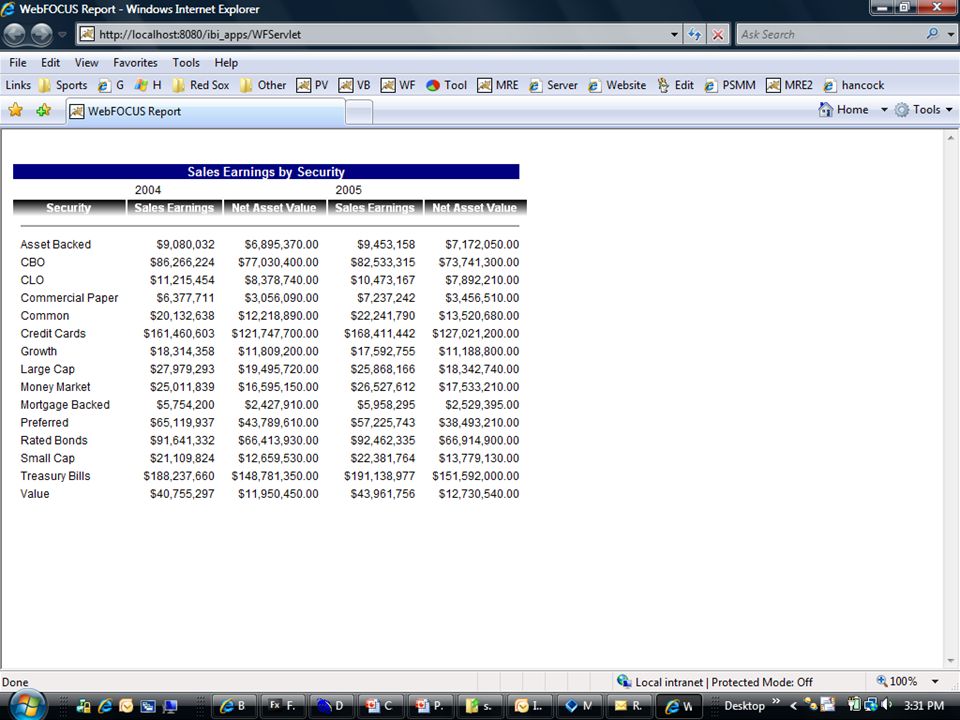
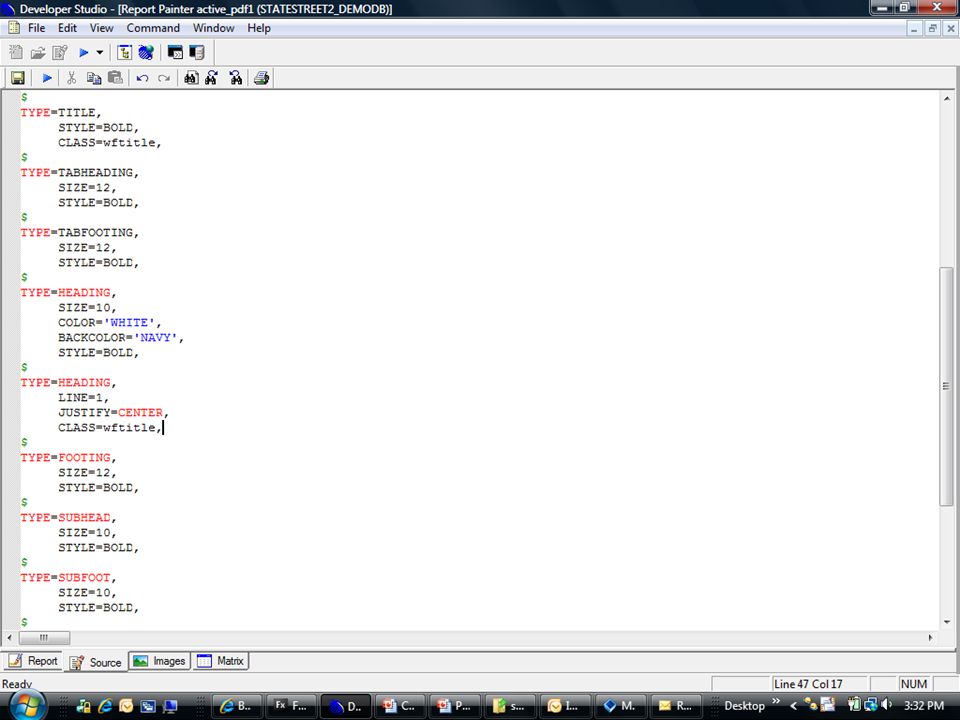
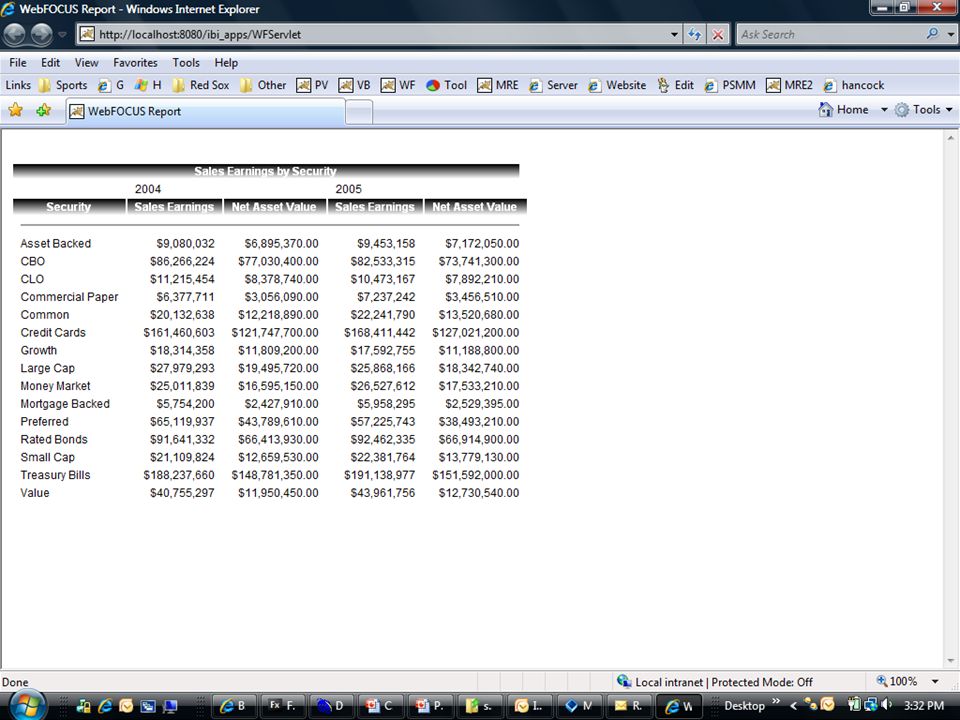
Using gradients for column titles, headings, etc… CSS:.wftitle { filter: progid:DXImageTransform.Microsoft.Gradient(gradientType=0,startColorStr=Black,endColorStr=W hite ); color: WHITE ; font-family: Arial; font-weight: bold ;font-size:12; vertical-align:middle; float: left;text-align: center;} WF FEX CODE: ON TABLE PCHOLD FORMAT HTML ON TABLE SET HTMLCSS ON ON TABLE SET CSSURL 'http://thorndike:8080/approot/statestreet2/statestreet.css‘ WF STYLESHEET CODE: TYPE=TITLE, COLOR='WHITE', BACKCOLOR=RGB(92 92 92), STYLE=BOLD, CLASS=wftitle, $
; color: WHITE ; font-family: Arial; font-weight: bold ;font-size:12; vertical-align:middle; float: left;text-align: center;} WF FEX CODE: ON TABLE PCHOLD FORMAT HTML ON TABLE SET HTMLCSS ON ON TABLE SET CSSURL WF STYLESHEET CODE: TYPE=TITLE, COLOR= WHITE , BACKCOLOR=RGB( ), STYLE=BOLD, CLASS=wftitle, $")
126
Using gradients for launch pages

127
Step 1

128
Cascading Stylesheet Open existing Cascading Stylesheet OR Create new Cascading Stylesheet

129
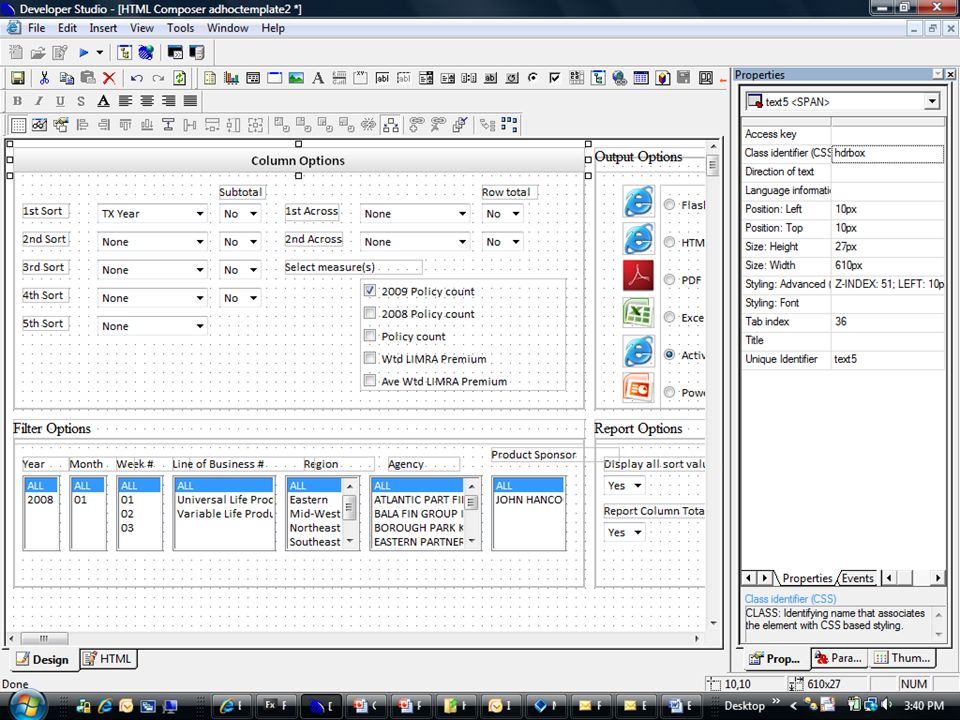
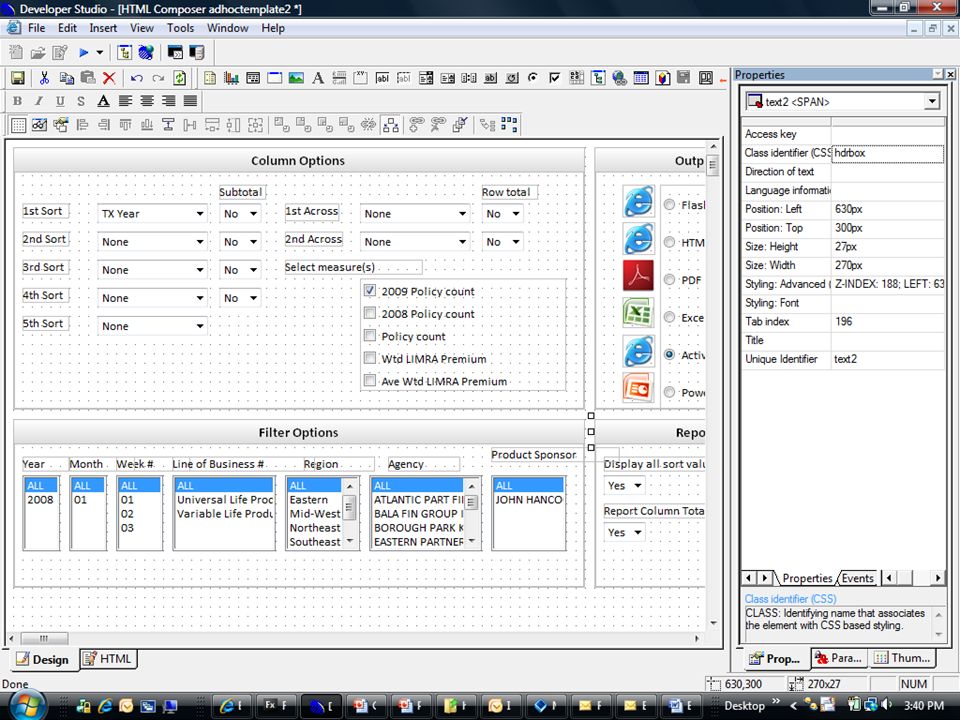
Stylesheet code.hdrbox { filter: progid:DXImageTransform.Microsoft.Gradient(gradie ntType=0,startColorStr=#ffffff,endColorStr=Gainsboro ); color: BLACK ; font-family: calibri, arial;font-weight: bold ;font-size:11pt; vertical-align:middle; line-height:25px;width: 100px;float: left;text-align: center; display: block;border: 1px solid #bbbbbb;}
; color: BLACK ; font-family: calibri, arial;font-weight: bold ;font-size:11pt; vertical-align:middle; line-height:25px;width: 100px;float: left;text-align: center; display: block;border: 1px solid #bbbbbb;}")
130
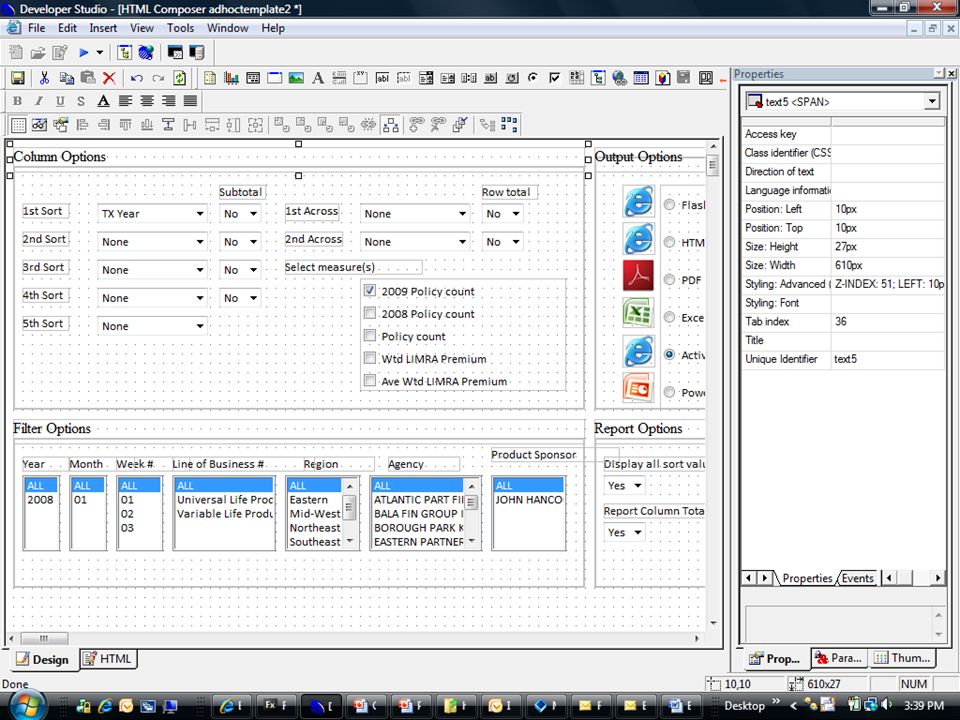
Step 2 Open existing parameterized report OR Create new parameterized report

138
Topic 4 – Customer Examples TBD

139
Topic 5 THE LIGHTING ROUND!

Similar presentations


. Cascading Style Sheets With the explosive growth of the World Wide Web, designers and programmers quickly explored and reached.>")


