Download presentation
Presentation is loading. Please wait.

1
Fall 2010 Hershey’s Key Opportunities Market 184

2
2 Wal-Mart Hershey’s Gain commitment and support of key seasonal strategies as well as everyday rollback programs Increase market 184 revenue through flawless execution of programs Hershey’s Wal-Mart OBJECTIVES

3
3 Market #184 Performance Year to Date 2010 Market #184 Total YTD $1,529,015 (-2%, -$33,736) -$197,782 Vs. Objective of +9.5% POS Data Week Ending July 30 2010 +$6,964 +$ 8,323 Market Avg. Hershey Obj. -$6,503 -$ 24,975 -$12,313 -$5,538

4
2010 Summer Program Results Syrup & S’mores Inventory = 21,000 Units/$57,760 Off Rollback Week 33 $6,000 Increase for the Year! Thank You!

5
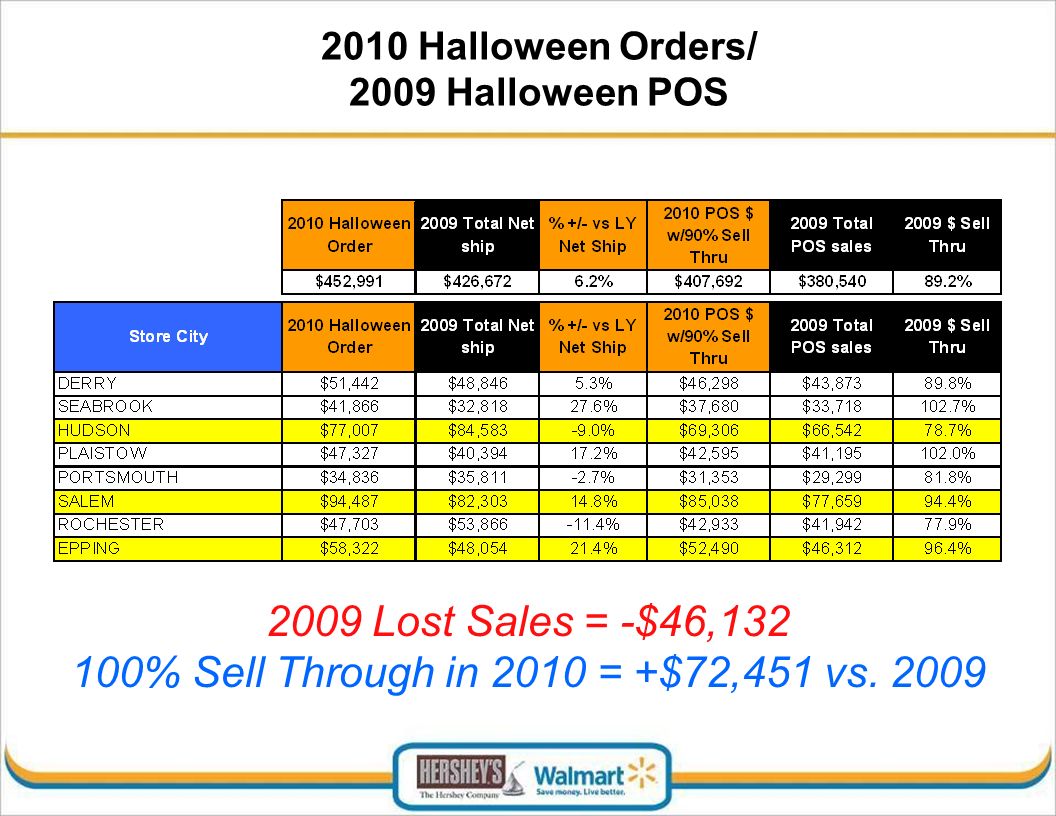
2010 Halloween Orders/ 2009 Halloween POS 2009 Lost Sales = -$46,132 100% Sell Through in 2010 = +$72,451 vs. 2009
6
2 3 1 1. Group 1: Set prior Labor Day, sell thru in high-90s 2. Group 2: Set around Labor Day, sell thru in 80s to 90s 3. Group 3: Set 1-2 weeks after Labor Day, sell thru in 70s to 80s Gross sell through increased drastically for stores with earlier sets Source: Nielsen Store View, Halloween universe, period ending 11/7/09 National FSIs used to support early features of SS August 15 – Not Halloween Branded September 26 October 17 Three National FSIs 50m circulation Dollar % Chg vs. LY +10.6%+6.3%+9.7%+6.6%+18.9% Dollar Sales $64.4M $32.3M $38.4M $47.0M $57.3M Source: Nielsen, FDMx, Halloween Universe, 9 weeks ending 11/7/09 Hershey has 3 of the top 5 brands during the Halloween season Hershey has increased Ad and POS support to assist retailers with Halloween sell through Hershey Corrugated Displays Seasonal advertising has increased 4x since ‘08 #1 Packtype during the Halloween season

7
2009 Hershey’s Halloween Results Only 4 Shipping waves in 2010, compared to 6 waves in 2009. Bigger Waves = Easier display building

8
1) 2010 Halloween Growth Strategy: Set seasonal aisles in Grocery Dept. ASAP Top retailers who set Halloween on or before Labor Day had higher sell-thrus in general than those who set Halloween later -11 pts -7.9 pts Labor Day 2009 Halloween Set Implementation Source: Nielsen Store View, Halloween universe, period ending 11/7/09 *Hershey Research has shown that setting the Halloween Modular in Lawn + Garden (no matter how early) is equivalent to Setting the modular 2 weeks post-labor day in terms of final Sell-Thru dollars
 is equivalent to Setting the modular 2 weeks post-labor day in terms of final Sell-Thru dollars.")
9
TV Snack Size is the #1 Packtype for Halloween accounting for 1/3 of Halloween seasonal POS at $52.6M 2) 2010 Halloween Growth Strategy: Rollback Snack Size on Cartrail All Season
 2010 Halloween Growth Strategy: Rollback Snack Size on Cartrail All Season")
10
3) 2010 Halloween Growth Strategy: Lead Endcap – Seasonal Aisle Fun Halloween Fact:The Lead Seasonal Endcap signals to consumer that Halloween Is Here. Points out the exact location of the candy modular. Fun Halloween Fact: 50% of Halloween Candy Purchased is not used for Trick or treating… because ….The average consumer buys Halloween candy 3-4 times before October 31

11
11 Next Steps Commitment to the following: Halloween Mod Set In Grocery by 8/20 with Lead Endcap Snack Size on Cartrail starting week of 8/23 Packaged Candy Endcap King Size Endcap Standard Bar Front Endcap for

Similar presentations


. 4 th Quarter 2008 Grocery / Market Manager November-January 2008 Program: Wks 16 - 32 SSO Shipping: Week 27 12oz Packaged Candy.>")
 1.Easter FSI Support Hannaford.>")


>")


 Meghan Krivoshein (District Manager) Jim Morrison (Retail Sales Representative)>")

