Download presentation
Presentation is loading. Please wait.

1
HEP-2 CELLS CLASSIFICATION VIA FUSION OF MORPHOLOGICAL AND TEXTURAL FEATURES 13 November 2012 IEEE 12th International Conference on BioInformatics & BioEngineering I. Theodorakopoulos, D. Kastaniotis, G. Economou and S. Fotopoulos {iltheodorako, dkastaniotis}@upatras.gr, {economou, spiros}@physics.upatras.gr Computer Vision Group Electronics Laboratory Physics Department University of Patras, Greece www.upcv.upatras.gr www.ellab.physics.upatras.gr

2
Motivation The standard screening test for detection of autoimmune diseases is the indirect immunofluorescence (IIF) test. Human autoantibodies (AABs) associated with various autoimmune conditions, are detected by specific fluorescence patterns on a human epithelial cell line (HEp-2). Testing is performed manually but : Requires highly-specialized personnel. Time-consuming procedure. Low standardization leads to high inter-laboratory variance.
 associated with various autoimmune conditions, are detected by specific fluorescence patterns on a human epithelial cell line (HEp-2). Testing is performed manually but : Requires highly-specialized personnel. Time-consuming procedure. Low standardization leads to high inter-laboratory variance..")
3
Typical IIF Procedure Image AcquisitionImage SegmentationMitosis Detection Fluorescence Intensity Classification Staining Pattern Recognition

4
Typical IIF Procedure Image AcquisitionImage SegmentationMitosis Detection Fluorescence Intensity Classification Staining Pattern Recognition Input: Single-Cell Images Cell Contour Fluorescence Intensity

5
Taxonomy More than thirty different nuclear and cytoplasm patterns could be identified. Can be grouped into six basic patterns:

6
Properties Different staining patterns present variations both in: Morphological characteristics Shape complexity Holes Intensity peaks Textural characteristics Smooth Areas Grainy Areas In order to capture the unique properties of each pattern, incorporation of both morphological and textural descriptors seems reasonable.

7
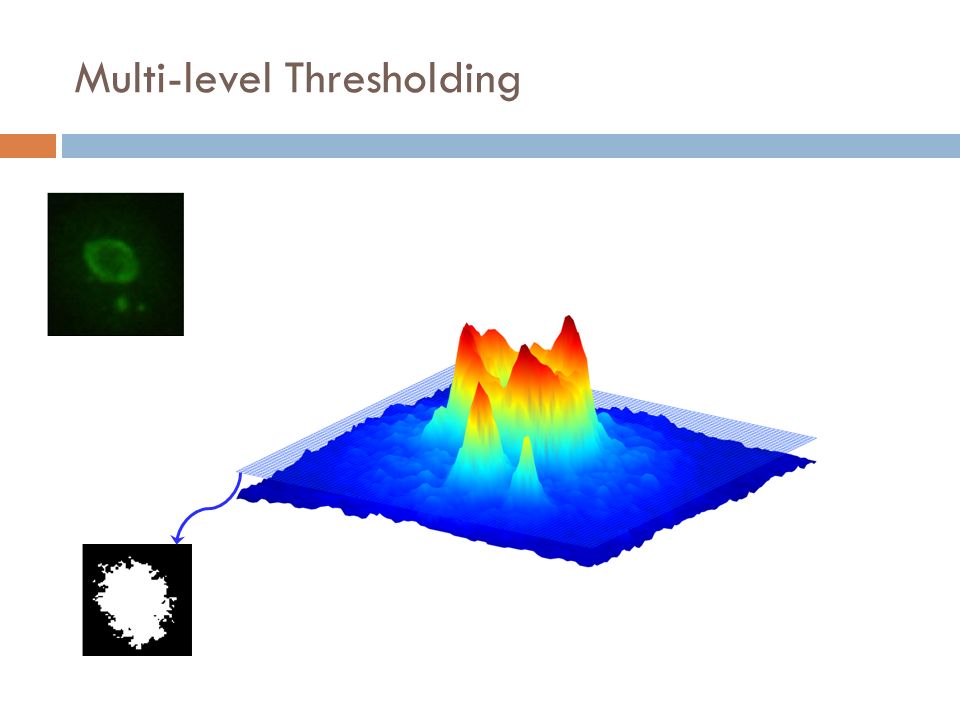
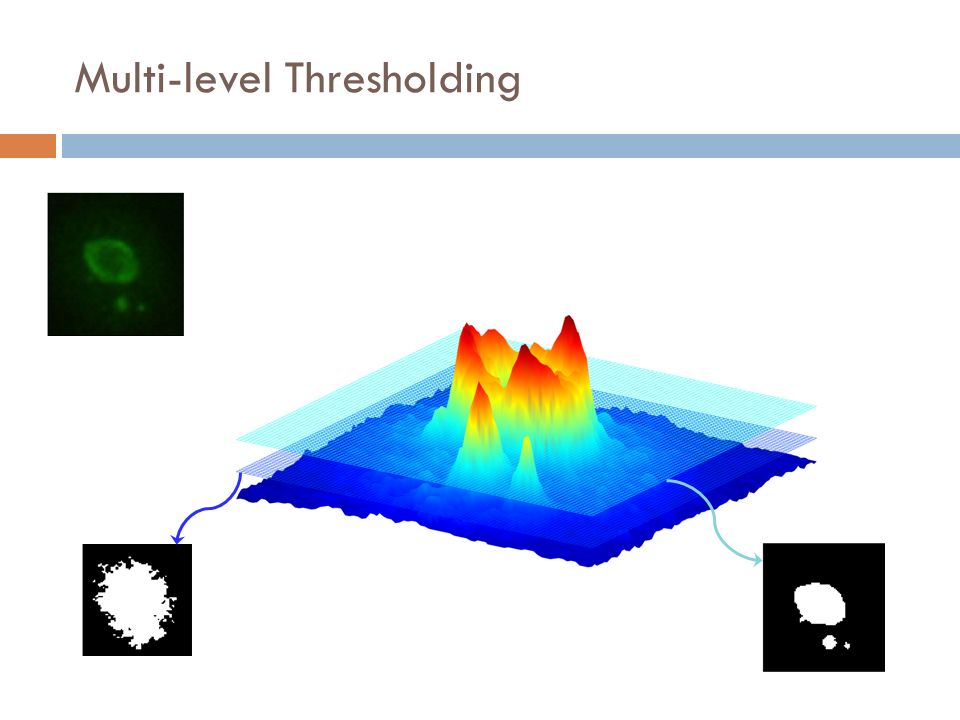
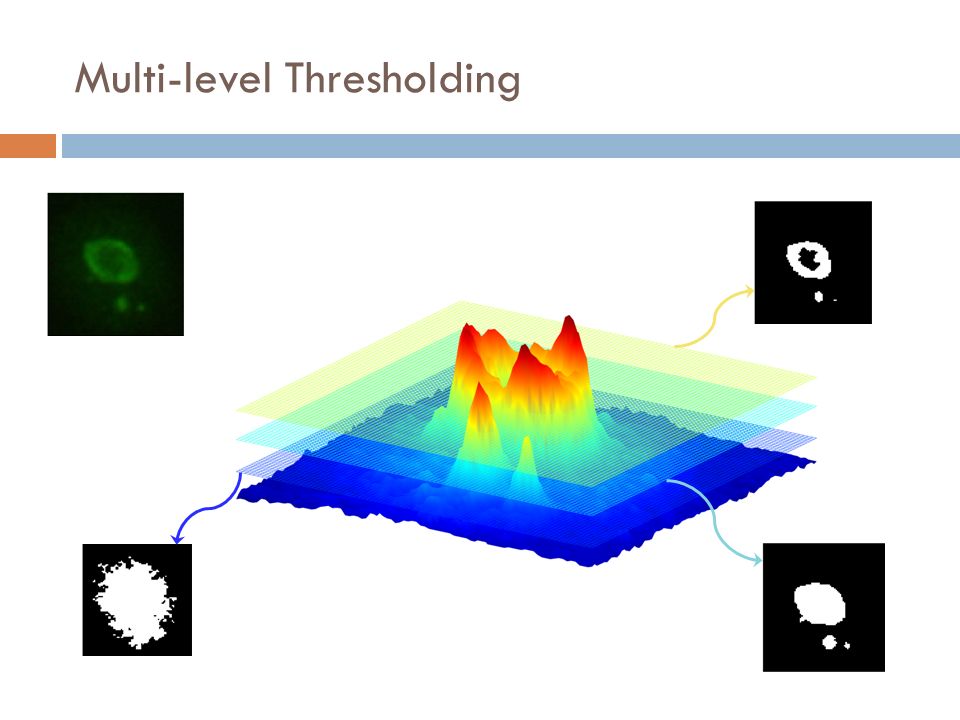
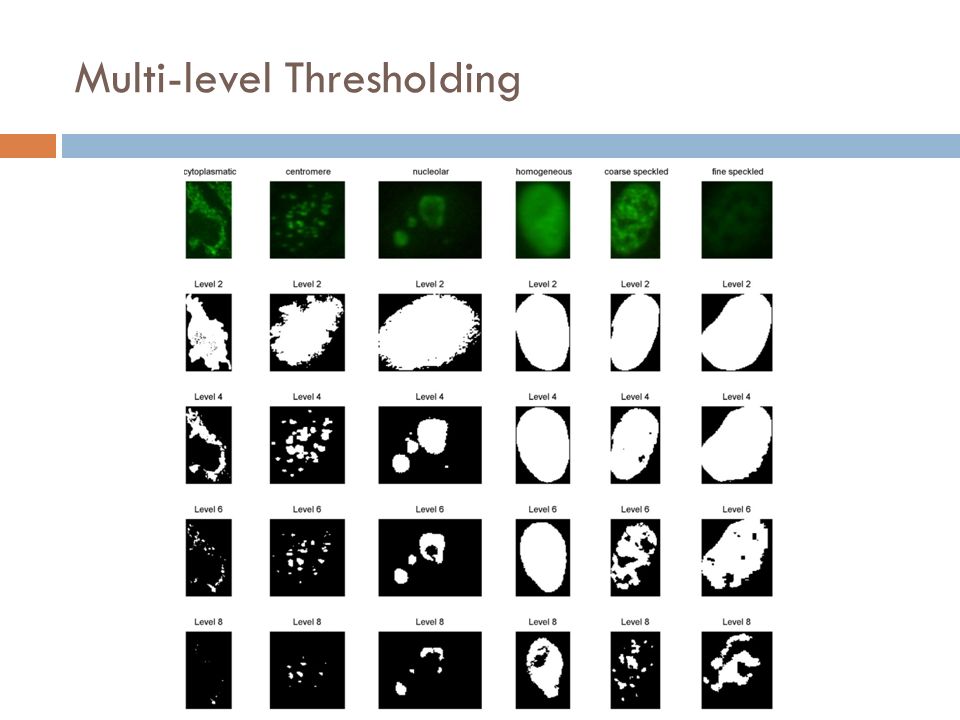
Multi-level Thresholding

12
Morphological Features Cell’s contour complexity Threshold cell image into 9 levels equally spaced between intensity extremes. Perform Connected Components Analysis on each binary image. Discard blobs with area <1% of the mean area. On each binary image, compute: Number of detected blobs Density of detected blobs Mean solidity of the detected blobs Concatenate all features to a 28-dimensional descriptor

13
Local Binary Patterns (LBPs) 88102133 14100200 4011092 01110100 011 01 010 116 A well-established textural descriptor. The biggest part of textural information is encoded in the 58 uniform patterns. LBPs are not rotation invariant. A simple solution is to calculate the uniform LPBs histograms on 80 rotated instances of the cell image (4.5 deg intervals).
..")
14
Local Binary Patterns (LBPs)
")
15
Classification The 28 morphological features and the 58-bin LBPs descriptor are concatenated in a 86-Dimensional feature vector. Classification is performed using non-linear SVMs with Gaussian kernel.

16
Evaluation Lack of publicly available datasets. Evaluation on the dataset of HEp-2 cell classification contest (hosted by ICPR 2012 conference) 721 single-cell fluorescence images. Manually segmented and annotated by specialists in order to provide ground truth. Binary masks and fluorescence intensity are provided. Approximately uniform distribution of patterns. There are not reported results for comparison yet.
 721 single-cell fluorescence images. Manually segmented and annotated by specialists in order to provide ground truth. Binary masks and fluorescence intensity are provided. Approximately uniform distribution of patterns. There are not reported results for comparison yet..")
17
Results K-fold validation - Classification performance of the various feature sets for variable k Confusion Matrix for 10-fold validation procedure using morphological and textural features’ fusion

18
Thank You This research has been co-financed by the European Union (European Social Fund – ESF) and Greek national funds through the Operational Program "Education and Lifelong Learning" of the National Strategic Reference Framework (NSRF) - Research Funding Program: Heracleitus II. Investing in knowledge society through the European Social Fund. Acknowledgment

Similar presentations

 and Greek national funds through the Operational Program Education.>")


 Shengcai Liao, Guoying Zhao, Vili Kellokumpu,>")


