Download presentation
Presentation is loading. Please wait.

1
Research Experience Daniel Fregosi Summer 2006 UNCC Visualization Center

2
Worked under the guidance of Dr. Ribarsky and Dr. Wartell Thanks to Remco Chang, Hunter Hale, and Josh Jones for their everyday help

3
Virtual Charlotte 3D Model System for the City of Charlotte Basic concept similar to Google Earth Used to attract businesses and people into moving to the Charlotte area Visually pleasing Completely interactive

4
Model of UNCC Campus with Textures and Elevation Model taken from UNCC Viscenter

5
Overview of My Part Extract building footprints from geography data we were given Create program to view and edit footprints Clean up and process the data Output the data for optimal access and rendering

6
Parsing the Data Footprints were in Shapefile format Did not allow access or modification, only viewing Wrote a parser to get all of the points and contours out and stored into customized data type

7
Parsing the Data File was in binary format rather than ASCII Had to learn about computer organization How data is stored (number of bytes, big vs. little endian)
.")
8
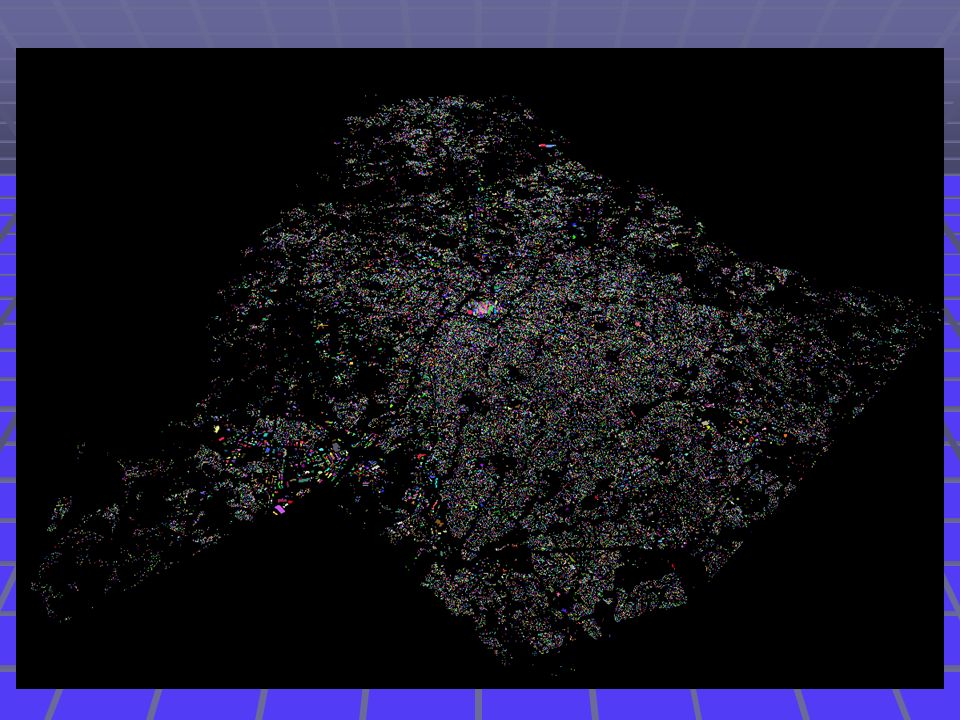
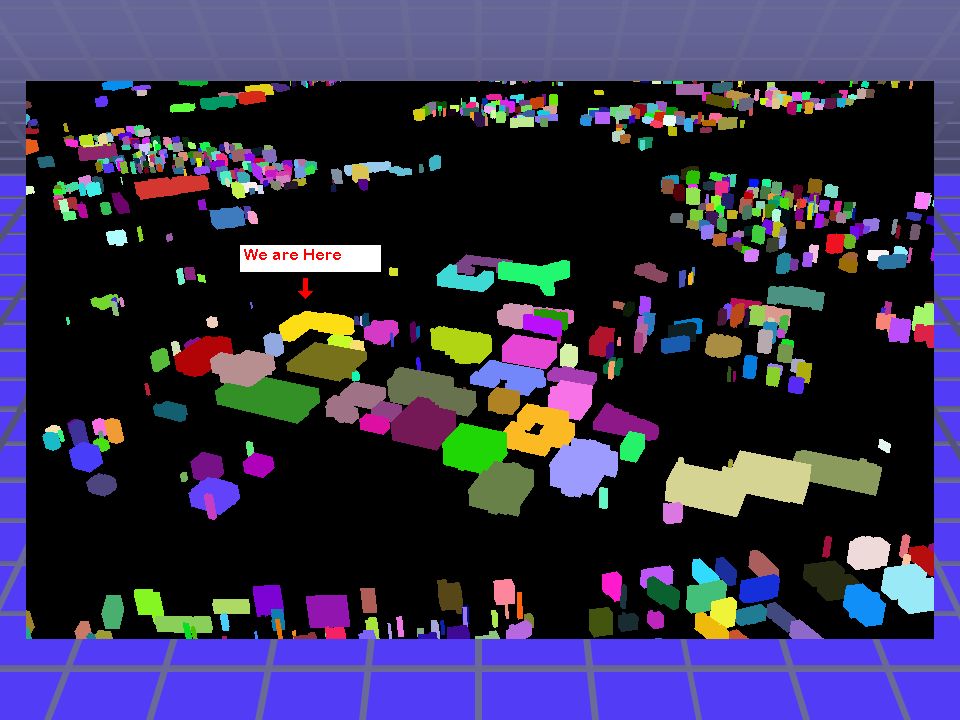
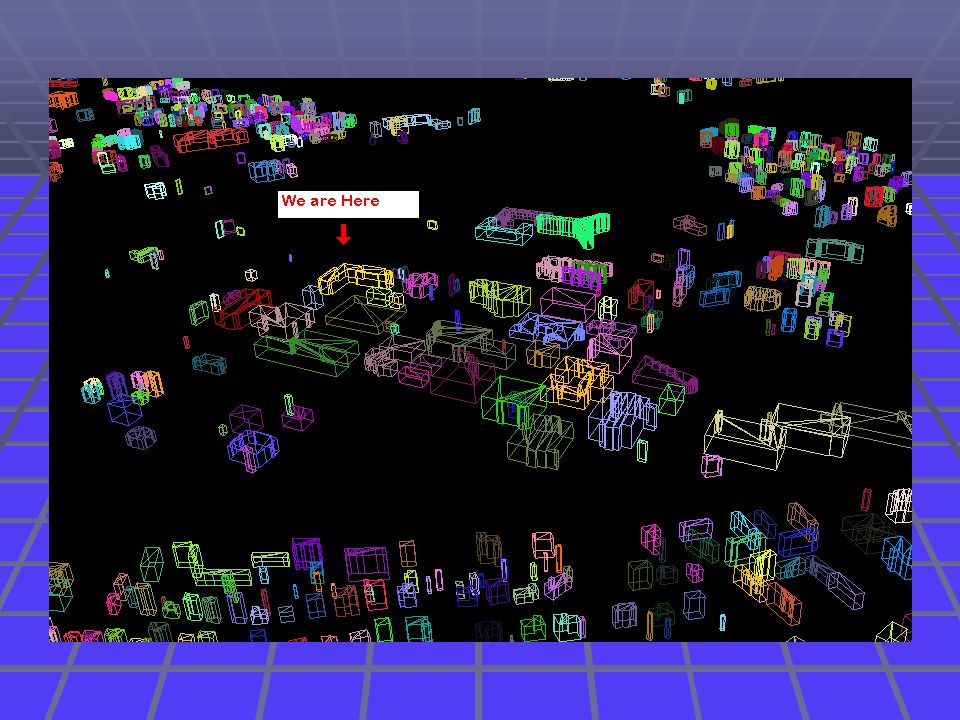
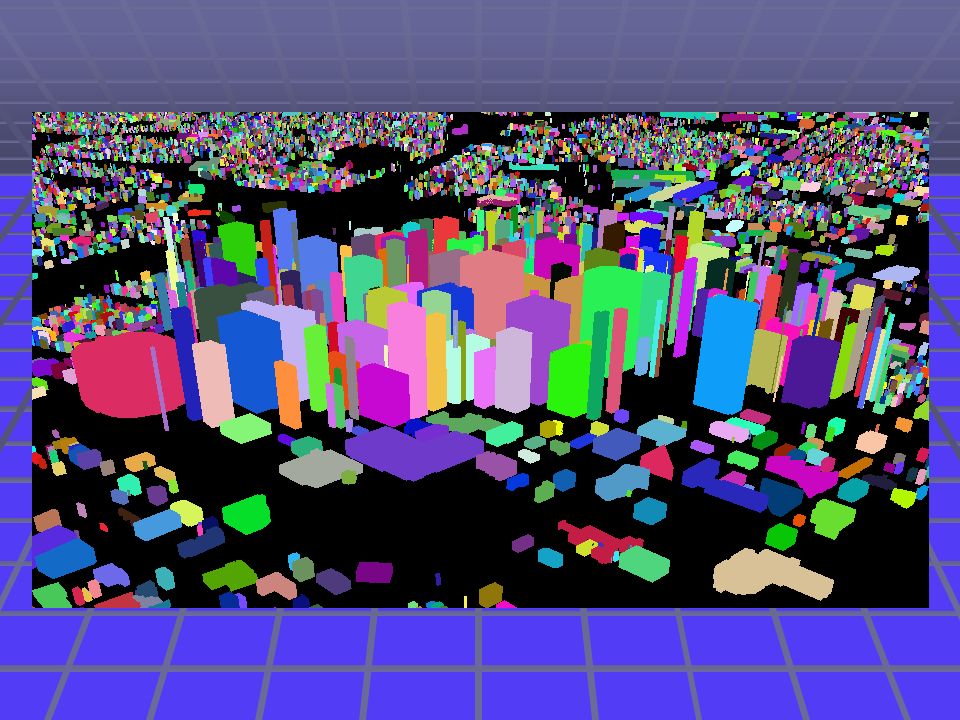
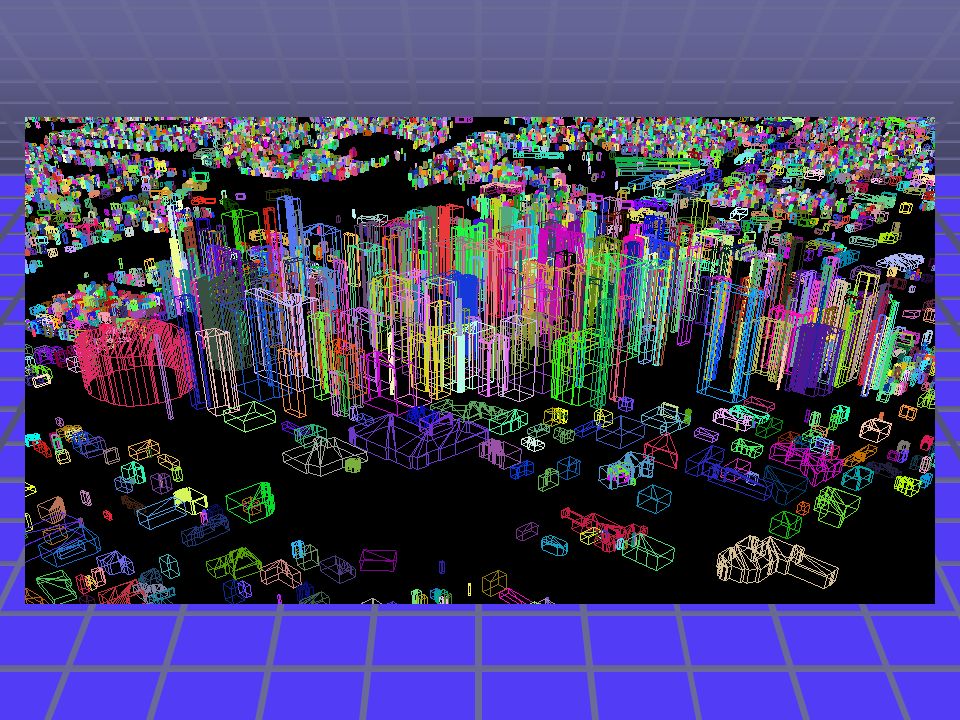
Viewing the Building Footprints Create simple viewing program Visualize data to check for correctness Gave buildings random colors to differentiate Gave buildings random height to be able to visualize the entire city in 3D

9
Viewing the Building Footprints Functionality needed: Zoom in and out Scroll through and rotate the map Focus in on predefined list of certain buildings Identify and center in on buildings by clicking on them

10
372,455 Buildings

16
Viewing the Building Footprints Open Graphics Library – standard environment for developing 2D and 3D graphics applications Utilized display lists – store rendering information on video card for increased performance

17
Cleaning Up the Data There were many problematic building outlines that required fixing Define, identify, and corrected problems

18
In line vertices (3 or more) If the angle formed between 2 edges is between 170° and 190°, middle vertex is deleted 60,493 In Line Vertices Erased out of 2.9 Million
 If the angle formed between 2 edges is between 170° and 190°, middle vertex is deleted 60,493 In Line Vertices Erased out of 2.9 Million")
19
Sharing multiple vertices Corrected first Merged into one building 5,101 cases

20
One vertex in common Separate common vertices by small amount 3,588 cases cases

21
Intersecting buildings Crossing edges, coincident edges Merged into one building 1,438 cases

22
Completely Surrounded Buildings Corrected last so all of the other cases were out of the way Deleted footprint on the inside, 606 cases

23
Cleaning Up the Data Researched geometric algorithms for detecting these situations Practiced strategies for decreasing the run time of these algorithms Only running tests if buildings are within a certain distance

24
Packaging and Output Convert all of the complex polygons into series of triangles using OpenGL’s tesselator Why triangles? Most efficient for rendering Simple, convex polygons Can apply textures to them easily Easy to package Saved data to binary format Documented simple yet efficient format for future use

25
Biggest Challenges Learning new languages C++ OpenGL Conducting graduate level research for the first time Freedom to explore new ideas Testing new concepts

Similar presentations
>")


 be a point. We want to estimate an elevation at a point q: 1. should.>")

, line features.>")


 Andrew Graff.>")

>")
 University of Texas at Arlington.>")
, line features.>")
