Download presentation
Presentation is loading. Please wait.

1
Sta220 - Statistics Mr. Smith Room 310 Class #18

2
Section 6-1 and 6-2 Notes

3
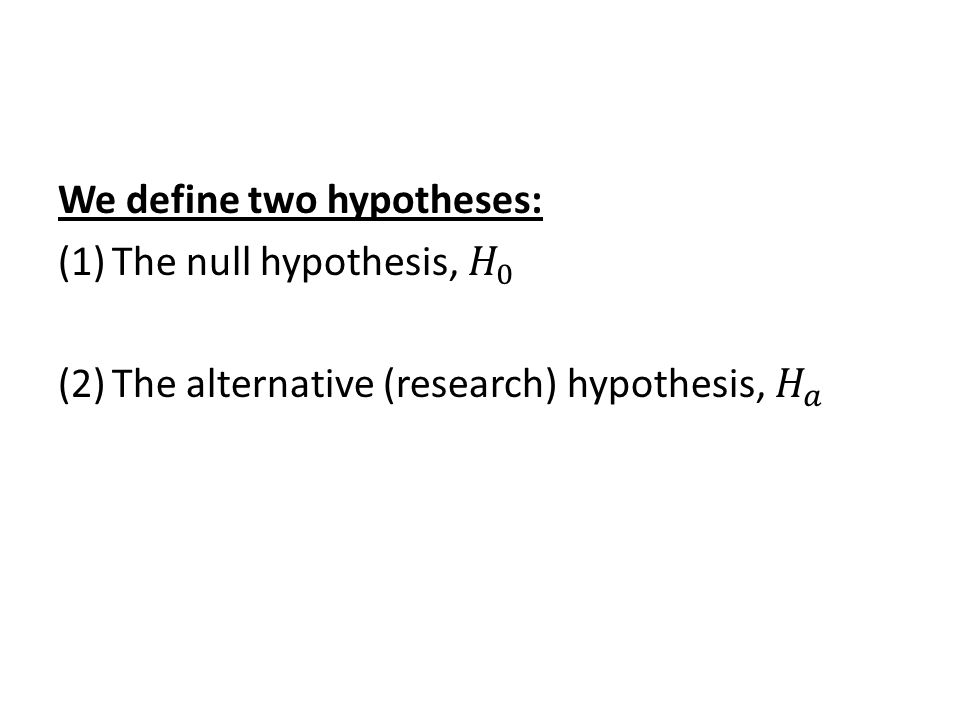
6-1: The Elements of a Test of Hypothesis

4
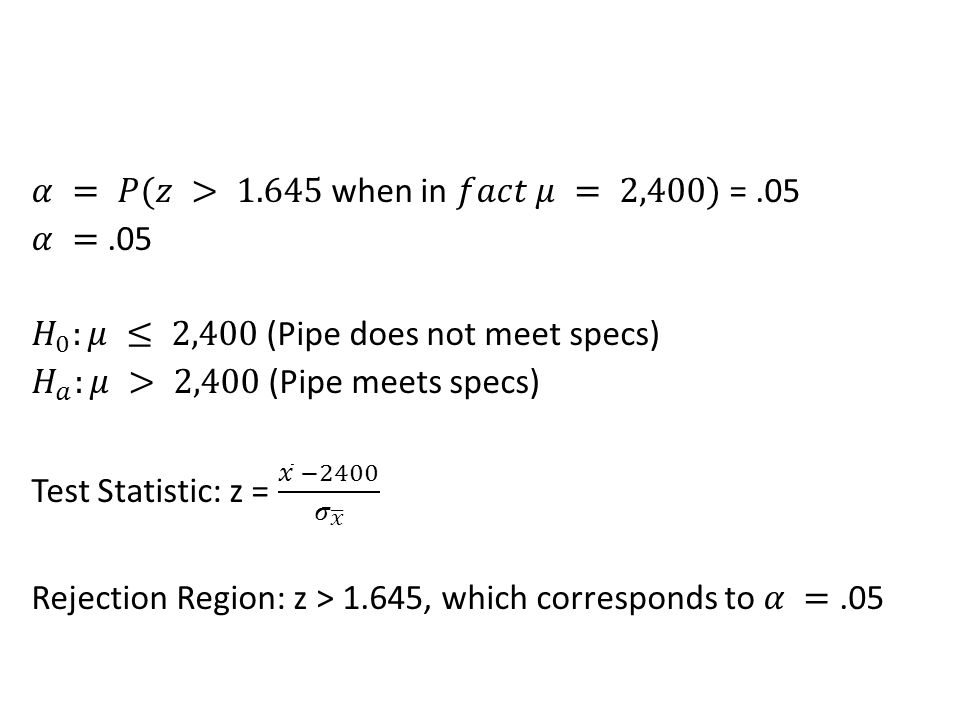
Suppose building specifications in a certain city require that the average breaking strength of residential sewer pipe be more than 2,400 pounds per foot of length. Each manufacturer who wants to sell pipe in that city must demonstrate that its product meets the specification.

6
A statistical hypothesis is a statement about the numerical value of a population parameter.

11
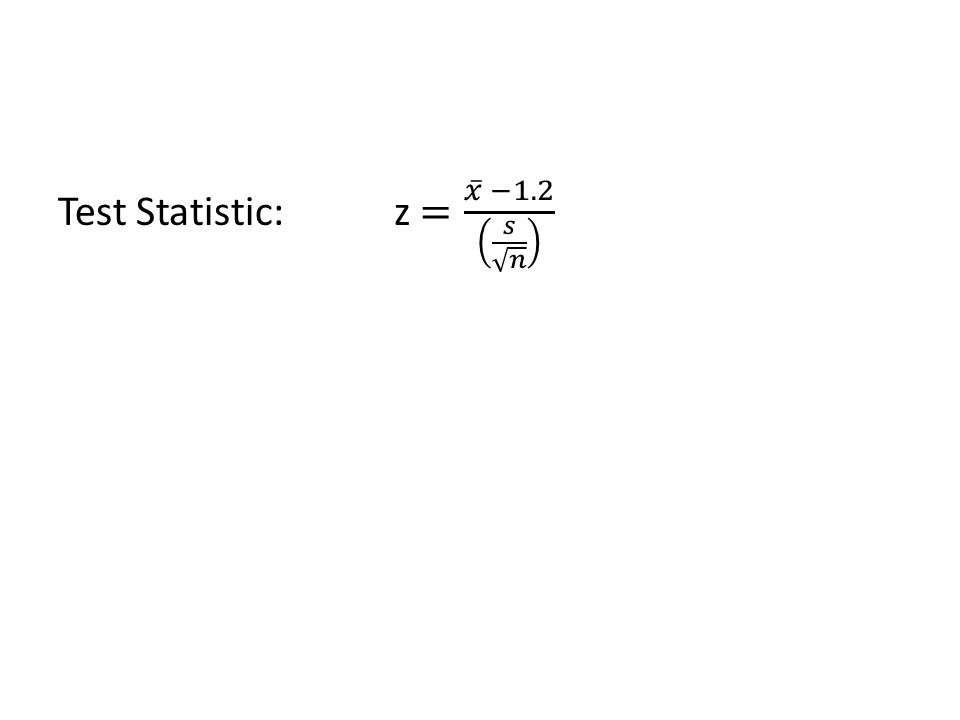
The test statistic is a sample statistic, computed from information provided in the sample, that the researcher uses to decide between the null and alternative hypotheses.

12
Test Statistic

15
What is the probability that this procedure will lead us to an incorrect decision? Such an incorrect decision – deciding that the null hypothesis is false when in fact it is true – this is called a Type I error.

16
TYPE I Error

20
Let test this.

26
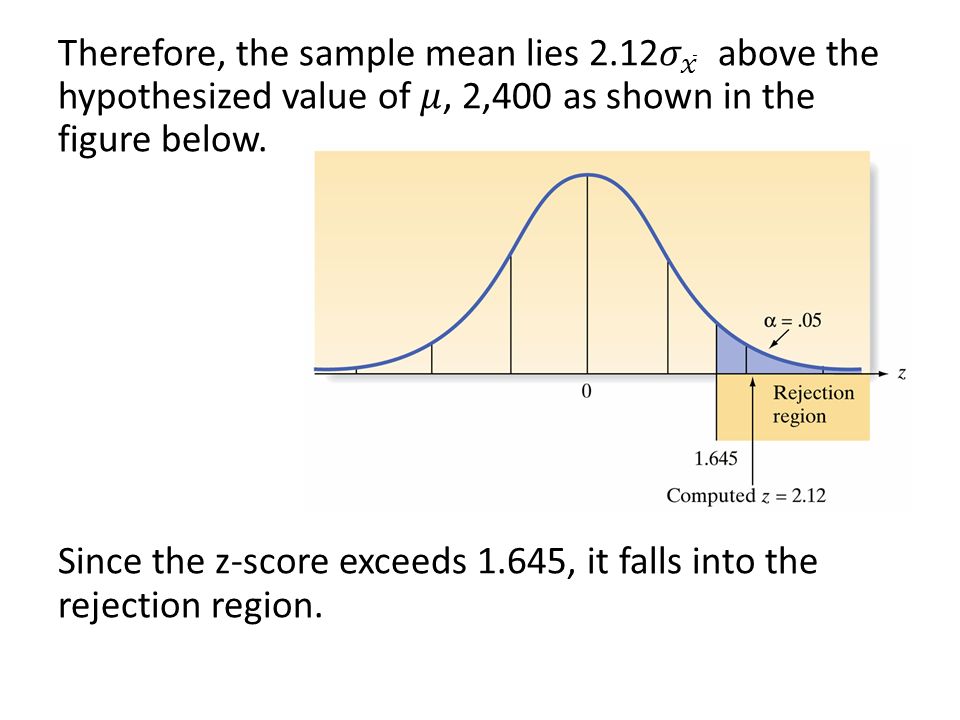
Even though the sample mean exceeds by 30 pounds per linear, it does not exceed the specification by enough to provide convincing evidence that the population mean exceeds 2,400.

30
Conclusions

31
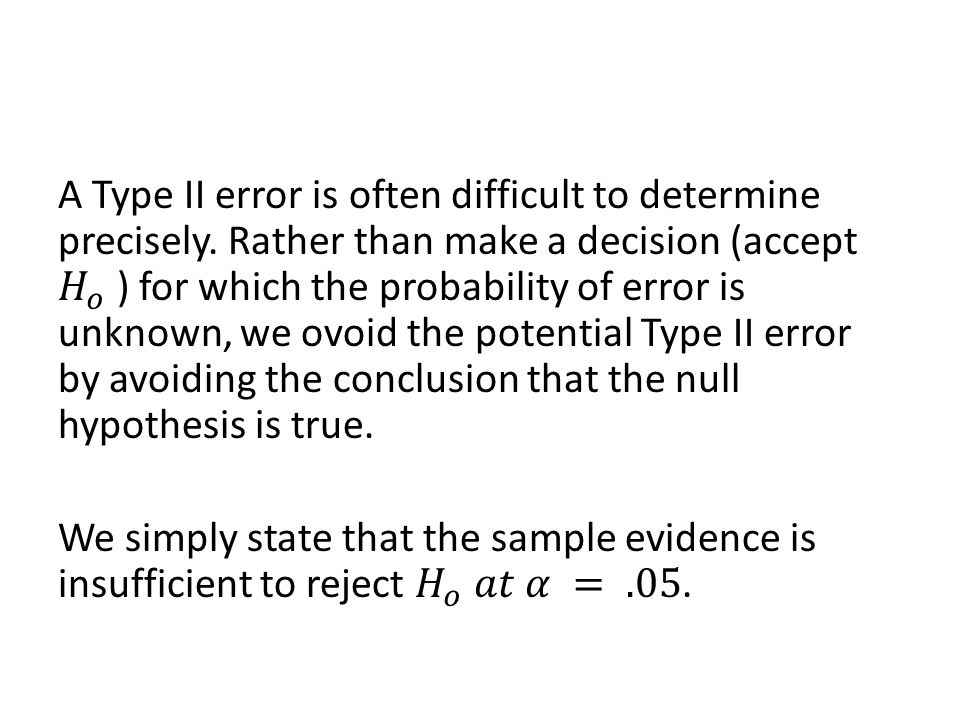
Type I error can be made ONLY when the null hypothesis is rejected in favor of the alternative hypothesis and a Type II error can be made ONLY when the null hypothesis is accepted.

32
Conclusions and Consequences for a Test of Hypothesis Conclusion True State of Nature Correct decision Correct Decision

33
Warning!!!

34
Copyright © 2013 Pearson Education, Inc.. All rights reserved. Procedure

35
6.2: Formulating Hypotheses and Setting Up the Rejection Region

36
Copyright © 2013 Pearson Education, Inc.. All rights reserved. Procedure

37
Copyright © 2013 Pearson Education, Inc.. All rights reserved.

38
Rejection regions corresponding to one- and two tailed tests

39
Copyright © 2013 Pearson Education, Inc.. All rights reserved. Table 8.2

40
Example 6.2.1 A metal lathe is checked and periodically by quality control inspectors to determine whether it is producing machine bearings with mean diameter of.5 inch. If the mean diameter of bearing is larger or smaller than.5 inch, then the process is out of control and must be adjusted. Formulate the null and alternative hypotheses for a test to determine whether the bearing production process is out of control.

41
Solution

42
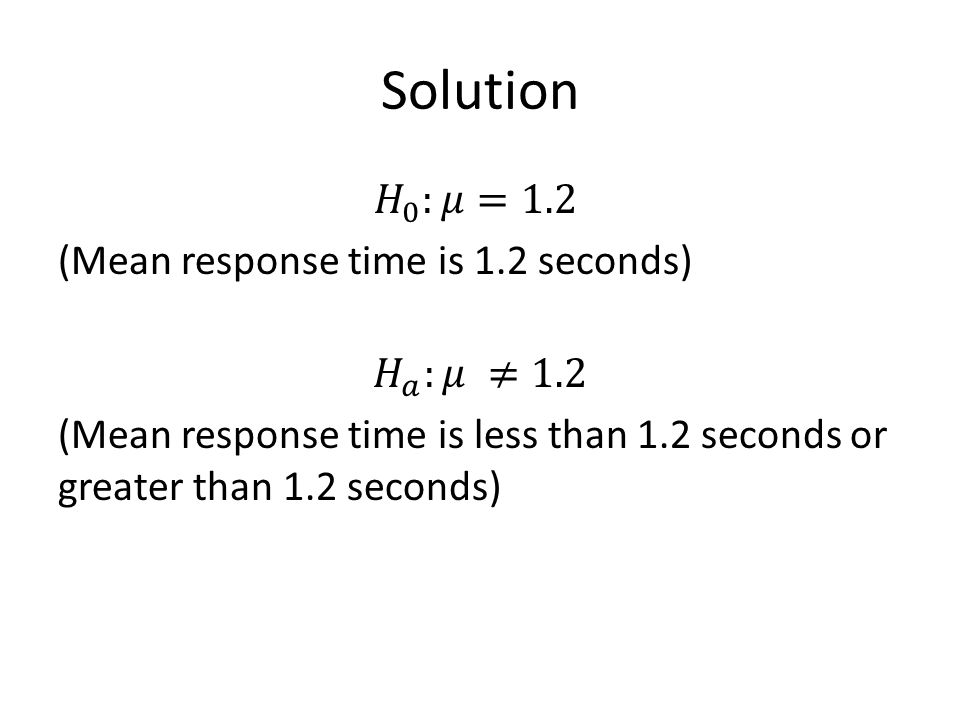
Example 6.2.2.

43
Solution

46
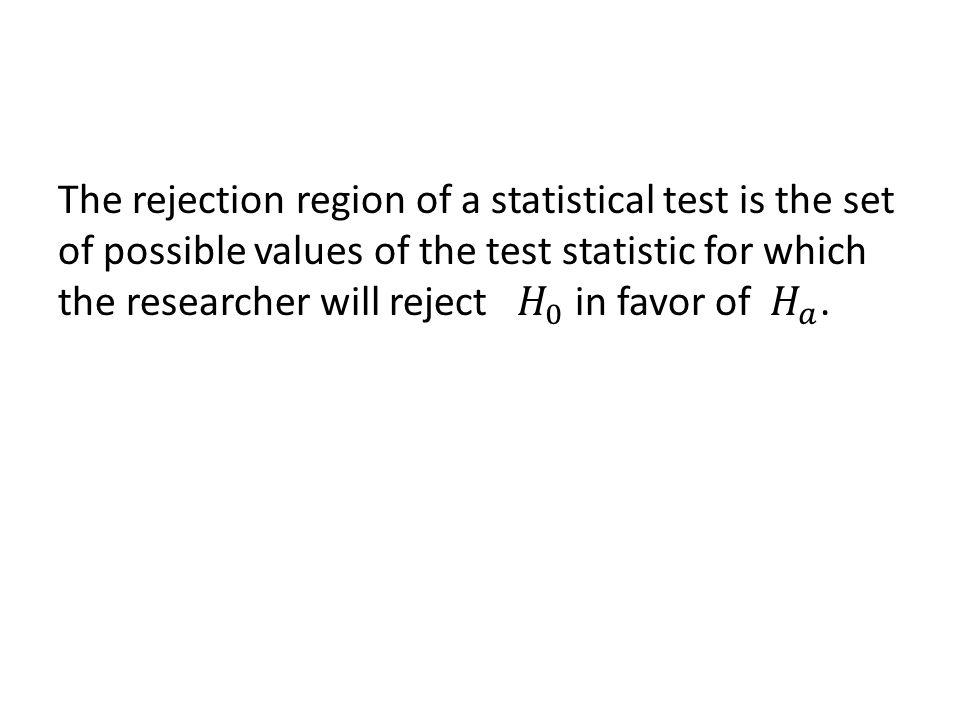
Rejection Region

47
Assumptions: Since the sample size of the experiment is large enough (n> 100), the CLT will apply and no assumptions need to be made about the population of response time measurements.
, the CLT will apply and no assumptions need to be made about the population of response time measurements.")
48
Copyright © 2013 Pearson Education, Inc.. All rights reserved. Two-tailed rejection region: =.01

49
Reminder: Homework 5.2 due today Homework 5.3 due today Homework 5.5 due today Quiz 5 Review due Wednesday May 7, 2014 Homework 5 Review due Wednesday May 7, 2014 Homework 6.2 due Friday May 9, 2014

Similar presentations


>")


 2004 Brooks/Cole, a division of Thomson Learning, Inc. Chapter 8 Tests of Hypotheses Based on a Single Sample.>")


