Download presentation
Presentation is loading. Please wait.

1
Units of Analysis The Basics

2
Outline An illustration Definitions Elements of the unit of analysis Complexity Data structure

3
An Illustration A group of students in an econometrics class were sent to the Data Library to find some data for an assignment.

4
An Illustration A typical request was like this one. “I want to look at crime rates and a person’s level of education.”

5
An Illustration crime rates are usually associated with spatial units or a time series a person’s education is an attribute of individuals This request raises problems.

6
An Illustration does the student want crime rates and the percentage of the population with certain education levels for specific cities? This would be data aggregated over geography. What are we looking for?

7
An Illustration does the student want the crime rate for one city over time, such as the number of homicides in Edmonton over the past 40 years. This would be data aggregated over time. What are we looking for?

8
An Illustration does the student want the education level of criminals? This would be a special subpopulation of individuals convicted of crimes and consist of a microdata file of criminals. What are we looking for?

9
An Illustration does the student want the education level of victims of crimes? This would be a special subpopulation of individuals who were victimized and consist of a microdata file of victims. What are we looking for?

10
An Illustration Looking at crime rates and level of education can differ depending upon the unit of analysis. individuals geographic areas changes over time

11
An Illustration After walking the student through these steps, he chose to build a model predicting income on the basis of highest educational attainment and a few other variables from the Census individual-level public use microdata file. He completely abandoned his interest in crime!

12
An Illustration Unfortunately, the student’s initial request not only failed to specify a clear unit of analysis, it included a mix of different units, which suggests that the concept was not understood.

13
The Point of the Illustration The unit of analysis is fundamental to the data and statistical reference interview. Early identification of the unit of analysis will help focus a search on (a) statistics, (b) aggregate data, or (c) microdata.
 statistics, (b) aggregate data, or (c) microdata..")
14
The Point of the Illustration Furthermore, the unit of analysis is fundamental to secondary data analysis. It may be that knowledge of the unit of analysis is even more crucial in secondary analysis than in primary analysis, where the unit is implicit in the sample design, if not otherwise explicit.

15
The Point of the Illustration Finally, the unit of analysis is a fundamental characteristic of statistical data structures, which are the formal ways in which data are organized for processing.

16
Where We’re Headed Let’s look closer at the concepts behind the unit of analysis and then we’ll look at how these concepts end up being converted into data structures.

17
Definitions The unit of analysis is the basic entity or object about which generalizations are to be made based on an analysis, and for which data have been collected

18
Definitions How does the unit of analysis relate to the unit of observation? The unit of observation is the entity in primary research that is observed and about which information is systematically collected.

19
Definitions The unit of observation and the unit of analysis are the same when the generalizations being made from a statistical analysis are attributed to the unit of observation.

20
Unit of Observation – in original data collections, the unit of observation is determined by the method by which observations are selected Unit of Analysis – in secondary analysis, the unit of analysis is determined by an interest in exploring or explaining a specific phenomenon Definitions

21
Identifying a Unit of Analysis As hinted in the earlier illustration, the unit of analysis is shaped by three attributes: – social entities – time – space

22
Research Outputs Let’s begin by looking at a finished product to examine these attributes more closely. We’ll use a table from the Health Indicators Database about suicide.

23
Social Characteristics Emphasized Geography and Time held constant

24
Ordered by Time Geography and Age held constant

25
Geography Emphasized Time and Age held constant

26
Social Entities observations of a single social entity, such as a person or an institution observations of multiple entities with a defined relationship, such as family, employer-employee

27
Social Phenomena transactional observations that are the result of actions among entities, such as labour strikes or international conflicts, including wars

28
Time observations made at one point in time; commonly referred to as a cross-sectional study

29
Time observations made at multiple points in time the data may be organized by time; commonly referred to as a time series time may structure some form of repeated measures of content or subjects

30
Space observations made within a specific spatial area observations made within a hierarchy of spatial areas

31
Substituting Units There may be requests for which data for a desired unit of analysis can’t be delivered but for which data are available summarized over one of the other attributes of the unit of analysis.

32
Substituting Units Example: Request for firm-level data for NAICS 312 Beverage and Tobacco Product Manufacturing Ideal source: microdata on companies from the Canadian Census of Manufacturers No access to enterprise microdata

33
Substituting Units Example: NAICS 312 Alternatives: are there aggregate data summarizing the firms within NAICS 312? Possibilities: summaries over time (time series) or geography (small- area business statistics)
 or geography (small- area business statistics).")
34
Complexity Complexity occurs when multiple entities are introduced within the same study. Examples parent child teacher person activities time person cars trips

35
Complexity Complexity can arise within one of the attributes just discussed. – a study of parents, children, and teachers, which are all social units or between attributes – a study of people, their daily activities, and the length of time of each activity

36
Complexity Complexity is often represented in an hierarchy when the units can be grouped or nested within one another. For example, children may be grouped with their parents.

37
Complexity Children grouped (nested) with Parents. Parent 1Parent 2 Child 1Child 2Child 3
 with Parents. Parent 1Parent 2 Child 1Child 2Child 3")
38
Complexity Parents and their children may be grouped into families and families grouped into households. Household 1 Family A Person i Person ii Household 2 Family A Person i Person ii

39
Complexity Complexity may also be represented by combinations of entities among units. Those entities that are associated with one another are combined and those that aren’t associated, aren’t combined.

40
Complexity These combinations are often described as having been crossed. For example, activities may be crossed with people.

41
Complexity Activities crossed with people. Activity 1Activity 2 Activity 4 Activity 3 Activity 5Activity 6 X = Person B Person A Person A Activity 3 Activity 6 Person B Activity 1 Activity 5

42
Complexity Up to this point, complexity has been described conceptually. We’ve mentioned how complexity can be created through multiple units of analysis and the ways in which these units are related.

43
Complexity Complexity also manifests itself structurally through the ways in which data are organized to represent the nesting or crossing of multiple units of analysis.

44
Thinking about Units of Analysis Conceptually – What is the content? This is what we’ve been reviewing up to this point. Structurally – How is this complexity organized? This takes us to a discussion about data structure.

45
Let’s review basic data structure. The unit of analysis defines the underlying structure of a data file. Statistical Data Structure

46
This structure consists of a series of rows with each row containing the data of one member of the unit of the unit of analysis. This simple structure is known as the flat, rectangular data matrix. Statistical Data Structure

47
Case 1 Case 2 Case 3 * Case n * * Case n-1 Statistical Data Structure

48
All of the information collected for each member of the unit of analysis is organized in a fixed location in the file called fields or variables. Statistical Data Structure

49
Case 1 Case 2 Case 3 * Case n * * Field 1 * Field2 Field 3 * Field k-1 Field k Case n-1 Statistical Data Structure

50
Case 1 Case 2 Case 3 * Case n * * Field 1 * Field2 Field 3 * Field k-1 Field k Case n-1 Statistical Data Structure

51
This structure looks like the grid of a spreadsheet. However, there is one very important difference between a statistical data structure and a spreadsheet. Statistical Data Structure

52
The spread sheet is organized around individual cells, while the statistical data structure is organized around the rows. Statistical Data Structure

53
Spreadsheet Statistical Data Structure

54
Cell B2 Cell E3 Cell C5 Cell F7 Spreadsheet Statistical Data Structure

55
Row 1 Row 3 Row k-1 Statistical Data Structure

56
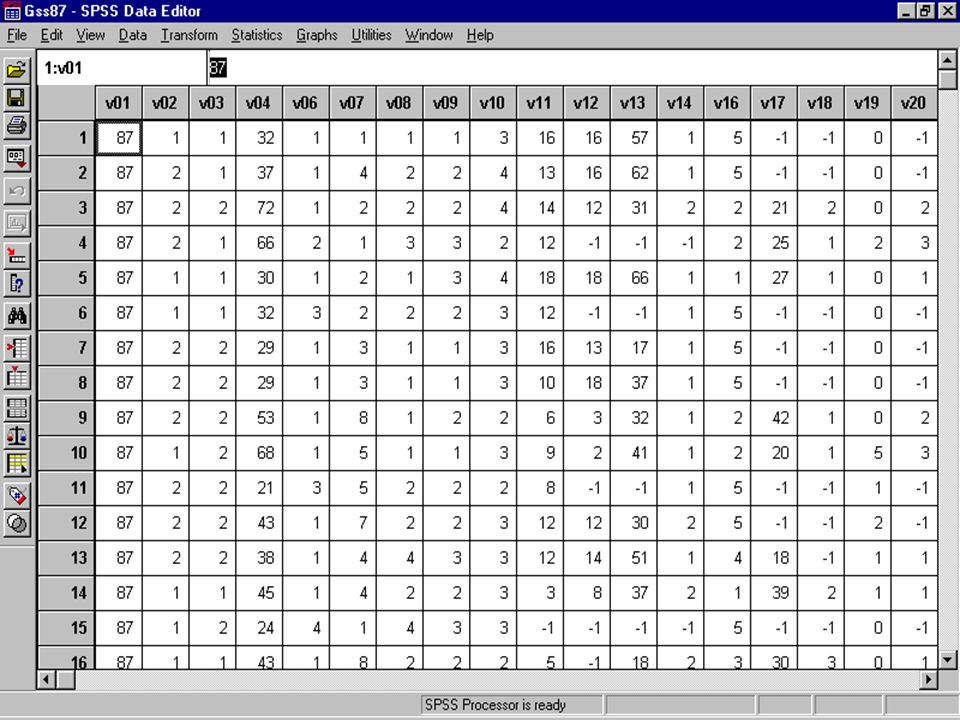
The next slide presents the way that this simple statistical data structure appears in SPSS. Statistical Data Structure

58
Row 1

59
Row 8

60
Row 1 Row 8 Row 15

61
Row 1 Row 8 Row 15 Field 8

62
00001 1698957146206912669121413072202511 00002 2122943624103005230120703022303521 00003 617378410203706337121406032202511 00004 1519625424202804228069797974410620 00005 1695875212202303123521003022403121 00006 1737832824203806338649797971407550 00007 884349547103005230320703022403521 00008 760621824203005230069797971101570 00009 5814763024102604226369797973310620 00010 1234850712204407344949797972212570 Person: GSS 10 Main

63
00001 1698957146206912669121413072202511 00002 2122943624103005230120703022303521 00003 617378410203706337121406032202511 00004 1519625424202804228069797974410620 00005 1695875212202303123521003022403121 00006 1737832824203806338649797971407550 00007 884349547103005230320703022403521 00008 760621824203005230069797971101570 00009 5814763024102604226369797973310620 00010 1234850712204407344949797972212570 RECID WGHTFNL PROV DVSEX DVAGECAP

64
Adding Complexity to Data Structurally, three methods are used: – hierarchical : different record types for separate unit of analysis, each with a different record layout, in the same file – relational : 1 to n relations identified through keys or linkage variables in multiple files – compound records : combination of units crossed on a single record

65
Complex Data Structure Household 1 Person 1 Person 2 Household 2 Household 3 Person 1 Person 2 Person 3 Hierarchical Data Structure

66
4600000000000 000000 00000000 4600100000000 000000 00000000 4600100105024RM 024000 5010 82090000 4600100205024RM 024000 5010 82090000 4600100305024RM 024000 5010 82090000 4600100405027T 024000 5010 82090410 4600100505027T 024000 5010 82090410 4600100605027T 024000 5010 82090410 4600100705031RM 031000 5011 82100000 4600100805031RM 031000 5011 82100000 Geography: 1991 Census N9101 Population 15 years and over by age groups (17) and marital status (6a), showing labour force activity (8) and sex (3)
 and marital status (6a), showing labour force activity (8) and sex (3)")
67
4600000000000 000000 00000000 4600100000000 000000 00000000 4600100105024RM 024000 5010 82090000 4600100205024RM 024000 5010 82090000 4600100305024RM 024000 5010 82090000 4600100405027T 024000 5010 82090410 4600100505027T 024000 5010 82090410 4600100605027T 024000 5010 82090410 4600100705031RM 031000 5011 82100000 4600100805031RM 031000 5011 82100000 PROVFED EACDCSD CSD Type CCS CMA/CA

68
4600000000000 000000 00000000 4600100000000 000000 00000000 4600100105024RM 024000 5010 82090000 4600100205024RM 024000 5010 82090000 4600100305024RM 024000 5010 82090000 4600100405027T 024000 5010 82090410 4600100505027T 024000 5010 82090410 4600100605027T 024000 5010 82090410 4600100705031RM 031000 5011 82100000 4600100805031RM 031000 5011 82100000 PROVFED EACDCSD CSD Type CCS CMA/CA

69
Complex Data Structure Relational Data Structure R1 R2 R3 R4 R5 R1 C1 R1 C2 R1 C3 R1 C4 R3 C1 R3 C2 R4 C1 R5 C1 R5 C2 One to Many

70
00001111691222444214 00002111301121944207 00003111371229344214 00005111235220944210 00006113386228044104 00007111303120344207 00008313300218544210 00008323300223533109 00010113449219344209 00010323449232022208 00001 16989571462069 00002 21229436241030 00003 6173784102037 00004 15196254242028 00005 16958752122023 00006 17378328242038 00007 8843495471030 00008 7606218242030 00009 58147630241026 00010 12348507122044 GSS 10 MainGSS 10 Union

71
00001111691222444214 00002111301121944207 00003111371229344214 00005111235220944210 00006113386228044104 00007111303120344207 00008313300218544210 00008323300223533109 00010113449219344209 00010323449232022208 GSS 10 MainGSS 10 Union 00001 16989571462069 00002 21229436241030 00003 6173784102037 00004 15196254242028 00005 16958752122023 00006 17378328242038 00007 8843495471030 00008 7606218242030 00009 58147630241026 00010 12348507122044

72
Complex Data Structure Crossed Data Structure R1 x T1 x A1R1 x T2 x A4R1 x T3 x A7R1 x T4 x A3R1 x T4 x A1R2 x T1 x A2R2 x T2 x A9

73
000041144504000800024010000000012518733 000041144308000900006011222220012518733 000041141709000930003031222220012518733 000041141709301100009031222220012518733 000041141211001330015011222220012518733 000041149113301630018011222220012518733 000041141216301800009011222220012518733 000041143018002000012031222220012518733 000041147920002015001541222220012518733 000041143720152130007531222220012518733 GSS 2 Episode

74
000041144504000800024010000000012518733 000041144308000900006011222220012518733 000041141709000930003031222220012518733 000041141709301100009031222220012518733 000041141211001330015011222220012518733 000041149113301630018011222220012518733 000041141216301800009011222220012518733 000041143018002000012031222220012518733 000041147920002015001541222220012518733 000041143720152130007531222220012518733 SEQNUM DDAY NO_EPISO ACT_CODE

75
000041144504000800024010000000012518733 000041144308000900006011222220012518733 000041141709000930003031222220012518733 000041141709301100009031222220012518733 000041141211001330015011222220012518733 000041149113301630018011222220012518733 000041141216301800009011222220012518733 000041143018002000012031222220012518733 000041147920002015001541222220012518733 000041143720152130007531222220012518733 SEQNUM DDAY NO_EPISO ACT_CODE

76
We’ll now use this background to look at the files in the Canadian Travel Survey. Complex Data Structure

Similar presentations