Download presentation
Presentation is loading. Please wait.

1
Diabetes Data Dilemmas: Diabetes Prevention and Control Kansas Diabetes Quality of Care Project Seventh Annual Disease Management Colloquium Philadelphia, PA May 8, 2007 Marti Macchi, MEd, Director, Special Studies Kansas Department of Health and Environment Joe Brisson, Vice President Client Services Browsersoft

2
Outline Project Rationale Statewide Project Project Components First Year Outcomes Data Translated Into Practice Future Direction Open HRE™ Project

3
Project Rationale Data – Decision Support

4
Burden of Diabetes in Kansas 2005 – 7.0% Adult Kansans diagnosed with diabetes 7 th Leading cause of death (683 Kansans died of diabetes in 2004) Estimated direct and indirect costs of diabetes were nearly $1.3 billion a year 2004 Kansas Behavioral Risk Factor Surveillance System, KDHE. Center for Health & Environmental Statistics,Office of Vital Statistics KDHE, 2004 Lewin Group, Inc., American Diabetes Association,, 2002

5
Average Yearly Health Care Cost United States 2002 Source: Hogan P etal. Economic Cost of Diabetes in the U.S.in 2002. American Diabetes Association. Diabetes Care. 26: 917-932, 2003.

6
Costs Associated with Poorly Controlled Versus Well Controlled Diabetes A1c Level Adult with Diabetes Adult with Diabetes, Hypertension & Heart Disease 6% (normal) $8,576$38,726 7% (goal) $8,954$40,230 8% $9,555$42,467 9% $10,424$45,557 10% $11,629$49,673 Average Medical Care Over 3 Year Period Source: Gilmer, Todd P, et al. Diabetes Care 1997; Vol. 20, No. 12.

7
Kansas Diabetes Prevention & Control Program Objectives By 2008, increase the rate of: HbA1c test69.1 % to 83.0 % Annual foot exam60.8% to 83.0% Dilated eye exam67.5% to 83.0% Recommended annual pneumococcal immunization 49.3% to 51.6% Recommended annual influenza immunization 60.7% to 63.5%

8
Statewide Project

9
Rawlins CheyenneDecaturNortonPhillipsSmithJewell Republic WashingtonMarshallNemaha Brown Doniphan ShermanThomasSheridanGrahamRooksOsborneMitchell Cloud Ottawa Clay Morton WallaceLoganGoveTregoEllisRussell Lincoln Ellsworth Saline GreeleyWichitaScottLaneNess Rush Barton Rice McPher- son HamiltonKearneyFinney StantonGrantHaskell StevensSeward Gray MeadeClark Ford Hodgeman Comanche Kiowa Edwards Pawnee Stafford Pratt Reno Kingman HarperBarber Harvey Sumner Sedgwick Cowley Butler Chautauqua Mont- gomery LabetteCherokee Elk WilsonNeosho Greenwood Crawford Bourbon Linn Allen Miami Anderson Franklin Wood- son Lyon Coffey Osage Marion Chase Dickinson Morris Geary Waubaunsee Pottawatomie Riley Jackson Shawnee Atchison Leavenworth DouglasJohnson Jefferson Stafford Reno Kansas Diabetes Quality of Care Project Sites

10
Project Organization Demographics 68 funded organizations 90 sites statewide 350 participating health professionals 50% of Kansas’ counties represented Diverse organizations participating Over 4,000 patients with Diabetes

11
Types of participating organizations: Local Health Departments Community Health Clinics Safety Net Clinics American Indian Health Clinic Home Health Agencies Hospital Affiliated Practices Private Practices Farmworker Program Promotora Program Project Organization Demographics – cont’d

12
Project Components First Year-----Process Chronic Care Model Training Chronic Disease Electronic Management System (CDEMS) Training Data Entry and Analysis Quarterly Reports Office Protocol Development Encouraged Diabetes Teams Encouraged Regular Team Meetings Encouraged Monthly Conference Calls Site Visits
 Training Data Entry and Analysis Quarterly Reports Office Protocol Development Encouraged Diabetes Teams Encouraged Regular Team Meetings Encouraged Monthly Conference Calls Site Visits")
13
Project Components Second Year-----Outcomes Advanced CDEMS Training Advanced Data Analysis Diabetes Teams Established Regular Team Meetings Documented Office Protocols Implemented Monthly Conference Calls Improved Quality of Care Measures

14
The Chronic Care Model

15
Chronic Care Model Components Health Care Organization Delivery System Design Decision Support Self-Management Support Community Resources Clinical Information System

16
CDEMS How does it work? Patient Data Entered % of Patients Receiving Vaccinations and Foot Exams Needs Improvement Hard copy inserted into patient’s chart Dr. updates patient’s chart

17
First Year Outcomes Health Care Organization Outcomes1st quarter4 th quarter% change Quantifiable goals for quality of care provided to Patients 45%66%46% Holding routine diabetes team meetings 42%60%42% Organizations Checking Yes on the Quarterly Office Self-Assessment Form

18
Delivery System Design Outcomes1st quarter4 th quarter% change Routinely ask patients to remove socks and shoes before exam 39%69%76% Non-physician staff allowed to do foot exam 36%39%8% All patients scheduled for follow-up 60% - Non-physician staff empowered to order overdue labs 36%54%50% Non-physician staff empowered to administer flu and pneumonia vaccinations 48%57%18% First Year Outcomes Cont’d…. Organizations Checking Yes on the Quarterly Office Self-Assessment Form

19
Decision Support Outcomes1st quarter4 th quarter% change CDEMS used to make decisions about needed care for patients 36%54%50% First Year Outcomes Cont’d…. Self-management Support Outcomes1st quarter4 th quarter% change Patients routinely know their targets for blood pressure, finger stick blood sugar, and HbA1 18%54%200% Provide resources for patients to allow them to be full partners in their care 42%69%64% Organizations Checking Yes on the Quarterly Office Self-Assessment Form

20
Clinical Information Systems Outcomes1st quarter4 th quarter% change Use CDEMS to record patients with eye exams, foot exams, HbA1c, flu and pneumonia vaccinations 45%75%66% Use CDEMS as a reminder system to prompt when a patient is due for labs or visit 27%42%55% First Year Outcomes Cont’d…. Community Resources Outcomes1st quarter4 th quarter% change Develop partnerships in the community for referral 39%51%30% Organizations Checking Yes on the Quarterly Office Self-Assessment Form

21
Patient Office Visits 1 st Year Results 2005-2006 - CDEMS Data, Office of Health Promotion (KDHE)
")
22
Age Demographics 1 st Year Results 2005-2006 - CDEMS Data,Office of Health Promotion (KDHE)
")
23
Ethnicity 1 st Year Results 2005-2006 - CDEMS Data, Office of Health Promotion (KDHE)
")
24
Insurance 1 st Year Results 2005-2006 - CDEMS Data, Office of Health Promotion (KDHE)
")
25
Body Mass Index Body Mass Index is defined as weight in kilograms divided by height in meters squared (kg/m 2 ) 1 st Year Results 2005-2006 - CDEMS Data, Office of Health Promotion (KDHE)
 1 st Year Results CDEMS Data, Office of Health Promotion (KDHE)")
26
Comorbidity/Complication Profile of Patients Comorbidity/ComplicationPercentage (%) Hypertension56.5 Hyperlipidemia56.3 Heart Disease/Coronary Artery Disease 12.5 Neuropathy9.6 Nephropathy4.6 Peripheral Vascular Disease3.9 Cerebrovascular Disease (stroke)3.7 Retinopathy3.5 1 st Year Results 2005-2006 - CDEMS Data, Office of Health Promotion (KDHE)
 Hypertension56.5 Hyperlipidemia56.3 Heart Disease/Coronary Artery Disease 12.5 Neuropathy9.6 Nephropathy4.6 Peripheral Vascular Disease3.9 Cerebrovascular Disease (stroke)3.7 Retinopathy3.5 1 st Year Results CDEMS Data, Office of Health Promotion (KDHE)")
27
Specialty Care Received 1 st Year Results 2005-2006 - CDEMS Data, Office of Health Promotion (KDHE)
")
28
Preventive Care Practices 1 st Year Results 2005-2006 - CDEMS Data, Office of Health Promotion (KDHE)
")
29
HbA1c Levels 1 st Year Results 2005-2006 - CDEMS Data, Office of Health Promotion (KDHE)
")
30
Data Translated Into Practice - at the clinic level New office protocols in all organizations Diabetes patient newsletters Patient certificates for improved A1c Pre-visit patient self-assessment programs CDEMS data used to guide team decisions Improved communication among providers Separate diabetes clinic days established Patients made full partners in care

31
Data Translated Into Practice - at the community level Pre-Diabetes Screening Programs Community health fairs Churches Cattle and hog processing plants New Community Partnerships YMCA Podiatrists Optometrists Dentists Community Diabetes Education Programs Targeting seniors Targeting overweight/obese

32
Project Direction Continue to add organizations Provide technical assistance to practices to further improvements in diabetes indicators Collaborate with other chronic disease programs (Hypertension quality of care project) Explore collecting primary prevention data Explore interfacing CDEMS with EHR OpenHRE™ expansion (Pilot to additional clinics)
 Explore collecting primary prevention data Explore interfacing CDEMS with EHR OpenHRE™ expansion (Pilot to additional clinics)")
33
OpenHRE™ Pilot Project Process Problem Method of data collection was not efficient (manual spreadsheets) Accuracy of information obtained was affected due to inconsistent data collection and submission Timeliness to aggregate data Reporting – limited to MS Excel
 Accuracy of information obtained was affected due to inconsistent data collection and submission Timeliness to aggregate data Reporting – limited to MS Excel")
34
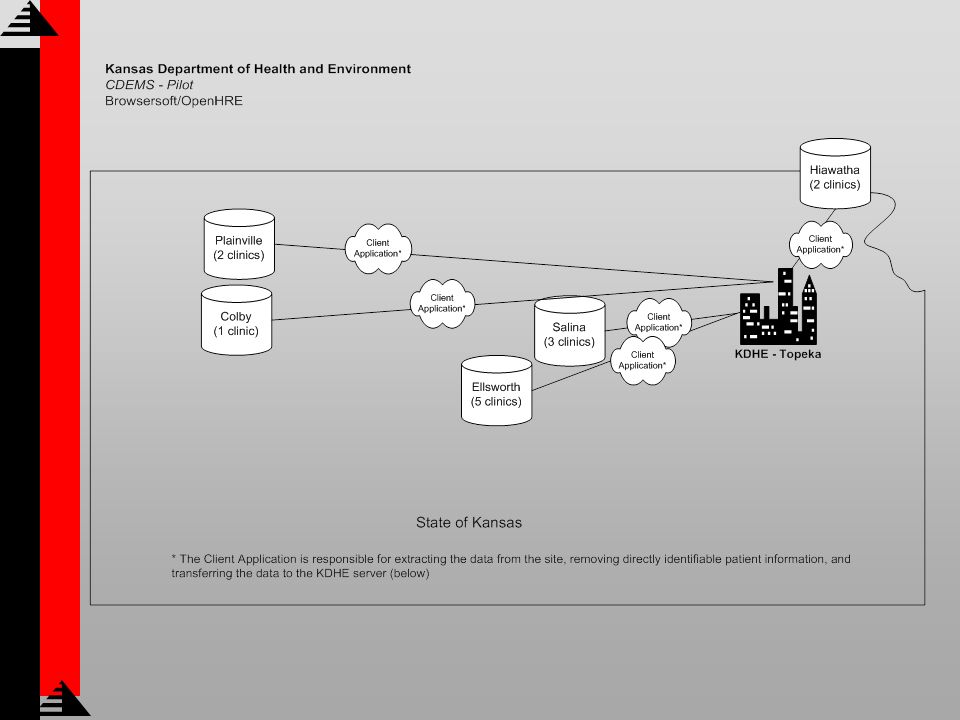
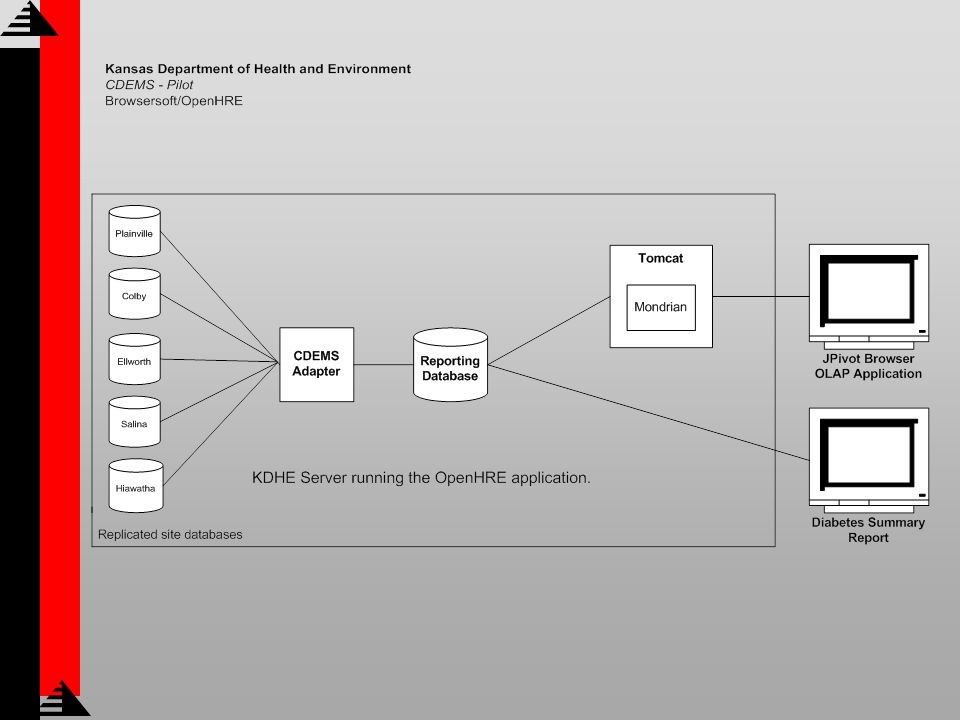
About OpenHRE™ OpenHRE Community - is a consortium of communities and organizations working together to achieve secure and sustainable Health Record Exchanges. OpenHRE™ - toolkit consists of three configurable services that connect existing data sources for Health Information Exchange. The OpenHRE™ toolkit is available for download as free, open source software.

35
OpenHRE™ Pilot Project Pilot Deployment Collect data from 5 rural sites representing 13 clinics (1,408 patients) Remove directly identifiable patient data Create web-based Diabetes Summary Report Implement OLAP Reporting
 Remove directly identifiable patient data Create web-based Diabetes Summary Report Implement OLAP Reporting")
38
Diabetes Summary Report Parameters Screen

39
Diabetes Summary Report Report Output

40
OLAP Reporting Tool Parameters Screen

41
OLAP Reporting Tool Sample Output

42
OLAP Reporting Tool Sample Graph Output

43
Problems Addressed Process Problems Method of data collection was not efficient (manual spreadsheets) Eliminated manual entry for participating clinics Accuracy of information obtained was affected due to inconsistent data collection and submission Automated collection occurs monthly or more frequently if desired Timeliness to aggregate data Nightly updates as new data arrives Reporting – limited to MS Excel Parameter driven Diabetes Summary Report OLAP tool for Data Analysis Open source software provides a cost effective deployment Reusability Sustainable
 Eliminated manual entry for participating clinics Accuracy of information obtained was affected due to inconsistent data collection and submission Automated collection occurs monthly or more frequently if desired Timeliness to aggregate data Nightly updates as new data arrives Reporting – limited to MS Excel Parameter driven Diabetes Summary Report OLAP tool for Data Analysis Open source software provides a cost effective deployment Reusability Sustainable")
44
Contact Information Marti Macchi, MEd Director of Special Studies Kansas Department of Health and Environment MMacchi@kdhe.state.ks.us Joe Brisson Browsersoft, Inc. Vice President of Client Services joeb@browsersoft.com

Similar presentations


 Asthma.>")


 Coco Lukas, MPH – Quality Coordinator Rick Reifenberg,>")


 90 consecutive days within the calendar year Reporting.>")
