Download presentation
Presentation is loading. Please wait.

1
Demographic Profile Faculty, Staff, Students

2
UA Faculty & Staff Demographics

3
Faculty Demographics Faculty includes the Fayetteville Campus and the Agricultural Experiment Station only; includes Visiting, Clinical and Adjunct *This category was not available in 1997

4
Staff Demographics Staff includes Fayetteville campus only *This category was not available in 1997

5
Degree Seeking New Freshman Class

6
Total Enrollment

7
Degree Seeking New Freshman Class ACT Scores ACT > 30ACT 25-30ACT 19-24ACT < 19 Fall 1997Fall 2007

8
Degree Seeking African American New Freshman ACT Scores ACT > 30ACT 25-30ACT 19-24ACT < 19 Fall 2007Fall 1997

9
Degree Seeking New Freshman Class ACT Scores ACT > 30ACT 25-30ACT 19-24ACT < 19 Fall 2006Fall 2007

10
Degree Seeking African American New Freshman ACT Scores ACT > 30ACT 25-30ACT 19-24ACT < 19 Fall 2007Fall 2006

11
Degree Seeking New Freshman High School GPA Fall 2007Fall 1997 HSGPA >=3.75HSGPA 3.50 – 3.74 HSGPA 3.00 – 3.49HSGPA <3.00

12
Degree Seeking New Freshman High School GPA Fall 2007Fall 2006 HSGPA >=3.75HSGPA 3.50 – 3.74 HSGPA 3.00 – 3.49HSGPA <3.00

13
Degree Seeking African American New Freshman High School GPA Fall 2007Fall 1997 HSGPA >=3.75HSGPA 3.50 – 3.74 HSGPA 3.00 – 3.49HSGPA <3.00

14
Degree Seeking African American New Freshman High School GPA Fall 2007Fall 2006 HSGPA >=3.75HSGPA 3.50 – 3.74 HSGPA 3.00 – 3.49HSGPA <3.00

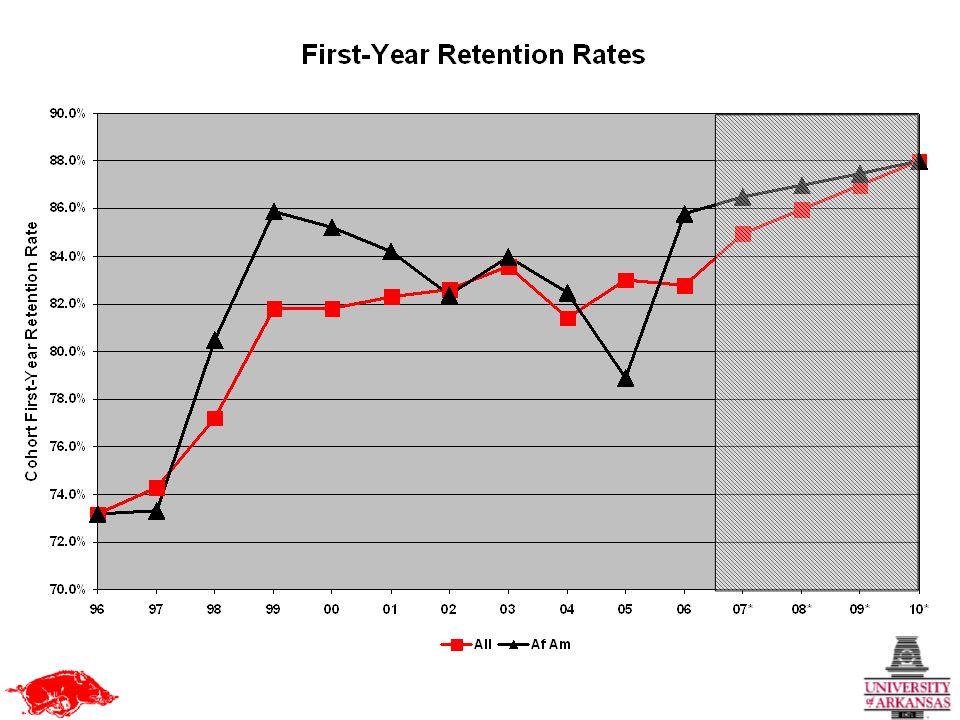
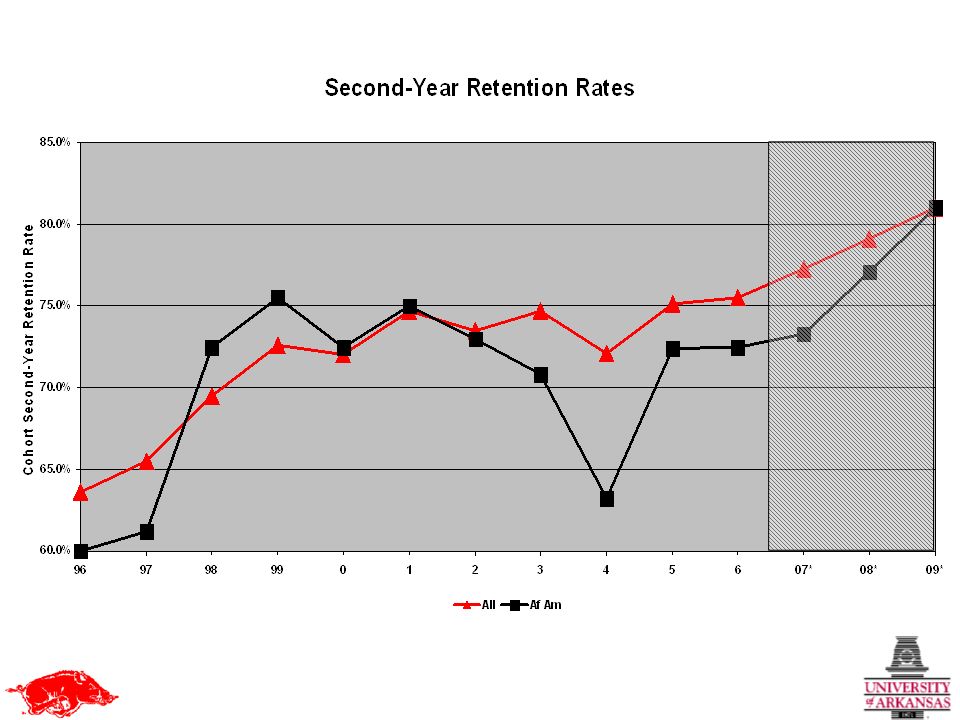
15
First Year Retention Rate by Ethnicity 1997 Cohort vs 2005 Cohort vs 2006 Cohort 199720052006

16
Overall Retention Rates 4-Year Rolling Averages 1996-2006 Cohorts

17
African American Retention Rates 4-Year Rolling Averages 1996-2006 Cohorts

20
Overall Graduation Rates 4-Year Rolling Averages 1993 – 2003 Cohorts

21
African American Graduation Rates 4-Year Rolling Averages 1993 – 2003 Cohorts

23
College Going Rates Arkansas vs. National Source: AHECB Quarterly Meeting, Agenda Item 21, Aug. 3, 2007

24
UA Enrollment

25
UA Enrollment (FTE) *Note FY08 is an estimate
 *Note FY08 is an estimate")
26
UA State Appropriation

27
UA Appropriation per FTE Student *Note FY08 is an estimate

28
UA Appropriation per FTE Student (’89-’90 constant dollars*) * Based on HEPI inflation rates **Note FY08 is an estimate
 * Based on HEPI inflation rates **Note FY08 is an estimate")
29
4-Year US Public vs UA Tuition & Fees

30
Two Primary Sources of UA E&G Revenue: State Appropriation and Tuition & Fees

31
How Was State Funding Determined?

33
University of Arkansas - Fayetteville for FY2007

34
$39,763,507

35
University of Arkansas - Fayetteville for FY2007 $39,763,507/0.045 = $883,633,489

36
Endowment Market Value Among SEC Universities FY 2007 Data Not Available

37
UA Private Support

38
UA Endowment

39
Priorities & Challenges n Diversity #1 n Strengthening the Graduate Research Program n New Funding Formula n Sustainability n Strengthening the Base – the Undergraduate Program n Delivering THE MESSAGE!

40
n There are many reasons to feel very good about what has been accomplished n However, we dare not rest on our laurels n Much remains to be done n We must “stay the course” in our pursuit of the 2010 goals n We must be more attentive and responsive to new and emerging opportunities Closing Thoughts

41
????????????????????????????????????????????????????????????????????????????????????????????????????????????????????????????????????????????????????????????????????????????????????????????????????????????????????????????????????????????????

Similar presentations


 Enrollment Toolsets and Support Marie E. Zeglen, Ph.D. Office of Institutional Planning and Research.>")


