Download presentation
Presentation is loading. Please wait.

1
Image courtesy of NASA/GSFC

2
Current Efforts in Climate Forecasting and Modeling Eugene S. Takle Director, Climate Science Initiative Professor of Atmospheric Science Department of Geological and Atmospheric Sciences Professor of Agricultural Meteorology Department of Agronomy Iowa State University Ames, Iowa 50011 gstakle@iastate.edu Eugene S. Takle Director, Climate Science Initiative Professor of Atmospheric Science Department of Geological and Atmospheric Sciences Professor of Agricultural Meteorology Department of Agronomy Iowa State University Ames, Iowa 50011 gstakle@iastate.edu Greenhouse Gases, Carbon Taxes and Trading, and Carbon Sequestration CHE 670 – Sustainability Seminar Kansas State University Manhattan, KS 6-8 Jan 2010

3
Outline Changes in atmospheric carbon dioxide Causes of climate change Changes in future climate around the globe Emission reductions to reach stabilization Climate change for the US Midwest Changes in atmospheric carbon dioxide Causes of climate change Changes in future climate around the globe Emission reductions to reach stabilization Climate change for the US Midwest

4
IPCC Third Assessment Report MTons Carbon

6
Global Carbon Emissions (Gt) Actual emissions are exceeding worst case scenarios projected in 1990
 Actual emissions are exceeding worst case scenarios projected in 1990")
7
Carbon Dioxide and Temperature

8
2010 384 ppm Carbon Dioxide and Temperature

9
“Business as Usual” 950 ppm (2100) Carbon Dioxide and Temperature
 Carbon Dioxide and Temperature")
10
“Business as Usual” 950 ppm (2100) Carbon Dioxide and Temperature ?
 Carbon Dioxide and Temperature")
11
Increased Greenhouse Gases => Global Heating Increasing greenhouse gases increases heating of the Earth

12
http://www.ncdc.noaa.gov/img/climate/research/2008/ann/global-jan-dec-error-bar-pg.gif Global Mean Surface Temperature

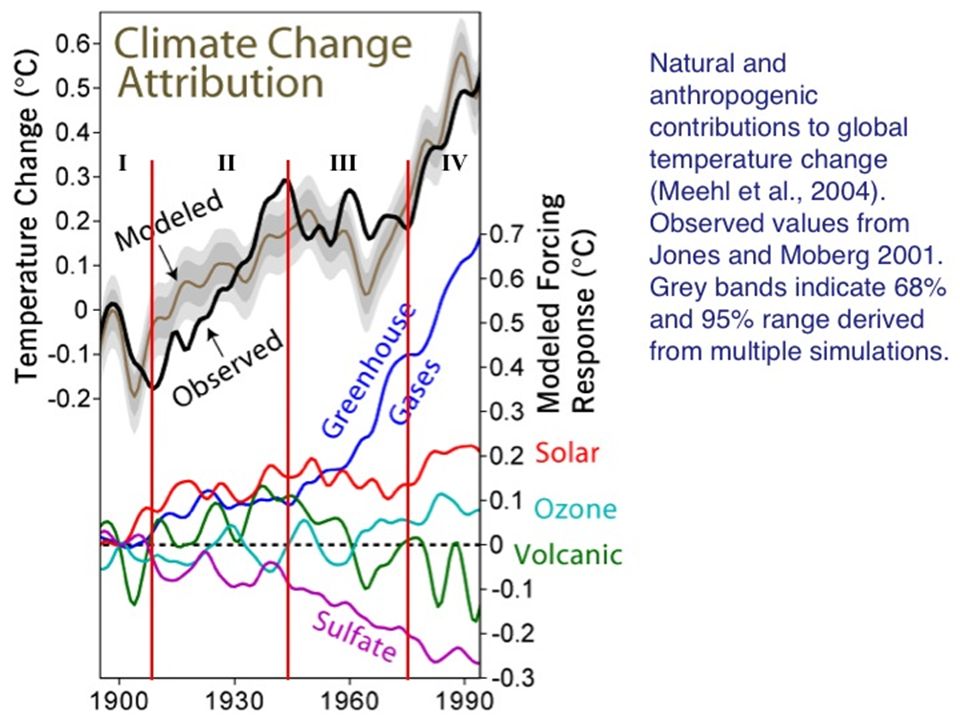
13
http://www.ncdc.noaa.gov/img/climate/research/2008/ann/global-jan-dec-error-bar-pg.gif Global Mean Surface Temperature IIIIIIIV

15
IPCC Fourth Assessment Report Summary for Policy Makers Balanced fuel sources Energy intensive More environmentally friendly If current emission trends continue, global temperature rise will exceed worst case scenarios projected in 2007 FI =fossil intensive

17
December- January- February Temperature Change A1B Emission Scenario 2080-2099 minus1980-1999 4.0 3.5

19
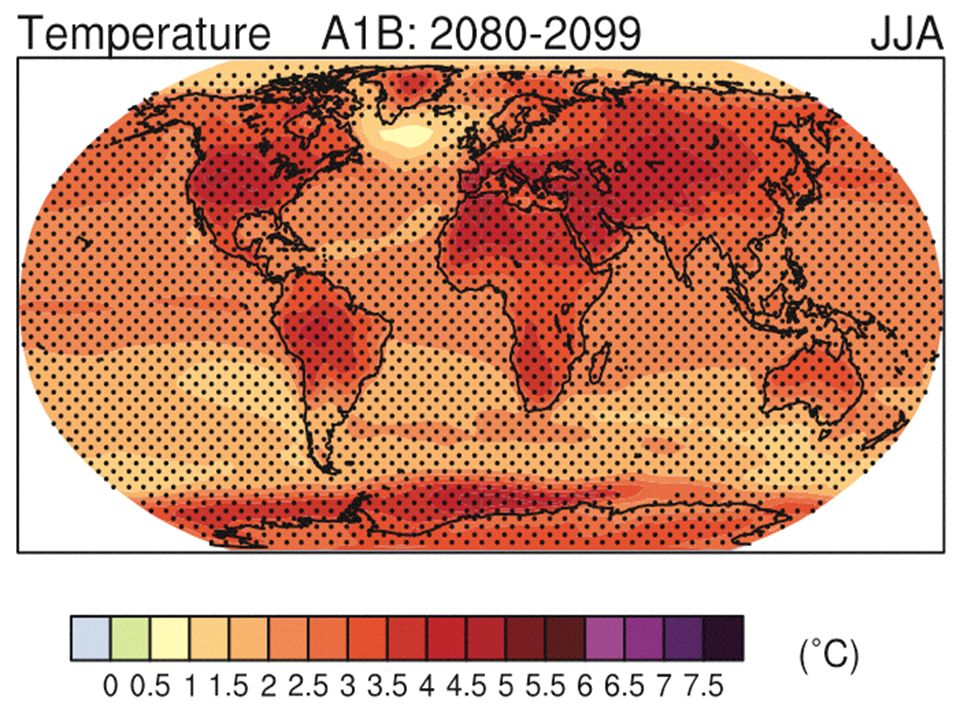
June-July- August Temperature Change A1B Emission Scenario 2080-2099 minus1980-1999 2.5 3.0

20
Source: IPCC 4 th Assessment Report, 2007

21
December- January- February Precipitation Change A1B Emission Scenario 2080-2099 minus1980-1999 0.0 0.1

22
Source: IPCC 4 th Assessment Report, 2007

23
June-July- August Precipitation Change A1B Emission Scenario 2080-2099 minus1980-1999 -0.1 0.0

24
Change in Annual Cloud Cover

25
A1B Emission Scenario 2080-2099 minus1980-1999 Change in Annual Cloud Cover -1.5

26
Annual Change in Soil Moisture

27
A1B Emission Scenario 2080-2099 minus1980-1999 -5 0

28
Imminent Transition to Arid Climate Precipitation minus Evaporation for Western US 25N-40N, 95W- 125 W (land areas only) R. Seager, et al.,2007. Model Projections of an Imminent Transition to a More Arid Climate in Southwestern North America. Science, Vol. 316. no. 5828, pp. 1181 - 1184

29
Precipitation minus Evaporation for Western US (25N-40N, 95W- 125 W) R. Seager, et al., 2007. Model Projections of an Imminent Transition to a More Arid Climate in Southwestern North America. Science, Vol. 316. no. 5828, pp. 1181 - 1184

30
Precipitation minus Evaporation for Western US (25N-40N, 95W-125 W) R. Seager, et al.,2007. Model Projections of an Imminent Transition to a More Arid Climate in Southwestern North America. Science, Vol. 316. no. 5828, pp. 1181 - 1184

31
Precipitation minus Evaporation for Western US (25N-40N, 95W-125 W) R. Seager, et al.,2007. Model Projections of an Imminent Transition to a More Arid Climate in Southwestern North America. Science, Vol. 316. no. 5828, pp. 1181 - 1184 Colorado River Compact established, 1922

32
Cooling Decade in a Century of Warming Easterling, D. R., and M. F. Wehner, 2009: Is the climate warming or cooling? Geophys. Res. Lett., 36, L08706, doi:10.1029/2009GL037810, 2009 Probability distribution functions for decadal trends (kelvin/year) in globally averaged surface air temperature Probability of a cooling decade in a century of warming
 in globally averaged surface air temperature Probability of a cooling decade in a century of warming.")
33
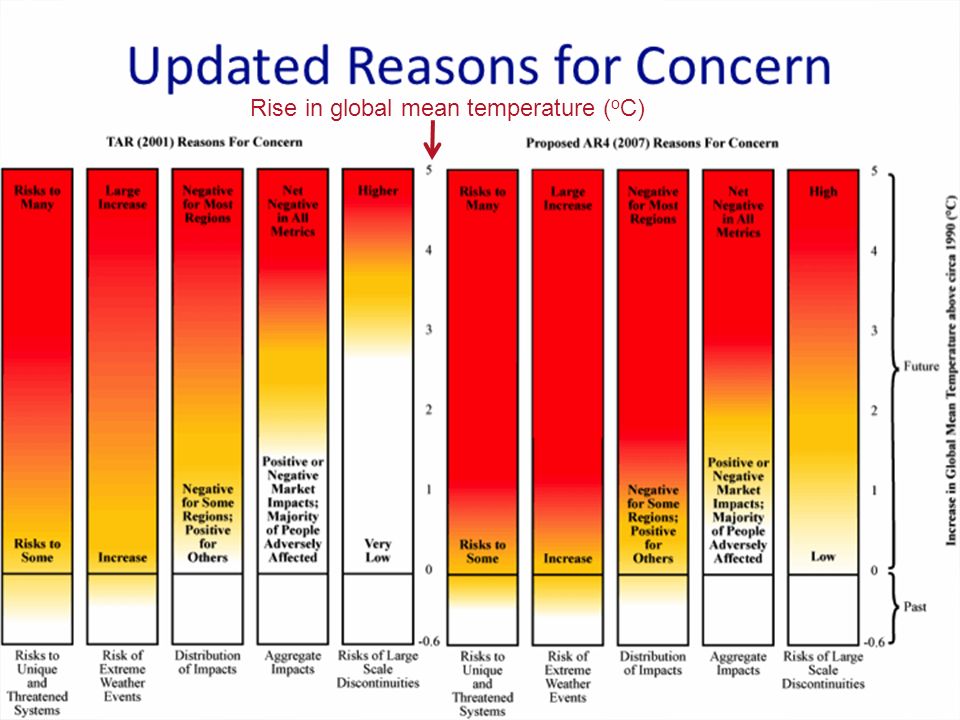
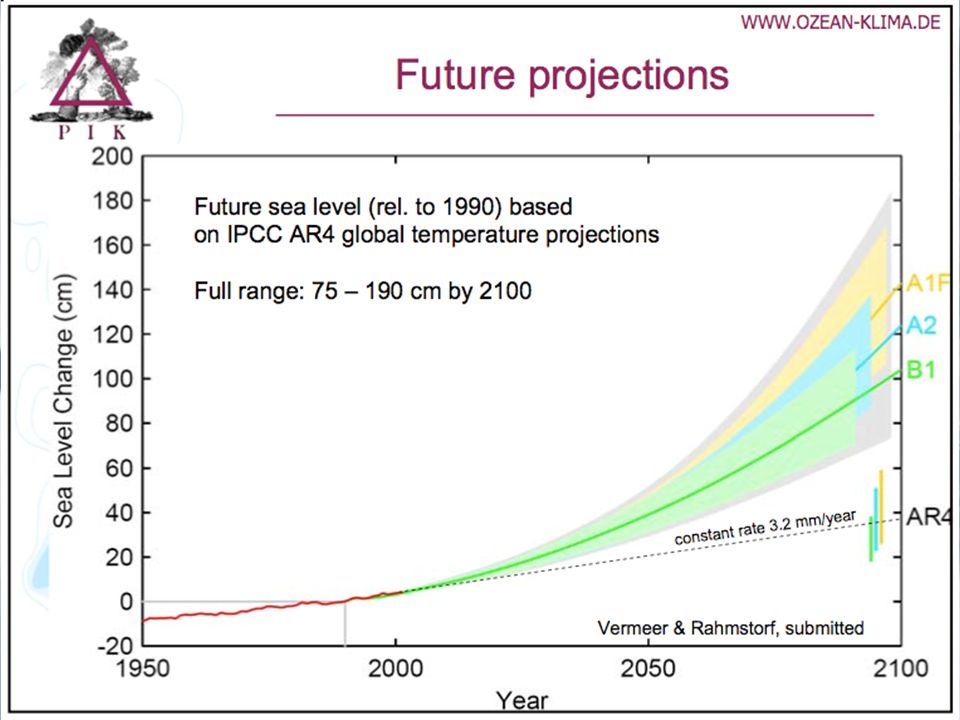
Rise in global mean temperature ( o C)
")
36
IPCC Fourth Assessment Report Summary for Policy Makers Limit to avoid “dangerous anthropogenic Interference” with the climate system Energy intensive Balanced fuel sources More environmentally friendly 2 o C limit

37
IPCC Fourth Assessment Report Summary for Policy Makers Balanced fuel sources Energy intensive More environmentally friendly If current emission trends continue, global temperature rise likely will exceed worst case scenarios projected in 2007 FI =fossil intensive 2 o C limit to avoid “dangerous anthropogenic interference” with the climate system 2 o C “Guardrail”

38
Long-Term Stabilization Profiles A2 B1 Nebojša Nakićenović IIASA, Vienna Emission scenario needed to provide 50% probability of not exceeding the 2 o C guardrail Future trend of current emissions

39
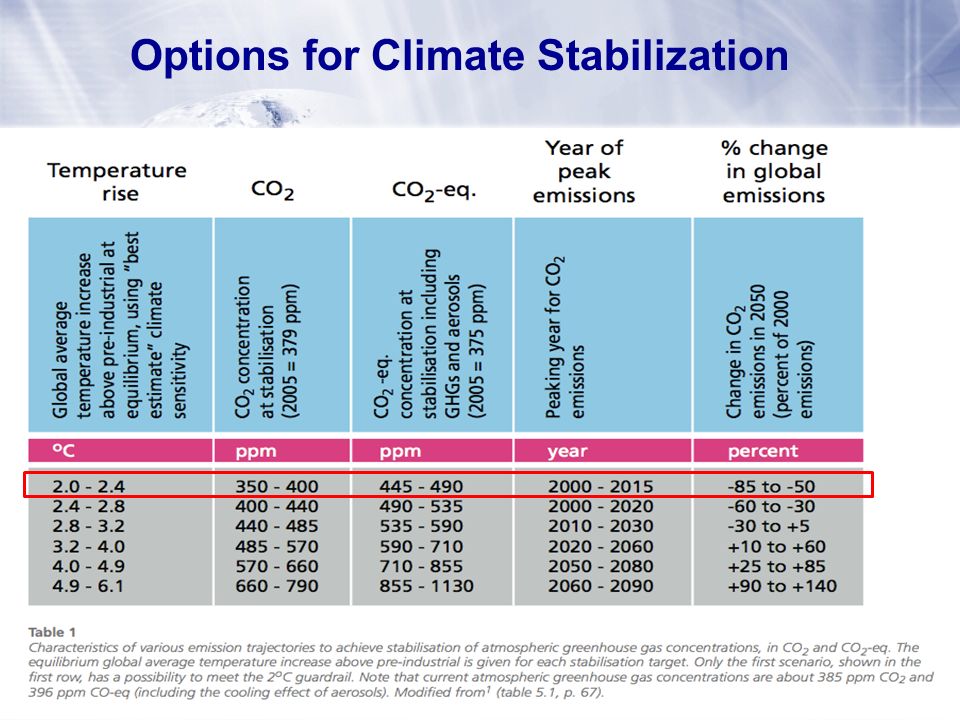
Options for Climate Stabilization

41
Source: IPCC, 2001: Climate Change 2001: The Scientific Basis

43
Arctic Sea-Ice Decline

44
Decline in Greenland Ice Mass

45
Increase in Hurricane Intensity

47
IPCC Fourth Assessment Report Summary for Policy Makers The planet is committed to a warming over the next 50 years regardless of political decisions Energy intensive Balanced fuel sources More environmentally friendly

48
IPCC Fourth Assessment Report Summary for Policy Makers Adaptation Necessary Mitigation Possible Energy intensive Balanced fuel sources More environmentally friendly Adaptation Crucial

50
Adapted from Folland et al. [2001] Observed Summer (JJA) Daily Maximum Temperature Changes (K), 1976-2000
 Daily Maximum Temperature Changes (K),")
51
“Warming Hole”: Simulations of changes in daily maximum summertime temperatures between 1990s and 2040s T max (JJA) ˚C Pan, Z., R. W. Arritt, E. S. Takle, W. J. Gutowski, Jr., C. J. Anderson, and M. Segal,2004: Altered hydrologic feedback in a warming climate introduces a “warming hole”. Geophys. Res. Lett.31, L17109, doi:10.1029/2004GL020528.

52
“One of the clearest trends in the United States observational record is an increasing frequency and intensity of heavy precipitation events… Over the last century there was a 50% increase in the frequency of days with precipitation over 101.6 mm (four inches) in the upper midwestern U.S.; this trend is statistically significant “
 in the upper midwestern U.S.; this trend is statistically significant")
53
Projected Changes* for the Climate of the Midwest Temperature Longer frost-free period (high) Higher average winter temperatures (high) Fewer extreme cold temperatures in winter (high) Fewer extreme high temperatures in summer in short term but more in long term (medium) Higher nighttime temperatures both summer and winter (high) More freeze-thaw cycles (high) Increased temperature variability (high) Longer frost-free period (high) Higher average winter temperatures (high) Fewer extreme cold temperatures in winter (high) Fewer extreme high temperatures in summer in short term but more in long term (medium) Higher nighttime temperatures both summer and winter (high) More freeze-thaw cycles (high) Increased temperature variability (high) Follows trend of last 25 years and projected by models No current trend but model suggestion or current trend but model inconclusive *Estimated from IPCC reports
 Higher average winter temperatures (high) Fewer extreme cold temperatures in winter (high) Fewer extreme high temperatures in summer in short term but more in long term (medium) Higher nighttime temperatures both summer and winter (high) More freeze-thaw cycles (high) Increased temperature variability (high) Longer frost-free period (high) Higher average winter temperatures (high) Fewer extreme cold temperatures in winter (high) Fewer extreme high temperatures in summer in short term but more in long term (medium) Higher nighttime temperatures both summer and winter (high) More freeze-thaw cycles (high) Increased temperature variability (high) Follows trend of last 25 years and projected by models No current trend but model suggestion or current trend but model inconclusive *Estimated from IPCC reports")
54
More (~10%) precipitation annually (medium) Change in “seasonality”: Most of the increase will come in the first half of the year (wetter springs, drier summers) (high) More water-logging of soils (medium) More variability of summer precipitation (high) More intense rain events and hence more runoff (high) Higher episodic streamflow (medium) Longer periods without rain (medium) Higher absolute humidity (high) Stronger storm systems (medium) More winter soil moisture recharge (medium) Snowfall increases (late winter) in short term but decreases in the long run (medium) More (~10%) precipitation annually (medium) Change in “seasonality”: Most of the increase will come in the first half of the year (wetter springs, drier summers) (high) More water-logging of soils (medium) More variability of summer precipitation (high) More intense rain events and hence more runoff (high) Higher episodic streamflow (medium) Longer periods without rain (medium) Higher absolute humidity (high) Stronger storm systems (medium) More winter soil moisture recharge (medium) Snowfall increases (late winter) in short term but decreases in the long run (medium) *Estimated from IPCC reports Projected Changes* for the Climate of the Midwest Precipitation Follows trend of last 25 years and projected by models No current trend but model suggestion or current trend but model inconclusive
 precipitation annually (medium) Change in seasonality : Most of the increase will come in the first half of the year (wetter springs, drier summers) (high) More water-logging of soils (medium) More variability of summer precipitation (high) More intense rain events and hence more runoff (high) Higher episodic streamflow (medium) Longer periods without rain (medium) Higher absolute humidity (high) Stronger storm systems (medium) More winter soil moisture recharge (medium) Snowfall increases (late winter) in short term but decreases in the long run (medium) More (~10%) precipitation annually (medium) Change in seasonality : Most of the increase will come in the first half of the year (wetter springs, drier summers) (high) More water-logging of soils (medium) More variability of summer precipitation (high) More intense rain events and hence more runoff (high) Higher episodic streamflow (medium) Longer periods without rain (medium) Higher absolute humidity (high) Stronger storm systems (medium) More winter soil moisture recharge (medium) Snowfall increases (late winter) in short term but decreases in the long run (medium) *Estimated from IPCC reports Projected Changes* for the Climate of the Midwest Precipitation Follows trend of last 25 years and projected by models No current trend but model suggestion or current trend but model inconclusive")
55
Reduced wind speeds (high) Reduced solar radiation (medium) Increased tropospheric ozone (high) Accelerated loss of soil carbon (high) Phenological stages are shortened (high) Weeds grow more rapidly under elevated atmospheric CO2 (high) Weeds migrate northward and are less sensitive to herbicides (high) Plants have increased water used efficiency (high) Reduced wind speeds (high) Reduced solar radiation (medium) Increased tropospheric ozone (high) Accelerated loss of soil carbon (high) Phenological stages are shortened (high) Weeds grow more rapidly under elevated atmospheric CO2 (high) Weeds migrate northward and are less sensitive to herbicides (high) Plants have increased water used efficiency (high) Follows trend of last 25 years and projected by models No current trend but model suggestion or current trend but model inconclusive *Estimated from IPCC and CCSP reports Projected Changes* for the Climate of the Midwest Other
 Reduced solar radiation (medium) Increased tropospheric ozone (high) Accelerated loss of soil carbon (high) Phenological stages are shortened (high) Weeds grow more rapidly under elevated atmospheric CO2 (high) Weeds migrate northward and are less sensitive to herbicides (high) Plants have increased water used efficiency (high) Reduced wind speeds (high) Reduced solar radiation (medium) Increased tropospheric ozone (high) Accelerated loss of soil carbon (high) Phenological stages are shortened (high) Weeds grow more rapidly under elevated atmospheric CO2 (high) Weeds migrate northward and are less sensitive to herbicides (high) Plants have increased water used efficiency (high) Follows trend of last 25 years and projected by models No current trend but model suggestion or current trend but model inconclusive *Estimated from IPCC and CCSP reports Projected Changes* for the Climate of the Midwest Other")
56
Summary Increases in CO2 will create a wide variety of climate changes Some regions will experience changes favorable for local societal activities, but most will be unfavorable Stabilization to avoid passing the 2oC guardrail will require major decreases in global emissions Many, but not all, observed regional climate changes are consistent with global and regional climate model projections Increases in CO2 will create a wide variety of climate changes Some regions will experience changes favorable for local societal activities, but most will be unfavorable Stabilization to avoid passing the 2oC guardrail will require major decreases in global emissions Many, but not all, observed regional climate changes are consistent with global and regional climate model projections

Similar presentations


![Climate Change Impacts in the United States Third National Climate Assessment [Name] [Date] Climate Trends.](/15/4626683/big_thumb.jpg "Climate Change Impacts in the United States Third National Climate Assessment [Name] [Date] Climate Trends.>")


