Download presentation
Presentation is loading. Please wait.

1
Powered By Powered by: Simulating Regeneration Dynamics in Upland Oak Stands USDA Forest Service Southern Research Station Dr. David Loftis

2
Powered By Powered by: USDA Forest Service Southern Research Station Dr. David Loftis Regen for Excel is a simulation model that using rankings of expected postharvest performance to predict species composition of dominant and codominant trees twenty years following complete overstory removal

3
Powered By Powered by: USDA Forest Service Southern Research Station Dr. David Loftis

4
Midstory Present, No Yellow-Poplar Seed Source Density of Advance Seedling Reproduction by Species and Height Class (ft) prior to complete overstory removal SpeciesSmallMediumLargeTotal (< 2 ft tall) (2 to 4 ft tall)(> 4ft tall) Red Maple600 3001500 Sugar Maple300 0600 White Oak2001000300 Red Oak30015020470 A. Beech200150130480 Total160013004503350

5
Midstory Present, No Yellow-Poplar Seed Source Species composition of dominant/codominant canopy trees twenty years following overwood removal

6
Midstory Present, Yellow-Poplar Seed Source Present Species composition of dominant/codominant canopy trees twenty years following overwood removal

7
No Midstory Present, Yellow-Poplar Seed Source Present Density of Advance Seedling Reproduction by Species and Height Class (ft) prior to complete overstory removal SpeciesSmallMediumLargeTotal (< 2 ft tall) (2 to 4 ft tall)(> 4ft tall) Red Maple60000 Sugar Maple30000 White Oak2001000300 Red Oak30015020470 A. Beech20000 Total1600250201870

8
No Midstory Present, Yellow-Poplar Seed Source Present Species composition of dominant/codominant canopy trees twenty years following overwood removal

9
Shade tolerant understory and midstory trees removed, Yellow-Poplar Seed Source Present Density of Advance Seedling Reproduction by Species and Height Class (ft) prior to complete overstory removal SpeciesSmallMediumLargeTotal (< 2 ft tall) (2 to 4 ft tall)(> 4ft tall) Red Maple0000 Sugar Maple0000 White Oak2001000300 Red Oak30015020470 A. Beech0000 Total50025020770

10
Shade tolerant understory and midstory trees removed, Yellow-Poplar Seed Source Present Species composition of dominant/codominant canopy trees twenty years following overwood removal

11
Powered By Powered by: Simulating Regeneration Dynamics in Upland Oak Stands USDA Forest Service Southern Research Station Dr. David Loftis Simulations underscore: Importance of having competitive advance oak reproduction present prior to final overstory removal Role of silvicultural treatments in controlling competing vegetation and enhancing the competitive position of oak reproduction

12
Evaluating Advance Oak Reproduction Evaluating the density, size, and species composition of advance reproduction is a critical step in planning regeneration systems like the shelterwood Successful regeneration of oak species typically requires a sufficient number of large, well-distributed advance reproduction prior to overstory removal Shelterwood overstory should not be removed until sufficient oak reproduction has developed.

13
Evaluating Advance Oak Reproduction Two approaches are generally used to evaluate levels of advance reproduction –Fixed Radius Plot (i.e. plot count) Inventory –Stocked Plot Inventory
 Inventory –Stocked Plot Inventory.")
14
Evaluating Advance Oak Reproduction Fixed Radius Plot (i.e. plot count) Inventory –Typically completed in conjunction with large tree inventory Density of potential stump sprouting oaks determined from large tree inventory. –Plot size usually 1/1000 acre (3.72 ft radius) to 1/200 acre (8.33 ft radius) –Advance reproduction density summarized by species and height class
 Inventory –Typically completed in conjunction with large tree inventory Density of potential stump sprouting oaks determined from large tree inventory. –Plot size usually 1/1000 acre (3.72 ft radius) to 1/200 acre (8.33 ft radius) –Advance reproduction density summarized by species and height class.")
15
Evaluating Advance Oak Reproduction Stocked Plot Inventory –Inventory determines the percentage of plots stocked with an advance reproduction stem of a specified species and size –Density of potential stump sprouting oaks determined from large tree inventory –Stocked plot percentage is then compared to a predetermined stocking percent benchmark Benchmark indicates the number of stocked plots typically necessary to result in successful regeneration of the target species or species group

16
SILVAH Oak Brose, Patrick H.; Gottschalk, Kurt W.; Horsley, Stephen B.; Knopp, Peter D.; Kochenderfer, James N.; McGuinness, Barbara J.; Miller, Gary W.; Ristau, Todd E.; Stoleson, Scott H.; Stout, Susan L. 2008. Prescribing regeneration treatments for mixed-oak forests in the Mid-Atlantic region. Gen. Tech. Rep. NRS-33. Newtown Square, PA: U.S. Department of Agriculture, Forest Service, Northern Research Station. 100 p

17
SILVAH Oak Regeneration Evaluation SILVAH Oak method uses data collected on: –Desirable seedling regeneration –Interfering plants –Site quality –Overstory shading –Deer impact

18
SILVAH Oak Regeneration Evaluation SILVAH summarizes set of key decision variables –Variables evaluated against thresholds according to the “stocked plot” concept For any key decision variable, a minimum, per-plot, threshold has been established and any plot exceeding that minimum threshold is considered stocked Established from research and forestry practice

19
SILVAH Oak Inventory Method Evaluating regenerative potential of mixed-oak stands must simultaneously consider species present, abundance, size, and spatial distribution of reproduction, and factors limiting successful regeneration SILVAH uses three nested plots –Tree regeneration: 6 ft radius plot –Obstacles to successful regeneration: 26 ft radius interference plot –Overstory conditions: 10 BAF prism

20
SILVAH Oak: Regeneration Plot SILVAH simultaneously evaluates regeneration abundance and size by the “stocked plot” approach Regeneration rooted in 6 ft plot is tallied using weighted counts into ten categories Stem counts for the different species groups are adjusted for size and are recorded as weighted counts

21
SILVAH Oak: Regeneration Plot Competitive Oak: Stump sprouts or stems >3 feet tall OR with a root collar diameter (RCD) >0.75 inches. Established Oak: Count all stems 0.5−3 feet tall OR with RCD 0.25−0.75 inches. New Oak: Count all stems <0.5 foot tall and a RCD <0.25 inches

22
SILVAH Oak: Regeneration Plot Black cherry: Count all seedlings ≥2 inches tall with 2 normal-sized leaves. Stems > 1 foot tall are counted twice. Yellow-poplar: Same as black cherry. Ignore if oak site index <65. Conifers: Count any hemlock, pine, or spruce seedling with 2 whorls OR 0.5-1 foot tall. Stems w/ ≥3 whorls or >1 foot tall are counted twice. Other desirables: Same as black cherry. Maples must pass the tug test. For hickory and walnut, count all stems meeting established oak criteria; stems meeting competitive oak criteria are counted twice.

23
SILVAH Oak: Regeneration Plot Saplings: If a past disturbance has allowed regeneration to grow into saplings (1 to 6-inch d.b.h.), tally them if they are a desirable species, have good form and vigor, and meet one of these density thresholds: two stems less than 2.0 inches d.b.h. or one stem 2 to 6 inches d.b.h. Record the code of the dominant species. Residuals: Good quality stems 6-10 inches dbh that are the same age as main canopy and will be retained after final harvest. Record species code. Tall woody interference: Undesirable species more than 6’ tall rooted in or near the plot. Record species code of the dominant stem.

24
SILVAH Oak: Interference Plot Interference plot assesses competing vegetation, deer impact, and site limitations Interference plot has 26-foot radius One interference plot with each regeneration plot

25
SILVAH Oak: Interference Plot Interference plot tally categories: Low Woody Interference: Visually group foliage of shrubs and undesirable trees less than 6’ tall together. Estimate cover by 5% increments. Record percent cover and code of the dominant species. Fern (bracken, hay-scented, New York): Estimate percent cover by 5% increments. For other fern species, report half the cover. If >50% coverage, record in 10% increments. Grass and Sedge: Estimate percent cover by 5% increments. Record 1% even if only a trace of grass or sedge is present. Grapevine: Record the number of grapevines rooted in the plot. Site limitations: Record if present anywhere on the plot. 1= poor drainage, 2= rocky/thin soil, 3= thick duff.
: Estimate percent cover by 5% increments. For other fern species, report half the cover. If >50% coverage, record in 10% increments. Grass and Sedge: Estimate percent cover by 5% increments. Record 1% even if only a trace of grass or sedge is present. Grapevine: Record the number of grapevines rooted in the plot. Site limitations: Record if present anywhere on the plot. 1= poor drainage, 2= rocky/thin soil, 3= thick duff..")
26
SILVAH Oak: Interference Plot SILVAH uses five levels of deer impact to estimate browsing pressure –Very low impact –Low impact –Moderate impact –High impact –Very high impact

27
SILVAH Oak: Overstory Plot Inventorying the overstory entails collecting basal area data by species, diameter, and stem quality. One overstory plot for every two regeneration plot The inventory can be inventoried using fixed-area or variable-radius sampling techniques

28
SILVAH Oak: Key Decision Variables Understory Regeneration Stocking –SILVAH determines regeneration stocking for the species and species groups –Number of qualifying stems recorded compared to “stocked” plot thresholds adjusted for site quality and deer impact

29
SILVAH Oak: Key Decision Variables

30
Oak Stump Sprout Stocking –An important source of oak regeneration is sprouting of the overstory oaks after they are harvested –Sprouting probability of mature oaks varies considerably among the species and decreases as size class increases

31
SILVAH Oak: Key Decision Variables Oak stump sprout probability

32
SILVAH Oak: Key Decision Variables Oak Stump Sprout Stocking –SILVAH estimates the number of stump sprouts from overstory data and sprout probabilities –Estimated stocking percentages associated with sprout density

33
SILVAH Oak: Key Decision Variables Oak Stump Sprout Stocking

34
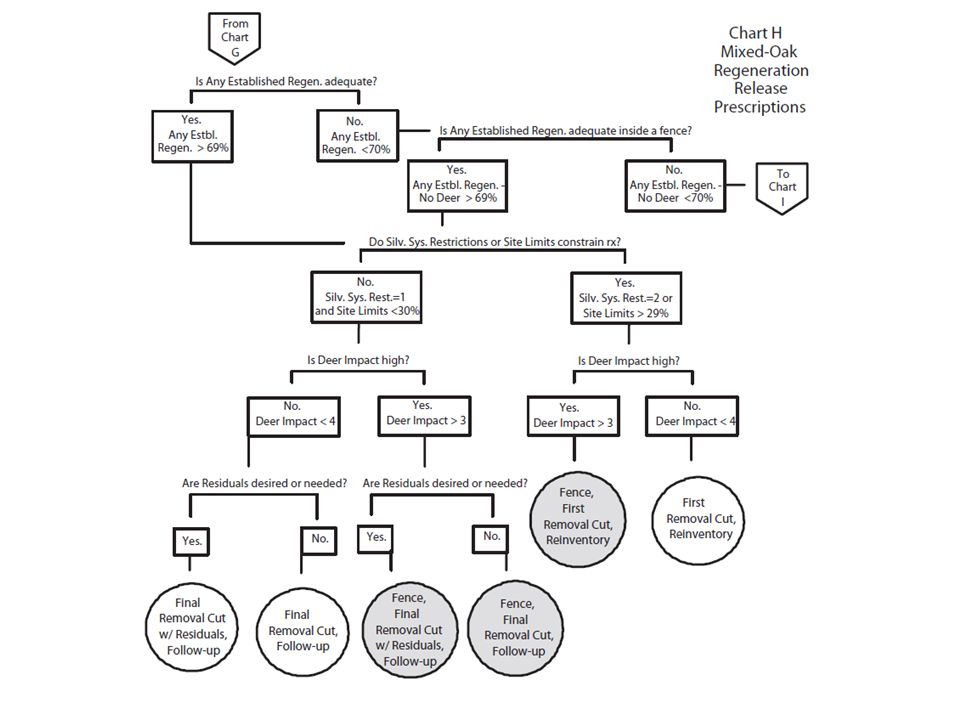
SILVAH Oak: Decision Making SILVAH Oak uses a series of decision charts to determine the regeneration status of a stand. The decision chats use a number of summary variables. Summary Variables Any Competitive Regeneration: A plot is stocked with Any Competitive Regeneration if it meets the stocking criteria for any of the regeneration categories except New Oak, Established Oak, Established Desirables, and Total Oak

35
SILVAH Oak: Decision Making Summary Variables (continued) Any Established Regeneration: A plot is stocked with Any Established Regeneration if it meets the stocking criteria for any of the regeneration categories except New Oak and Total Oak All Established Oak: A plot is stocked with All Established Oak if it meets the stocking criteria for Established Oak or Competitive Oak All Oak: A plot is stocked with All Oak if it meets the stocking criteria for New Oak, Established Oak, Competitive Oak, or Total Oak
 Any Established Regeneration: A plot is stocked with Any Established Regeneration if it meets the stocking criteria for any of the regeneration categories except New Oak and Total Oak All Established Oak: A plot is stocked with All Established Oak if it meets the stocking criteria for Established Oak or Competitive Oak All Oak: A plot is stocked with All Oak if it meets the stocking criteria for New Oak, Established Oak, Competitive Oak, or Total Oak")
36
SILVAH Oak: Decision Making Summary Variables (continued) Stocking of Regeneration Obstacles: Percentage of plots that are stocked with various kinds of interfering plants and site limitations Any Interference: A plot stocked with any of the interfering vegetation types is considered to be stocked with Any Interference.
 Stocking of Regeneration Obstacles: Percentage of plots that are stocked with various kinds of interfering plants and site limitations Any Interference: A plot stocked with any of the interfering vegetation types is considered to be stocked with Any Interference.")
37
SILVAH Oak: Key Decision Points 1.Any Competitive Regeneration > 69% –Final removal cut for mixed hardwoods appropriate 2.Competitive Oak > 49% and Any Competitive Regeneration > 69% –Final removal cut for mixed-oak regeneration appropriate 3.All Established Oak > 49%: –High site quality (SI > 70): First removal cut of shelterwood appropriate –Low to medium site quality (SI 69%, final removal cut 4.All Established Oak 50%: Preparatory cut, herbicide, and reinventory
: First removal cut of shelterwood appropriate –Low to medium site quality (SI 69%, final removal cut 4.All Established Oak 50%: Preparatory cut, herbicide, and reinventory")
38
Example Oak Regeneration Scenario 1 Regeneration Inventory found: 1.No Competitive Oak (0% stocked plots) 2.Few Established Oak (5% stocked plots) 3.Few All Oak (15% stocked plots) 4.High level of Tall Woody Interference 5.Site Limitation: Thick Duff Layer
 2.Few Established Oak (5% stocked plots) 3.Few All Oak (15% stocked plots) 4.High level of Tall Woody Interference 5.Site Limitation: Thick Duff Layer")
39
MDM = 23 No site limitations

40
Comp. oak = 0%

41
All Est. Oak = 5%

43
All oak = 15%

44
Oak sawlogs = 70 ft 2 ac -1 Thick Duff =30% Any Int. = 70% Deer Index = 2

45
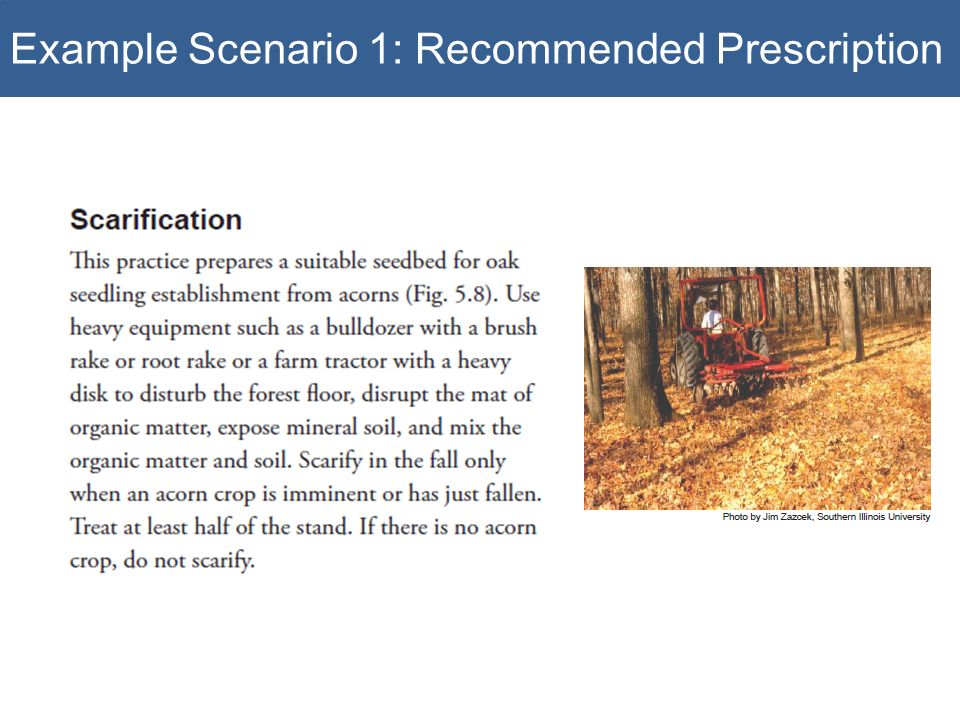
Example Scenario 1: Recommended Prescription

47
Herbicide Herbicide is an effective, safe and economical technique for removing vegetation that interferes with establishment and growth of oak regeneration. Five methods of herbicide application 1) Broadcast Spray 2) Cut and Spray 3) Stem Injection 4) Basal Application 5) Cut Stump
 Broadcast Spray 2) Cut and Spray 3) Stem Injection 4) Basal Application 5) Cut Stump.")
48
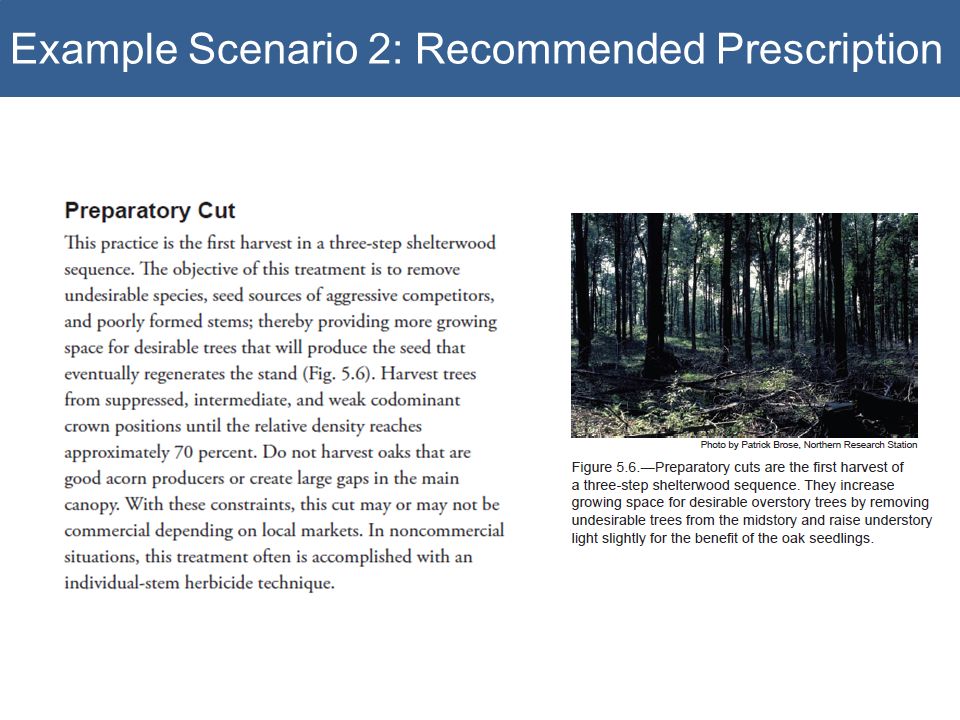
Example Oak Regeneration Scenario 2 Regeneration Inventory found: 1.Few Competitive Oak (15% stocked plots) 2.Moderate Established Oak (40% stocked plots) 3.All Oak (85% stocked plots) 4.High level of Tall Woody Interference
 2.Moderate Established Oak (40% stocked plots) 3.All Oak (85% stocked plots) 4.High level of Tall Woody Interference")
49
MDM = 23 No site limitations

50
Comp. oak = 15%

51
All Est. Oak = 40%

52
All oak = 85% Stocking = 85% Interference = 70% Deer Index = 2

53
Example Scenario 2: Recommended Prescription

Similar presentations