Download presentation
Presentation is loading. Please wait.

1
D. Data Entry & Analysis Plan Established

2
Critical Element PBIS Implementation Goal D. Data Entry & Analysis Plan Established 13. Data system is used to collect and analyze ODR data. 14. Additional Data collected (attendance, grades, grades, faculty attendance, surveys) and used by SWPBS team 15. Data analyzed by team at least monthly 16. Data shared with team and faculty monthly (minimum)
 and used by SWPBS team 15. Data analyzed by team at least monthly 16. Data shared with team and faculty monthly (minimum).")
3
Objectives Identify the components of discipline/behavioral data collection Examine the problem-solving process of data analysis Understand the difference between primary statements & precision statements Identify & define data decision rules

4
Data Use The right information In the right format At the right time For decision-making by the right people

5
Do we have the data system needed for active decision-making? Are we collecting the right information? What, when, where, who (why?) Is data collection efficient? Less than 15 sec to fill out, less than 30 sec to enter Do we get data in the right format? Histograms Do we get the data at the right time? Before and during meetings Data no more than 24 hours old Are data used for decision-making by all? Data presented to all faculty at least monthly Data available for whole school, small group and individual student evaluation Data collected on FIDELITY (what we do) as well as IMPACT (student behavior)
 Is data collection efficient. Less than 15 sec to fill out, less than 30 sec to enter Do we get data in the right format. Histograms Do we get the data at the right time. Before and during meetings Data no more than 24 hours old Are data used for decision-making by all. Data presented to all faculty at least monthly Data available for whole school, small group and individual student evaluation Data collected on FIDELITY (what we do) as well as IMPACT (student behavior).")
6
Using Data Do we have a problem? Refine the description of the problem? What behavior, Who, Where, When, Why Test hypotheses Build practical solutions Define how to monitor if solution is effective

7
Collect and Use and UseData Review Status and Identify Problems Develop and Refine Hypotheses Discuss and Select Solutions Develop and Implement Action Plan Evaluate and Revise Action Plan Problem Solving Foundations Team Initiated Problem Solving (TIPS) Model
 Model")
8
Identifying problems/issues What data to monitor – ODR per day per month – OSS, ISS, Attendance, Teacher report – Team Checklist/ SET (are we doing what we planned to do?) What question to answer – Do we have a problem? What questions to ask of Level, Trend, Peaks – How do our data compare with last year? – How do our data compare with national/regional norms? – How do our data compare with our preferred/expected status? If a problem is identified, then ask – What are the data we need to make a good decision?

9
Total Office Discipline Referrals Total Office Discipline Referrals as of January 10

11
SWIS summary (Majors Only) 3,410 schools; 1,737,432 students; 1,500,770 ODRs Grade RangeNumber of Schools Mean Enrollment per school Mean ODRs per 100 per school day K-62,162450.34 (sd =.49) 6-9602657.85 (sd = 1.11) 9-122158871.27 (sd = 2.39) K-(8-12)4314081.06 (sd = 2.60)
 3,410 schools; 1,737,432 students; 1,500,770 ODRs Grade RangeNumber of Schools Mean Enrollment per school Mean ODRs per 100 per school day K-62, (sd =.49) (sd = 1.11) (sd = 2.39) K-(8-12) (sd = 2.60)")
12
Application Activity: Absolute Value Is there a Problem? Middle School of 625 students? Compare with national average: 625/100 = 6.25 6.25 X.98 = 6.12 Office Discipline Referrals per School Day

13
Elementary School with 150 Students Compare with National Average 150 / 100 = 1.50 1.50 X.34 =.51

14
High School of 1800 students Compare with National Average 1800 / 100 = 18 18 X.93 = 16.74

15
Middle School of 700 students

18
Is There a Problem? #1 Absolute - Trend - Compare Middle School N= 495

19
Is There a Problem? #2 Absolute - Trend - Compare Middle School N= 495

20
Is There a Problem? #3 Absolute - Trend - Compare Middle School N= 495

21
Is There a Problem? #4 Absolute - Trend - Compare Middle School N= 495

23
From Primary to Precise – Primary statements are vague and leave us with more questions than answers – Precise statements are much more specific and lead to measurable outcomes

24
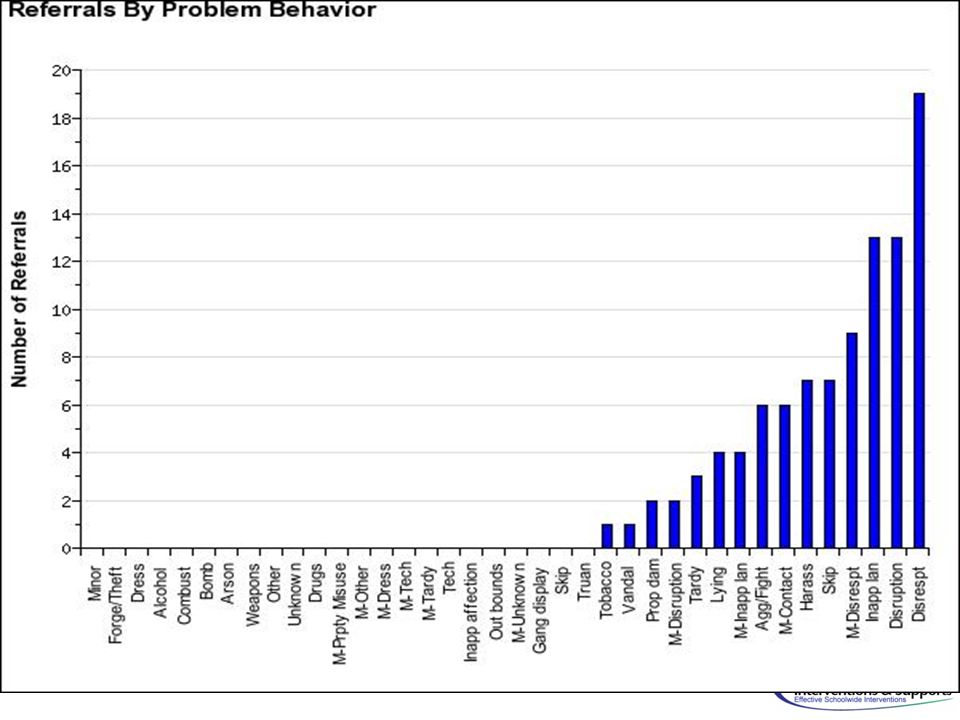
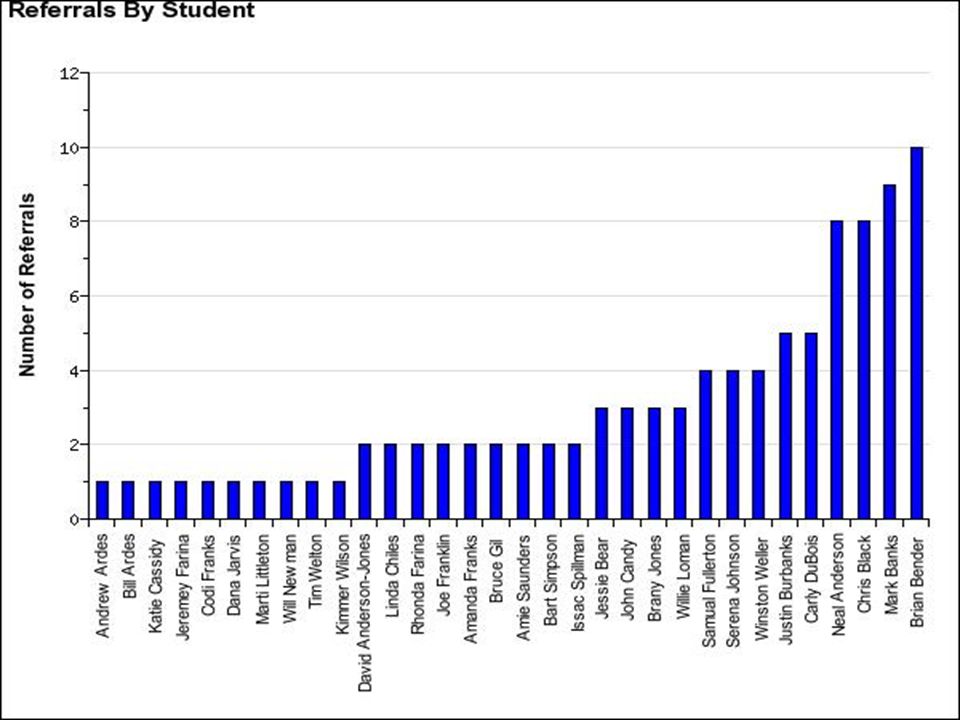
What are the data you are most likely to need to move from a Primary to a Precise statement? What problem behaviors are most common? – ODR per Problem Behavior Where are problem behaviors most likely? – ODR per Location When are problem behaviors most likely? – ODR per time of day Who is engaged in problem behavior? – ODR per student Why are problem behaviors sustaining? – No graph

25
– Primary statement: – There is too much fighting at our school – Precise statement – There were 30 more ODRs for aggression on the playground than last year, and these are most likely to occur from 12:00- 12:30 during fifth grade’s recess because there is a large number of students, and the aggression is related to getting access to the new playground equipment. “ From Primary to Precise

26
Primary statement: – “ODRs during December were higher than any month” Precise statement : – Minor disrespect and disruption are increasing and are most likely to occur during the last 15- minutes of our classes when students are engaged in independent seat work. This pattern is most common in 7 th and 8 th grades, involve many students, and appears to be maintained by work avoidance/escape. Attention may also be a function of the behavior- we’re not sure. From Primary to Precise

27
Primary statement Most 9 th graders never turn in their homework. Precision statement 40 % of 9 th graders are missing 2 or more assignments during the first marking period in English.

28
Primary statement- The behavior of students during lunch is unacceptable. Primary statement- Most students arrive late to class. Primary statement-Many students are defiant and/or disruptive. Develop a Precise Statement (ACTIVITY D1)
.")
35
How much of what data needs to happen within what amount of time in order to trigger an adult response? What is the response? Data Process -> Data decision criteria

36
Data Process Data Point How Many/Much Time Period ________ ________ ________ How much of what data needs to happen within what amount of time in order to trigger an adult response? What is the response?

37
Data decision rules may be based on number of… office referrals suspensions Universal screening scores of failing grades Trips to the nurse Missing homework assignments Absences/tardies Mental health hospitalizations Teacher referrals Student requests Parent requests Non response to lower level of intervention Involvement with law enforcement

38
More than 40% of students received one or more office discipline referrals OR There are more than 2.5 office discipline referrals per student per day Focus on … School-wide systems More than 30% of students have more than 2 D’s or F’s in a 10 week marking period. Focus on … Classroom systems Data Decision Criteria examples

40
Activity D2 Can your school get access to the kind of information you need for decision making? Does the information get generated into a graph that is easy to read? Can I enter referrals easily? (30 seconds/referral) Can I generate reports easily? (5 second rule ) Do I have access to the Big 5? – Number of referrals per day per month – Referrals by Location – Referrals by Time – Referrals by Problem Behavior – Referrals by Student What other reports may be helpful? How will data be shared?
 Can I generate reports easily. (5 second rule ) Do I have access to the Big 5. – Number of referrals per day per month – Referrals by Location – Referrals by Time – Referrals by Problem Behavior – Referrals by Student What other reports may be helpful. How will data be shared .")
41
Activity D3 Action Steps Assessment D: Data Entry & Analysis Plan Established – Complete form using team consensus – For each of the items, determine status (A- Achieved; I-In Progress; N-Not Started) – Discuss areas of strengths and needs – List at least 2 action steps to strengthen areas of need
 – Discuss areas of strengths and needs – List at least 2 action steps to strengthen areas of need")
Similar presentations


 acknowledges the support.>")


