Download presentation
Presentation is loading. Please wait.

1
Predictability and dynamics of the rapid intensification of Hurricane Edouard (2014) Erin Munsell and Fuqing Zhang (Penn State) Jason Sippel (EMC/IMSG) and Scott Braun (NASA/GSFC) Zhang research group & visitors, Aug 2014
 Erin Munsell and Fuqing Zhang (Penn State) Jason Sippel (EMC/IMSG) and Scott Braun (NASA/GSFC) Zhang research group & visitors, Aug 2014")
2
Performance of PSU WRF-EnKF Assimilating Airborne Vr all 100+ P3 TDR missions during 2008-2012 Quasi-operational evaluation by NOAA/NHC since 2011 as stream 1.5 run WRF-EnKF: 3 domains (27, 9, 3km), 60-member ensemble, PSU TC flux scheme (Zhang and Weng, 2015 BAMS) Position error (km) Intensity error (knots)
, 60-member ensemble, PSU TC flux scheme (Zhang and Weng, 2015 BAMS) Position error (km) Intensity error (knots)")
3
(Munsell & Zhang 2014 JAMES) Ensemble Predictions of Sandy 2012
 Ensemble Predictions of Sandy 2012")
4
Dynamics and predictability of Hurricane Nadine (2012) (Munsell, Sippel, Bruan, Weng and Zhang, 2015, MWR, in press)
 (Munsell, Sippel, Bruan, Weng and Zhang, 2015, MWR, in press)")
6
Maximum 10-m Wind Speed (kts) classified by performance Best Track – Black GOOD – Blue GOOD_EARLY – Green GOOD_LATE – Magenta POOR – Red
 classified by performance Best Track – Black GOOD – Blue GOOD_EARLY – Green GOOD_LATE – Magenta POOR – Red")
7
Deep-layer shear (850-hPa – 200-hPa) averaged over a 200-km to 500-km radius for the ensemble members of the composite groups
 averaged over a 200-km to 500-km radius for the ensemble members of the composite groups")
8
SST = 29°CSST = 27°C Larger magnitude of critical shear Smaller spread for RI onset time Higher SST: TC predictability under different SST and shear (Zhang and Tao 2013 JAS; Tao and Zhang 2014 JAMES)
")
9
Reduced Moisture Original Reduced Moisture Larger spread for RI onset time under medium shear condition Kill the TC vortex under large shear condition Reduced Moisture: 50% 100% linear decrease 200km 300km Sensitivity under different Environmental Moisture (Tao and Zhang 2014 JAMES)
")
10
Mean deep-layer (850-hPa – 200-hPa) shear of composite groups in time in relation to beginning of rapid intensification (RI)
 shear of composite groups in time in relation to beginning of rapid intensification (RI)")
11
Mean 850-hPa – 500-hPa tilt magnitude (km) for the composite groups of Edouard – using weighted horizontal circulation centers
 for the composite groups of Edouard – using weighted horizontal circulation centers")
12
Mean tilt magnitude (difference between 850-hPa and 500-hPa weighted PV centers) of composite groups in time in relation to beginning of rapid intensification (RI)
 of composite groups in time in relation to beginning of rapid intensification (RI)")
13
T RI – 48 h T RI – 36 h T RI – 24 h GOOD_LATE GOOD GOOD_EARLY

14
T RI – 12 h T RI T RI + 12 h GOOD_LATE GOOD GOOD_EARLY

15
-12h RI-9h RI -6h RI -3h RI RI+3h RI+6h RI +9h RI +12h RI+15h RI+18h RI+21h RI Realization of RI for an individual ensemble member (GOOD #26) Maximum radar reflectivity (dBZ; filled contours), Minimum SLP (gray contours) and Surface Winds (vectors)
 Maximum radar reflectivity (dBZ; filled contours), Minimum SLP (gray contours) and Surface Winds (vectors)")
16
-12h RI -9h RI-6h RI -3h RI RI+3h RI+6h RI +9h RI +12h RI +15h RI+18h RI+21h RI Realization of RI for an individual ensemble member (GOOD #31) Maximum radar reflectivity (dBZ; filled contours), Minimum SLP (gray contours) and Surface Winds (vectors)
 Maximum radar reflectivity (dBZ; filled contours), Minimum SLP (gray contours) and Surface Winds (vectors)")
17
Realization of RI for an individual ensemble member (GOOD #49) Maximum radar reflectivity (dBZ; filled contours), Minimum SLP (gray contours) and Surface Winds (vectors) -12h RI -9h RI -6h RI -3h RI RI+3h RI +6h RI +9h RI +12h RI +15h RI +18h RI+21h RI
 Maximum radar reflectivity (dBZ; filled contours), Minimum SLP (gray contours) and Surface Winds (vectors) -12h RI -9h RI -6h RI -3h RI RI+3h RI +6h RI +9h RI +12h RI +15h RI +18h RI+21h RI")
18
-12h RI-9h RI -6h RI -3h RI RI+3h RI +6h RI +9h RI +12h RI +15h RI +18h RI +21h RI Realization of RI for an individual ensemble member (GOOD #51) Maximum radar reflectivity (dBZ; filled contours), Minimum SLP (gray contours) and Surface Winds (vectors)
 Maximum radar reflectivity (dBZ; filled contours), Minimum SLP (gray contours) and Surface Winds (vectors)")
19
Sensitivity Experiments – Set #1 Sensitivity to composited initial conditions

20
Initial azimuthally-averaged tangential winds for the composite GOOD vortex (contours, m/s) and the differences between the GOOD_EARLY, GOOD and Poor vortex (filled contours, m/s) “GOOD_EARLY” – “GOOD” “GOOD” – “Poor”
 and the differences between the GOOD_EARLY, GOOD and Poor vortex (filled contours, m/s) GOOD_EARLY – GOOD GOOD – Poor")
21
Sensitivity Experiments – Set #2a Testing the strength of the GOOD_EARLY vortex Sensitivity Experiments – Set #2b Testing the strength of the GOOD_EARLY vortex

22
Sensitivity Experiments – Set #2b Testing the strength of the GOOD_EARLY vortex Sensitivity Experiments – Set #3 Testing the influence of the POOR environment

23
Sensitivity Experiments – Set #3 Testing the influence of the POOR environment

24
GOOD_EARLYGOODPOOR GOOD_EARLY GOOD POOR Environment Inner-Core Summary of Sensitivity on Inner-core vs. Environment

25
MDBZOLR Sensitivity on the impacts of diurnal cycles on different stages of Edouard’s life cycle (Tang &Zhang, in prep)
")
26
Sensitivity on the impacts of diurnal cycles on different stages of Edouard’s life cycle (Tang &Zhang, in prep) Take home message: night time destabilization crucial for the genesis and early stage of the TC but minimum impact after RI starts
 Take home message: night time destabilization crucial for the genesis and early stage of the TC but minimum impact after RI starts")
27
Melhauser, C., and F. Zhang, 2014: Diurnal radiation cycle impact on the pre-genesis environment of Hurricane Karl (2010). Journal of the Atmospheric Sciences, 71, 1241-1259. Impacts of diurnal cycles on the genesis of Karl (2010) (Melhauser and Zhang 2014 JAS)
. Journal of the Atmospheric Sciences, 71, Impacts of diurnal cycles on the genesis of Karl (2010) (Melhauser and Zhang 2014 JAS).")
28
Concluding remarks PSU realtime WRF-EnKF deterministic and ensemble prediction of Hurricane Edouard provides an excellent framework to assess the dynamics and predictability of genesis and rapid intensification Deep-layer wind shear magnitude is strongest throughout the simulation for POOR members and decreases in magnitude for all members that predicts the RI Shear magnitude decreases in all groups approximately 12 h prior to RI onset, while tilt magnitude begins to decrease in all groups approximately 24–48 h prior to RI RI onset timing relates to impact of wind shear on vortex tilt, location of convection (+randomness) & subsequent precession process Both the inner-core strength and environmental conditions are important to develop the right storm at the approximate time Diurnal cycle (nighttime phase) crucial for TC genesis and early development, and mature storm clouds but not max intensity after RI
 & subsequent precession process Both the inner-core strength and environmental conditions are important to develop the right storm at the approximate time Diurnal cycle (nighttime phase) crucial for TC genesis and early development, and mature storm clouds but not max intensity after RI")
29
72h-start sensitivity

30
Night-Only (no shortwave) OLR mdbz
 OLR mdbz")
31
Day-Only OLR

32
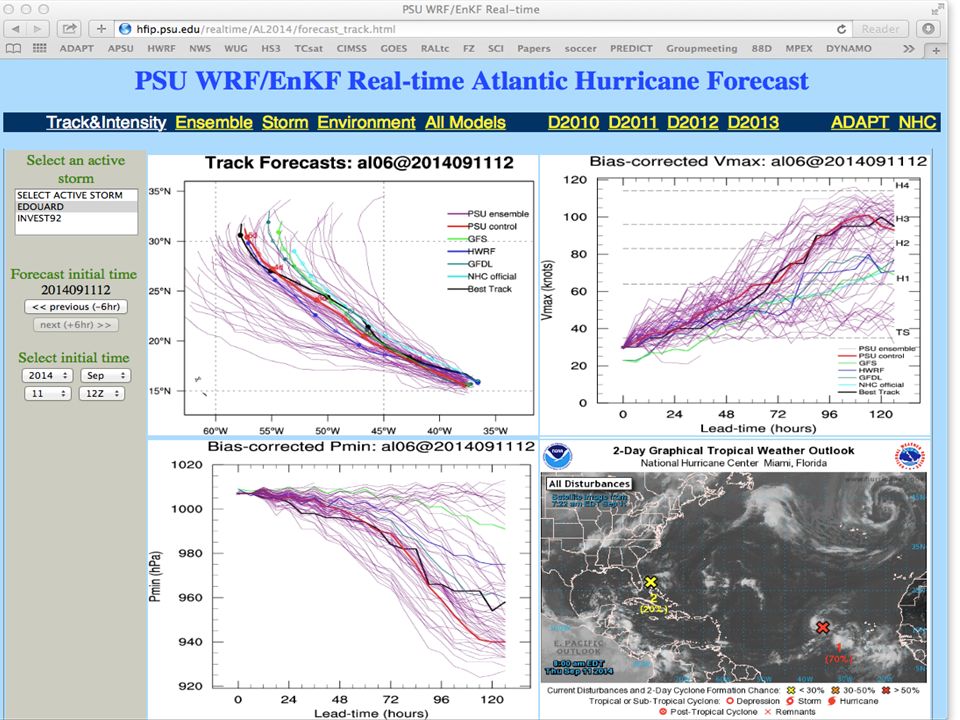
Hurricane Edouard Best Track PSU WRF-EnKF initialized at 12Z on Sept 11 th – TD 6 designation Simulation ends on 18Z on Sept 16 th – just after peak intensity (major hurricane, 1 st of HS3!) 2 HS3 flights performed during simulation window – 11-12 Sept and 14-15 Sept (18-27 h and 72-93 h)
 2 HS3 flights performed during simulation window – Sept and Sept (18-27 h and h)")
33
Sensitivity Experiments – Set #4 Assessing the radii at which the POOR environment becomes detrimental 200 – 300 km 500 – 800 km 1000 – 1200 km

34
850-hPa to 500-hPa mean tilt vector evolution for the composite groups of Edouard – using weighted horizontal circulation center

35
850-hPa to 500-hPa mean tilt vector evolution for the composite groups of Edouard – plotted in a shear-relative sense (where shear direction is always oriented westerly)
")
36
Initial azimuthally-averaged relative humidity for the composite GOOD vortex (contours) and the differences between the GOOD_EARLY and GOOD vortex (filled contours)
 and the differences between the GOOD_EARLY and GOOD vortex (filled contours)")
37
Initial azimuthally-averaged relative humidity for the composite GOOD vortex (contours) and the differences between the POOR and GOOD vortex (filled contours)
 and the differences between the POOR and GOOD vortex (filled contours)")
Similar presentations

 Longtao Wu, Hui Su, and Robert Fovell HS3 Science Meeting 2014 1 May 2014.>")
 Chris Davis (NCAR ESSL/MMM and RAL) Stan Trier (NCAR ESSL/MMM) Boulder, Colorado 60-h Radar Composite Animation (00.>")
 by Altug Aksoy (NOAA/AOML/HRD) HEDAS retrospective/real-time analyses have been performed for the years 2008-2011.>")


 from an African Easterly Wave Stefan Cecelski 1 and Dr. Da-Lin Zhang Department of Atmospheric and Oceanic Science, University.>")
 Stefan Cecelski 1 and Dr. Da-Lin Zhang Department of Atmospheric and Oceanic Science.>")


 Robert Rogers – 2010 HFP Field Program Director 1.>")
 Robert Rogers – 2010 HFP Field Program Director 1.>")
, 60-member ensemble, assimilate TDR Vr Notes: (1) mean of 60-member ensemble forecast.>")


 Zhan Li and Zhaoxia Pu.>")
