Download presentation
Presentation is loading. Please wait.

1
E. C. Meyers, G. M. McFarquhar, B. F. Jewett, S. W. Nesbitt University of Illinois at Urbana-Champaign 11 May 2010 Vertical Velocity and Microphysical Distributions Related to the Rapid Intensification of Hurricane Dennis (2005) E N W S Image Science and Analysis Laboratory, NASA-Johnson Space Center. "The Gateway to Astronaut Photography of Earth.” http://eol.jsc.nasa.gov/scripts/sseop/photo.pl?mission=ISS011&roll=E&frame=10221
 E N W S Image Science and Analysis Laboratory, NASA-Johnson Space Center. The Gateway to Astronaut Photography of Earth. mission=ISS011&roll=E&frame=")
2
E N W S Image Science and Analysis Laboratory, NASA-Johnson Space Center. "The Gateway to Astronaut Photography of Earth.” http://eol.jsc.nasa.gov/scripts/sseop/photo.pl?mission=ISS011&roll=E&frame=10216

3
Guiding Questions How do such isolated, inner-core, most- intense vertical velocities (i.e., convective bursts) cause and/or respond to rapid intensification (RI) of tropical cyclones?
 cause and/or respond to rapid intensification (RI) of tropical cyclones")
4
Guiding Questions How do such isolated, inner-core, most- intense vertical velocities (i.e., convective bursts) cause and/or respond to rapid intensification (RI) of tropical cyclones? What statistics can be gathered from a high- resolution simulation regarding convective bursts’ distributions, magnitudes, vertical structures, durations, proximities to the vortex center, and trends as precursors to RI?

5
Limited understanding of how RI may relate to convective bursts – 3-D structure – Timing – Distributions of latent heat Motivation

6
Limited understanding of how RI may relate to convective bursts – 3-D structure – Timing – Distributions of latent heat Need to statistically characterize the morphology of these isolated, intense vertical velocities and associated microphysics within observational voids Motivation

7
WRF Configuration Horizontal… 27-km 9-km 3-km 1-km d01 d02 d03 d04 736 784

8
WRF Configuration Vertical…

9
Dennis Track 00Z 06 July 2005 00Z 07 July 2005 00Z 08 July 2005

10
*10 min * Intensity

11
*10 min * Intensity -19 hPa (6 h) -1
 -1")
12
*10 min * Intensity

13
* * *10 min +36 kts (6 h) -1
 -1")
14
14:20Z-14:32Z 09 July 2005 [dBZ] [m s -1 ] 14:45Z-15:03Z 09 July 2005 Guimond et al. (2010, JAS) Are column- confined, averaged, and low-to-mid- level interpretations valid? Convective Bursts?
![14:20Z-14:32Z 09 July 2005 [dBZ] [m s -1 ] 14:45Z-15:03Z 09 July 2005 Guimond et al.](http://images.slideplayer.com/15/4752040/slides/slide_14.jpg "(2010, JAS) Are column- confined, averaged, and low-to-mid- level interpretations valid. Convective Bursts .")
15
10-min 2-min

16
10-min 2-min

17
CFAD 9 hours before RI 9 hours during RI Column Max Reflectivity s

18
9 hours before RI 9 hours during RI during – before RI CFAD Difference

27
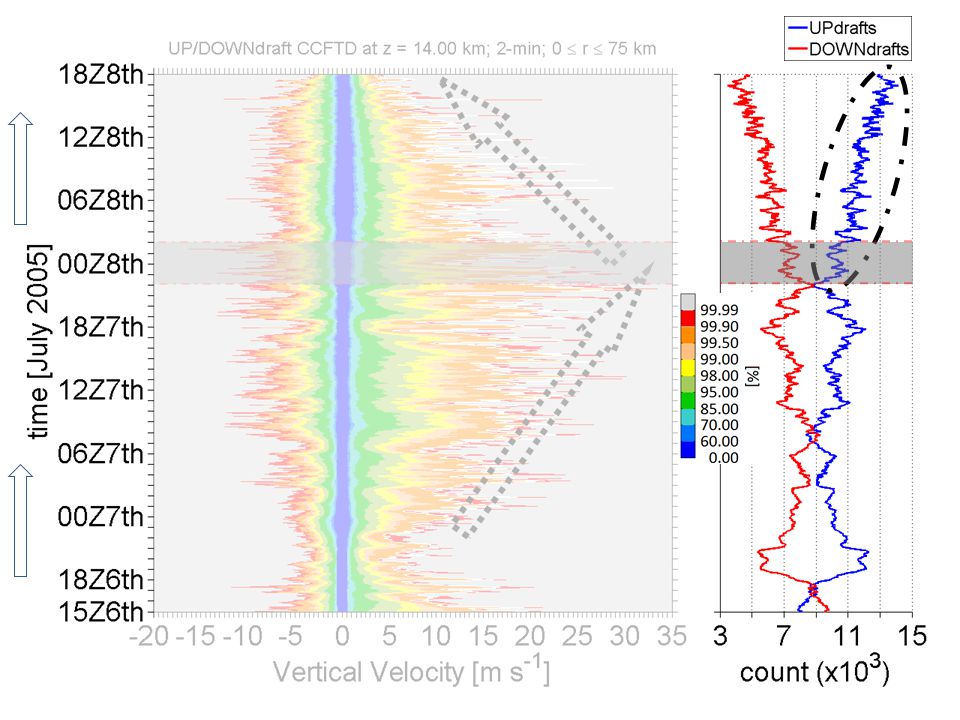
hourly 99.9 th percentile w [m s -1 ]
![hourly 99.9 th percentile w [m s -1 ]](http://images.slideplayer.com/15/4752040/slides/slide_27.jpg "hourly 99.9 th percentile w [m s -1 ]")
28
Interpretation of RI depends on: – Interval examined – ∆p min or ∆|v 10-m, max | perspective Discrete vertical level statistics provide better identification of convective bursts than column averages or thresholds Outlier (e.g., 99.9 th percentile) w better indicators of RI than averages – Precursor to RI at upper levels (e.g., 14 km) – Continual broadening and convergence toward TC center CONCLUSIONS
 w better indicators of RI than averages – Precursor to RI at upper levels (e.g., 14 km) – Continual broadening and convergence toward TC center CONCLUSIONS")
29
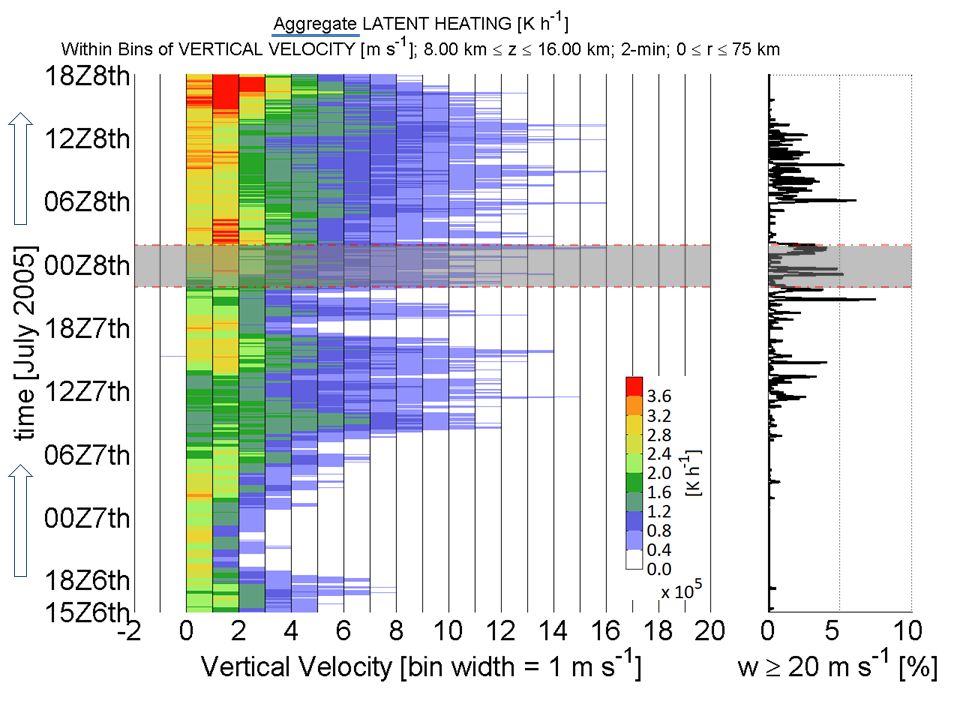
CONCLUSIONS, CONT’D Outlier (e.g., 99.9 th percentile) w at lower levels (e.g., 6 km), however, increase only after onset of and during RI Manifested as an increase in latent heating Precursor w have unnoticeable impact on latent heating – Vertical structure – Thresholds for definition Implications of these upper-level, rapidly accelerating updrafts for RI?
 w at lower levels (e.g., 6 km), however, increase only after onset of and during RI Manifested as an increase in latent heating Precursor w have unnoticeable impact on latent heating – Vertical structure – Thresholds for definition Implications of these upper-level, rapidly accelerating updrafts for RI")
30
Acknowledgements AMS Graduate Fellowship, Earth Science Div. of the Science Mission Directorate NASA Headquarters under the NESSF Program NASA Hurricane Science Program – Grant NNX09AB82G NOAA/GFDL WRF Modeling Community TeraGrid Seemingly endless list of students, staff, and faculty at the University of Illinois at Urbana-Champaign and beyond THANK YOU! Boston.com “Hurricanes, as seen from orbit” http://www.boston.com/bigpicture/2008/09/hurricanes_as_seen_from_orbit.html

32
*LH, Abe

34
< -80

35
Precursor to RI? Colin et al. (2009, Nature Geosci.)
")
37
*history interval accumulation ≤ 5 > 3 > 15

38
≤ 0 > -2 < -10 *instantaneous, @ output

39
≤ 0 > -60 < -540

41
> 1.0 < 5.0 > 30.0 < 40.0

44
2030Z7th

45
2036Z7th

46
2042Z7th

47
2048Z7th

48
2054Z7th

49
2100Z7th

50
Observed onset of RI

51
Every 6 hours from contour analysis of simulation

52
onset of simulated 24-hour period during which ∆p min ≤ -42 hPa Every 3 hours from contour analysis of simulation

53
onset of simulated 24-hour period during which ∆|v 10-m, max contour | ≥ +30 knots Every 6 hours from contour analysis of simulation

54
onset of simulated 24-hour period during which ∆|v 10-m, max contour | ≥ +30 knots Every 3 hours from contour analysis of simulation

55
hourly 99.9 th percentile w [m s -1 ]
![hourly 99.9 th percentile w [m s -1 ]](http://images.slideplayer.com/15/4752040/slides/slide_55.jpg "hourly 99.9 th percentile w [m s -1 ]")
56
Zhu and Zhang (2006, JAS) Li and Pu (2008, MWR) Relation to Microphysics only warm rain processes; hmmm… LI AND PU MARCH 2008 WSM3 WSM5 WSM6 Increasing inclusion of mixed-phase proc. graupel support Wang (2002)
.")
58
Rogers (2010, JAS)
")
60
MEAN, convective regions

66
72.9°W 71.6°W 15.6°N 16.7°N (|V 10-m | ≥ 30 knots) contoured (interval = 5 knots) in black 18:00Z 06 July 2005
 contoured (interval = 5 knots) in black 18:00Z 06 July 2005")
67
What About the Vertical?

69
> 35 < 40 > 15 < 20

70
< 364 > 372 < 374

71
> 370 < 374 > 358 < 362

Similar presentations


 Hua Chen Committee members: Dr. Da-Lin Zhang (Advisor) Dr. James Carton Dr. Chuan Liu (Dean’s Representative)>")

 from an African Easterly Wave Stefan Cecelski 1 and Dr. Da-Lin Zhang Department of Atmospheric and Oceanic Science, University.>")

 Stefan Cecelski 1 and Dr. Da-Lin Zhang Department of Atmospheric and Oceanic Science.>")


 Associated With the ITCZ Breakdowns The UMD/NASA-GSFC Users' and Developers' Workshop,>")

 Wen-Chau Lee*Michael.>")


 Zhan Li and Zhaoxia Pu.>")
 JungHoon Shin and Da-Lin Zhang Department of Atmospheric & Oceanic.>")


: Insights from New Remote Sensing Measurements Collaborators: Anthony Didlake (NPP/GSFC),Gerry Heymsfield.>")
 Daniel Nelson, Jung Hoon Shin, and Da-Lin Zhang Department of Atmospheric and Oceanic Science University.>")

 PI: Yongsheng Chen, York University, Toronto, Ontario, Canada Co-PIs: George H. Bryan and Richard.>")