Download presentation
Presentation is loading. Please wait.

1
Plant Responses To Land Mosaics EEES 4760/6760, University of Toledo Feb19, 2007 Reading: Chapter 2

2
Highlights 1.Patches Level: Patches & AEI 2.Within Landscape: Movement Corridors, Matrix, etc. 3.Between Landscapes:

3
Chequamegon N.F. Land Mosaic Water (0.39%) Wetland (0.02%) Non-Vegetated / Recent Clearcut (4.03%) Herbs & Shrubs / Old Clearcut (18.93%) Young Hardwoods / Thickets (4.87%) Mature Hardwoods (31.31%) Jack Pine (5.44%) Red Pine (12.76%) Mixed Hardwood/Conifer (22.25%)
 Wetland (0.02%) Non-Vegetated / Recent Clearcut (4.03%) Herbs & Shrubs / Old Clearcut (18.93%) Young Hardwoods / Thickets (4.87%) Mature Hardwoods (31.31%) Jack Pine (5.44%) Red Pine (12.76%) Mixed Hardwood/Conifer (22.25%).")
4
How do landscape structure and broad- scale disturbance regime influence plant species diversity and distribution across multiple scales? Does harvesting mimic fire in its effects on plant diversity and/or composition? Is plant species distribution or diversity related to particular structural features or broad-scale structural patterns? Does plant diversity vary across scales and if so, how?

5
PB: fire SB: small-block clearcutting LB: large-block clearcutting POA: thinning Broad-Scale Manipulation of Landscape Structure

6
Multi-Scale Approach Patch Level Seven Patch Types (77 plots) Within Landscape Moquah Barrens Wildlife Management Area Among Landscapes northern Chequamegon National Forest (DFC eco-units)
 Within Landscape Moquah Barrens Wildlife Management Area Among Landscapes northern Chequamegon National Forest (DFC eco-units)")
7
Hardwood Jack Pine Pine Barrens Clearcut Young PineRed Pine Young Hardwood Major Patch Types

8
Patch-Level Measurements Overstory dbh height age Understory percent cover by species duff depth (cm) litter (% cover and depth, cm) coarse woody debris (CWD, % cover) Soils grab samples by horizon (4 pits per site) horizons present horizon depth Soil Lab Analysis pH moisture (%) total organic matter (%) total N (%) total C (%) 5 m 20 m
 litter (% cover and depth, cm) coarse woody debris (CWD, % cover) Soils grab samples by horizon (4 pits per site) horizons present horizon depth Soil Lab Analysis pH moisture (%) total organic matter (%) total N (%) total C (%) 5 m 20 m")
9
Plant Diversity Shannon Index (H’) 50 40 30 20 10 2.6 2.1 1.6 1.1 0.6 Richness Pine Barrens ClearcutY. PineJack PineRed Pine Y. Hardwood Hardwood Pine Barrens ClearcutY. PineJack PineRed Pine Y. Hardwood Hardwood a a abab abab abab abab b a a a a a a a

10
Species Composition

11
Variables Used in Regression Analysis Dependent Variables Richness Shannon Diversity Index (H’) Independent Variables Litter cover, % Litter depth, cm Duff depth, cm Coarse woody debris (CWD), % pH of each horizon (A, E, B) Organic matter content, % (A, E, B) Soil moisture, % (A, E, B) Total N content, % (A, E, B) Total C content, % (A, E, B) C/N ratio Aspect/Slope Variable [ tan(slope)*cos(aspect-45), see Stage 1976 ] All variables were first standardized, then transformed as needed for non-normal distributions
![Variables Used in Regression Analysis Dependent Variables Richness Shannon Diversity Index (H’) Independent Variables Litter cover, % Litter depth, cm Duff depth, cm Coarse woody debris (CWD), % pH of each horizon (A, E, B) Organic matter content, % (A, E, B) Soil moisture, % (A, E, B) Total N content, % (A, E, B) Total C content, % (A, E, B) C/N ratio Aspect/Slope Variable [ tan(slope)*cos(aspect-45), see Stage 1976 ] All variables were first standardized, then transformed as needed for non-normal distributions](http://images.slideplayer.com/34/8313110/slides/slide_11.jpg "Variables Used in Regression Analysis Dependent Variables Richness Shannon Diversity Index (H’) Independent Variables Litter cover, % Litter depth, cm Duff depth, cm Coarse woody debris (CWD), % pH of each horizon (A, E, B) Organic matter content, % (A, E, B) Soil moisture, % (A, E, B) Total N content, % (A, E, B) Total C content, % (A, E, B) C/N ratio Aspect/Slope Variable [ tan(slope)*cos(aspect-45), see Stage 1976 ] All variables were first standardized, then transformed as needed for non-normal distributions")
12
Regression Results

13
PB: fire POA: thinning LB: large-block clearcuts SB: small-block clearcuts Landscape Level

14
Length: 3000+ m n=600+ plots Plot size: 1x1 m Transect Measurements 5 m percent cover by species canopy cover (%) litter cover (%) litter depth (cm) cwd (%) duff depth (cm) species, dbh, % cover overstory trees patch type
 litter cover (%) litter depth (cm) cwd (%) duff depth (cm) species, dbh, % cover overstory trees patch type")
16
Select Species Distributions OPB BOPBOPBPASPBCCYA2 H2 H1 JPOSPB MA YA1 0 50 100 0 10 20 0 15 30 0 40 80 0 3 6 0 1 2 1000 0 2000 3000 Percent Cover Distance (m) Pteridium aquilinum Amelanchier arborea Hieracium aurantiacum Conyza canadensis Trientalis borealis Trifolium pratense
 Pteridium aquilinum Amelanchier arborea Hieracium aurantiacum Conyza canadensis Trientalis borealis Trifolium pratense")
17
Transect Summary

18
Plant Species Functional Groups >1.50 + association < 0.50 - association

19
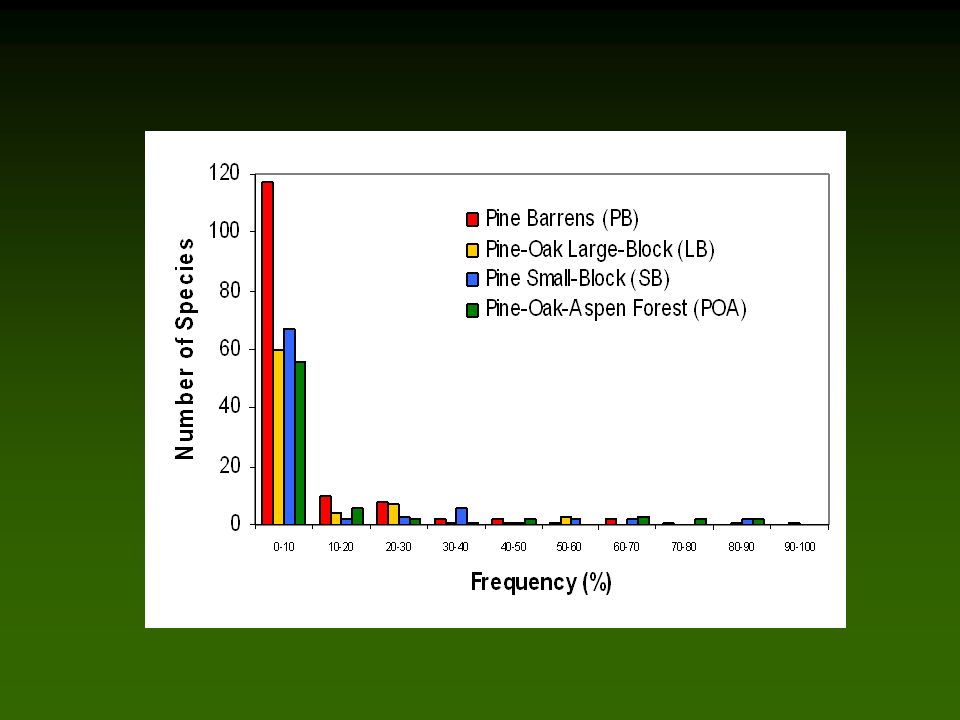
Small-Block PinePine-Oak-Aspen Forest Large-Block Pine OakPine Barrens Landscape Level (Four Landscapes) Do differences among landscape-level disturbance regimes influence patterns of understory plant diversity or composition?
 Do differences among landscape-level disturbance regimes influence patterns of understory plant diversity or composition")
20
Landscape Structure and Plant Distribution

21
Cumulative Species Richness RRP MP TRP60RJP RP12 OCC RP7 OCC TRP60 CC MA BOPB OPB PA SPB CC YA2 H2 H1 JPO SPB OPB YA2 OC C OBCCOCCHHHF F2 JPO RP5 MP NC C POA RP15 ORP15 H2 MP F2 HHH H H F H2 C RP60 Distance (m) Number of Species Pine Barrens Large-Block PO Small-Block Pine POA Forest Old Harvest Landing Sand Road- Mod. Use Sand Road- Light Use Clearing Access Road ATV Trail Dry Streambed Grassy Roadside

22
Plant Distribution Along the Transect

23
Wavelet Analysis of Shannon Diversity (H’) 1500 Old Harvest Landing Sand Road- Mod. Use Sand Road- Light Use Clearing Access Road 0 1000 500 Resolution (m) OPBBOPBOPBPASPBCCYA2 H2 H1JPOSPB OPB MA YA2 1000020003000 Distance (m) H’ 0 1.0 2.0 1000 1500 500 0 0 0.6 1.2 W. Var. Scale W E
 OPBBOPBOPBPASPBCCYA2 H2 H1JPOSPB OPB MA YA Distance (m) H’ W. Var. Scale W E.")
24
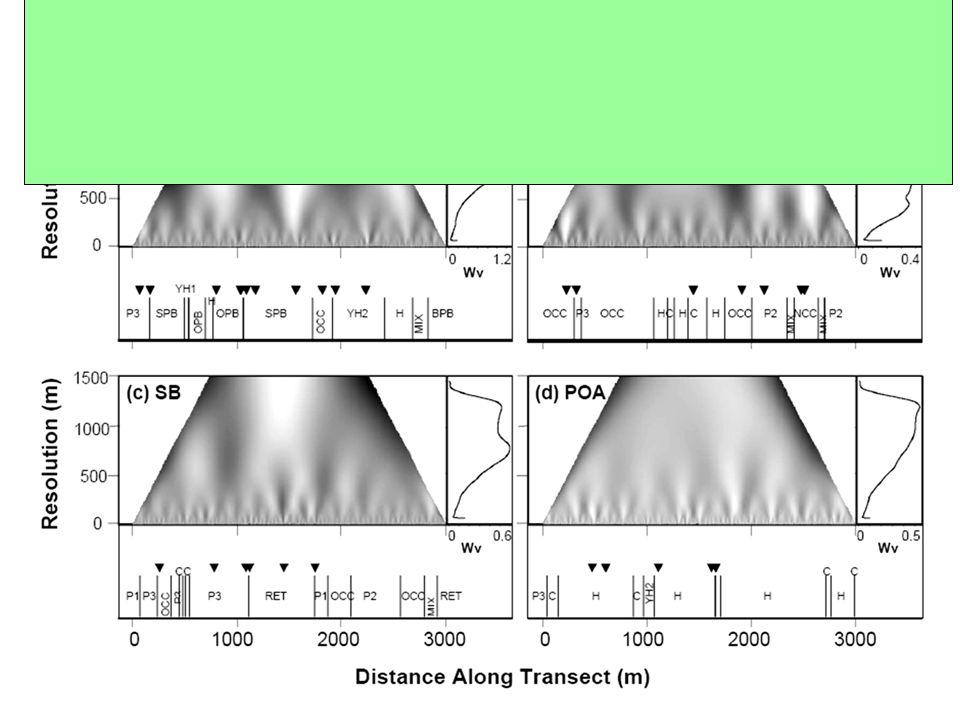
Wavelet Analysis Comparison 100050001500200025003000 BOPBOPB PA SPB CC YA2 H2 H1 JPO SPB OPB MA YA2 OCC OBCCOCCHHHF F2 JPO RP5 MP NCC POA RP15 ORP15 100050001500200025003000 0 500 1000 1500 0 500 1000 1500 Resolution (m) Distance (m) Pine Barrens POA Forest Small- Block Pine Large- Block PO MP F2 HH H H H H2 F C TRP60RJP RP12 RRP OCCRP7 RP60 OCC MP OCC TRP60 CC W E Old Harvest Landing Sand Road- Mod. Use Sand Road- Light Use Clearing Access Road ATV Trail Dry Streambed Grassy Roadside

25
Wavelet Variance of litter cover for the four study transects

Similar presentations