Download presentation
Presentation is loading. Please wait.

1
Impact of Southern Pine Beetle Outbreaks on Wildlife Habitat Suitability Maria D. Tchakerian 1, Robert N. Coulson 1, Jaehyung Yu 1, and Forrest Oliveria 2 1. Knowledge Engineering Laboratory, Texas A&M University 1. Knowledge Engineering Laboratory, Texas A&M University College Station, Texas, USA College Station, Texas, USA 2. USDA Forest Service, Forest Health Protection, Pineville, Louisiana, USA 2. USDA Forest Service, Forest Health Protection, Pineville, Louisiana, USA

2
Impact of insects on forests –on forest resources Timber production Biodiversity Recreation, etc. –on forest conditions Abiotic Biotic Composition Configuration

3
Native InsectNative Insect –Primary killer of pines –Thirty-day life cycle, with continuous adult emergence through much of the year. –Cyclic in nature –High populations killing new host species –Range expanding? Southern pine beetle Dendroctonus frontalis (Coleoptera: Scolytidae)
.")
4
The number of years in which the southern pine beetle reached outbreak status since 1960 (USDA-FS 2004).
.")
5
Growth and dynamics of southern pine beetle infestations

6
Goal To evaluate how changes in forest composition and configuration resulting from Southern Pine Beetle (SPB) herbivory impact the quality of wildlife habitats in a meso-scale southern forest landscape.
 herbivory impact the quality of wildlife habitats in a meso-scale southern forest landscape.")
7
Study Area Bankhead National Forest Alabama

10
1960’s Loblolly Stand

11
Early 2002 Loblolly Stand

12
P. taeda stand, Bankhead National Forest, Alabama Forest Stand Conditions Average dbh 30 cm Average height 30 m Canopy cover 85 % Trees/hectare 890

13
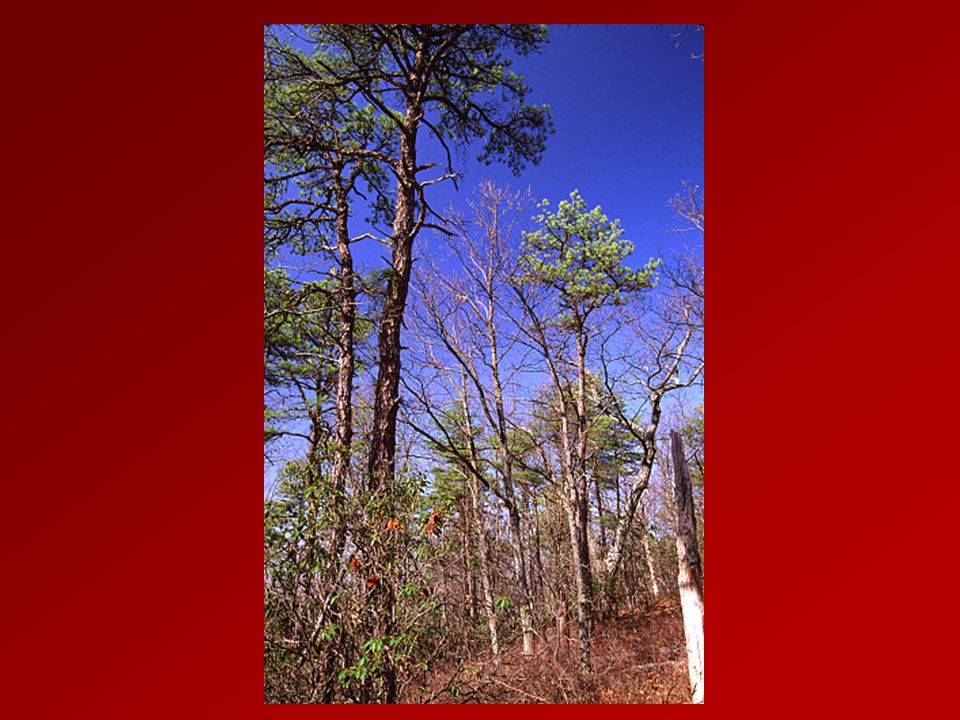
Loblolly Stand after SPB Loblolly Stand after SPB

16
Ecological Succession in a Pine Forest Landscape (Modified from Holling 1991)
")
17
Methods Stand data ( CISC Database and Alabama FVS-Ready FIA Database –inventory year 1990) Stand Simulation (Simulated Forest Growth to 2002 conditions using FVS Southern Variant, SVS) Scenario 1: No SPB (No SPB infestation and no silvicultural treatment) Scenario 2: SPB Infestation (SPB disturbance into the stands identified during the epidemic) Stand conditions without SPB Stand conditions with SPB
 Stand Simulation (Simulated Forest Growth to 2002 conditions using FVS Southern Variant, SVS) Scenario 1: No SPB (No SPB infestation and no silvicultural treatment) Scenario 2: SPB Infestation (SPB disturbance into the stands identified during the epidemic) Stand conditions without SPB Stand conditions with SPB")
18
Stand conditions (Scenarios 1 and 2) Habitat Suitability Index (HSI) Habitat Suitability Index (HSI) Calculations at stand level Landscape Habitat Suitability ( Aggregated HSI values for the stands) Landscape Pattern Analysis (Landscape metrics) Methods
 Habitat Suitability Index (HSI) Habitat Suitability Index (HSI) Calculations at stand level Landscape Habitat Suitability ( Aggregated HSI values for the stands) Landscape Pattern Analysis (Landscape metrics) Methods")
19
Habitat Suitability Index (HSI) Models Developed in the 80’s to quantify impacts on habitats caused by water or land use changesDeveloped in the 80’s to quantify impacts on habitats caused by water or land use changes Published by the US Fish and Wildlife Service http://www.nwrc.usgs.gov/wdb/pub/hsi/hsiindex.htmPublished by the US Fish and Wildlife Service http://www.nwrc.usgs.gov/wdb/pub/hsi/hsiindex.htm Simple, general, standardizedSimple, general, standardized Based upon variables that can often be estimatedBased upon variables that can often be estimated
 Models Developed in the 80’s to quantify impacts on habitats caused by water or land use changesDeveloped in the 80’s to quantify impacts on habitats caused by water or land use changes Published by the US Fish and Wildlife Service by the US Fish and Wildlife Service Simple, general, standardizedSimple, general, standardized Based upon variables that can often be estimatedBased upon variables that can often be estimated")
20
Management Indicator Species Selected Pine warbler Wild turkey Gray squirrel Northern Bobwhite

21
Habitat Pattern Habitat Suitability Index maps createdHabitat Suitability Index maps created HSI maps reclassified:HSI maps reclassified: – –Class 0, HSI=0 – –Class 1, 0 < HSI < 0.25 – –Class 2, 0.25 < HSI < 0.5 –Class 3, 0.5 HSI < 0.75 –Class 4, 0.75 HSI 1 FRAGSTATS 3.3 used to quantify attributes of each classFRAGSTATS 3.3 used to quantify attributes of each class

22
Pine Warbler HSI To evaluate the habitat suitability for cover and reproduction, three habitat variables were used:To evaluate the habitat suitability for cover and reproduction, three habitat variables were used: –V1 = Percent tree canopy closure of overstory pines –V2 = Successional stage of stand –V3 = Percent of dominant canopy pines with deciduous understory in the upper one third layer

23
Pine Warbler With SPB Without SPB Class 3 Class 4 Class 3 Class 4

24
Class 3 decreased by 37% Metrics Class 3 Without SPB With SPB Class Area (Ha) 22,82214,464 # of Patches 606794 Patch density 1.472.56 Mean Patch Size 37.6618.21 Mean Core Area 6.922.50
 22,82214,464 # of Patches Patch density Mean Patch Size Mean Core Area")
25
Gray Squirrel HSI To evaluate winter food and cover/reproduction habitat:To evaluate winter food and cover/reproduction habitat: –Winter food V1 = Percent canopy closure of trees that produce mast > 10 inches dbhV1 = Percent canopy closure of trees that produce mast > 10 inches dbh V2 = Diversity of hard mast producer treesV2 = Diversity of hard mast producer trees –Cover and reproduction V3 = Percent tree canopy closureV3 = Percent tree canopy closure V4 = Average dbh of overstory treesV4 = Average dbh of overstory trees V5 = Percent shrub crown coverV5 = Percent shrub crown cover

26
Gray Squirrel With SPB Without SPB

27
Metrics Class 3 Without SPB With SPB Class Area (Ha) 18,62418,293 # of Patches 419424 Patch density 1.361.95 Mean Patch Size 44.4443.14 Mean Core Area 9.08.7
 18,62418,293 # of Patches Patch density Mean Patch Size Mean Core Area")
28
Eastern Wild Turkey HSI (a more complicated example) To evaluate summer food and brood; fall, winter, and spring food; and cover.To evaluate summer food and brood; fall, winter, and spring food; and cover. –Summer food and brood habitat % herbaceous canopy cover, average height of canopy cover, distance to forest cover types % herbaceous canopy cover, average height of canopy cover, distance to forest cover types –Fall, winter, and spring food habitat Number of hard mast producing tress/ha > 10 inches dbh, % canopy closure of soft mast producing trees, % shrub crown cover (food production, behavioral, and of soft mast producing shrubs)Number of hard mast producing tress/ha > 10 inches dbh, % canopy closure of soft mast producing trees, % shrub crown cover (food production, behavioral, and of soft mast producing shrubs)
Number of hard mast producing tress/ha > 10 inches dbh, % canopy closure of soft mast producing trees, % shrub crown cover (food production, behavioral, and of soft mast producing shrubs).")
29
Eastern Wild Turkey- Summer Food and Brood Habitat With SPB Without SPB

30
Class 3 increased by ~ 1280 % Metrics Class 3 Without SPB With SPB Class Area (Ha) 82412,559 # of Patches 65450 Patch density 0.171.20 Mean Patch Size 12.6860.12 Mean Core Area 0.9413.8
 82412,559 # of Patches Patch density Mean Patch Size Mean Core Area")
31
Eastern Wild Turkey- Fall/Winter/Spring Food Habitat With SPB Without SPB

32
Class 3 decreased ~ 28% Class 4 decreased ~ 8% Metrics Class 3 Without SPB With SPB Class Area (Ha) 29,87521,572 # of Patches 618813 Patch density 0.871.37 Mean Patch Size 48.3426.53 Mean Core Area 12.645.28
 29,87521,572 # of Patches Patch density Mean Patch Size Mean Core Area")
33
Northern Bobwhite HSI To evaluate winter food habitat suitability in forest cover typesTo evaluate winter food habitat suitability in forest cover types –% canopy cover of herbaceous food plants –% of ground that is bare or covered with a light litter –Number of pine or oak trees/ha >10 inches

34
Northern Bobwhite – Winter Food Habitat With SPB Without SPB

35
Class 3 increased ~ 55% Metrics Class 3 Without SPB With SPB Class Area (Ha) 18,55028,924 # of Patches 419626 Patch density 0.591.88 Mean Patch Size 44.2746.20 Mean Core Area 9.2915.15
 18,55028,924 # of Patches Patch density Mean Patch Size Mean Core Area")
36
CONCLUSIONS 1. Using stand data, the FVS, and the HSI we created maps that defined classes of habitat suitability in a meso-scale forest landscape for 4 wildlife species.1. Using stand data, the FVS, and the HSI we created maps that defined classes of habitat suitability in a meso-scale forest landscape for 4 wildlife species. 2. Using data from SPB spots we evaluated the effects of an outbreak of the southern pine beetle on habitat suitability for the 4 species.2. Using data from SPB spots we evaluated the effects of an outbreak of the southern pine beetle on habitat suitability for the 4 species. 3. Impact varied in predictable ways by species:3. Impact varied in predictable ways by species: –Pine Warbler habitat was destroyed. –Grey Squirrel habitat was not affected. –Wild Turkey habitat was affected both negatively and positively. –Northern Bobwhite Quail habitat was enhanced. 4. The effect of the insect outbreak was to perforate the forest landscape which generally decreased habitat patch size, increased habitat patch density, increased habitat patch number, and reduced core area of habitat patches.4. The effect of the insect outbreak was to perforate the forest landscape which generally decreased habitat patch size, increased habitat patch density, increased habitat patch number, and reduced core area of habitat patches. 5. Habitat for each species was always present within the national forests. Another dimension to the study will be an investigation of species movements in relation to dispersion patterns of habitat patches.5. Habitat for each species was always present within the national forests. Another dimension to the study will be an investigation of species movements in relation to dispersion patterns of habitat patches.

37
Critical Issues Detailed pre and post spb outbreaks forest inventory dataDetailed pre and post spb outbreaks forest inventory data Validation of results of habitat models vs. current data on wildlife speciesValidation of results of habitat models vs. current data on wildlife species Development of alternative methods to evaluate positive and negative impact of insect outbreaks on forestsDevelopment of alternative methods to evaluate positive and negative impact of insect outbreaks on forests

Similar presentations


 on forest vegetation in eastern North America Jason S. Kilgore,>")


