Download presentation
Presentation is loading. Please wait.

1
The Cod Day Marine Laboratory, Aberdeen, 2 October 2012 The Cod Day - Science Coby Needle, Nick Bailey, Rui Catarino, Steven Holmes Marine Laboratory Aberdeen

2
Outline North Sea cod West of Scotland cod Future developments

3
North Sea cod – Outline Data –Stock area –Catch data –Stock distribution –Catch rates from observed vessels –Sampling and observer coverage –Natural mortality estimates –Data collation Assessment Advice

4
WoS cod – stock area

5
WoS cod – official landings

6
WoS cod – catches 2011 Removals = 6.36 kt Landings = 0.52 kt (8%), discards = 5.84 kt (92%)
, discards = 5.84 kt (92%)")
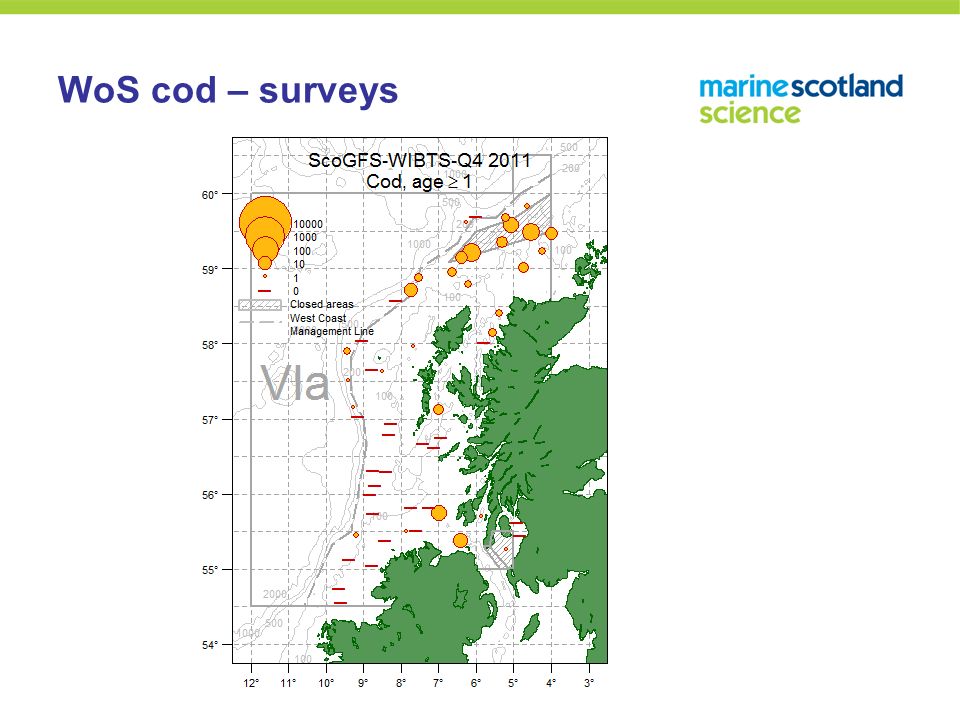
7
WoS cod – surveys Available surveys: –ScoGFS-WIBTS-Q1: 1985–2010 Became UKSGFS-WIBTS-Q1 in 2011 –ScoGFS-WIBTS-Q4: 1996-2009 Became UKSGFS-WIBTS-Q4 in 2011 –IGFS-WIBTS-Q4 Only ScoGFS-WIBTS-Q1 used in assessment 2013 assessment: Too soon to use UKSGFS (& stock subject to 1.5% bycatch rule).
.")
8
WoS cod – surveys

10
Q4 2010 Q4 2011

11
WoS cod – Int. effort TR1 = Trawl gear with mesh ≥ 100mm

12
WoS cod – Int. effort TR2 = Trawl gear with mesh ≥ 70mm & < 100mm

13
WoS cod – Int. effort LL = Long Lines

14
WoS cod – Int. effort GN = Gill nets & entangling nets

15
Reg. gear2011 %Av. 09-11 % TR192.8%95% TR26.98%5% GN10.22%V small % OthersV small % WoS cod – Int. cod catch

16
WoS – TR1 landings COD ANGLER HADDOCK SAITHE

17
WoS – TR1 & TR2 landings WHITING NEPHROPS

18
WoS cod – observer coverage 2011 FleetDeclared landings (tonnes) Number of trips sampled Discard weight (tonnes) Discard rate All11015157293.5% TR1 (whitefish) 1028143993.4% TR2 (Nephrops) 8713394.3%
 Number of trips sampled Discard weight (tonnes) Discard rate All % TR1 (whitefish) % TR2 (Nephrops) %")
19
WoS cod – port sampling coverage 2011 Demersal trips landing cod614 Demersal trips landing cod – that were sampled 12 % of trips sampled2% No. fish measured158 No. otoliths taken (for ageing) 123 CV on total numbers0.14
 123 CV on total numbers0.14.")
20
WoS cod – mean weight-at-age in catches

21
WoS cod – natural mortality estimates

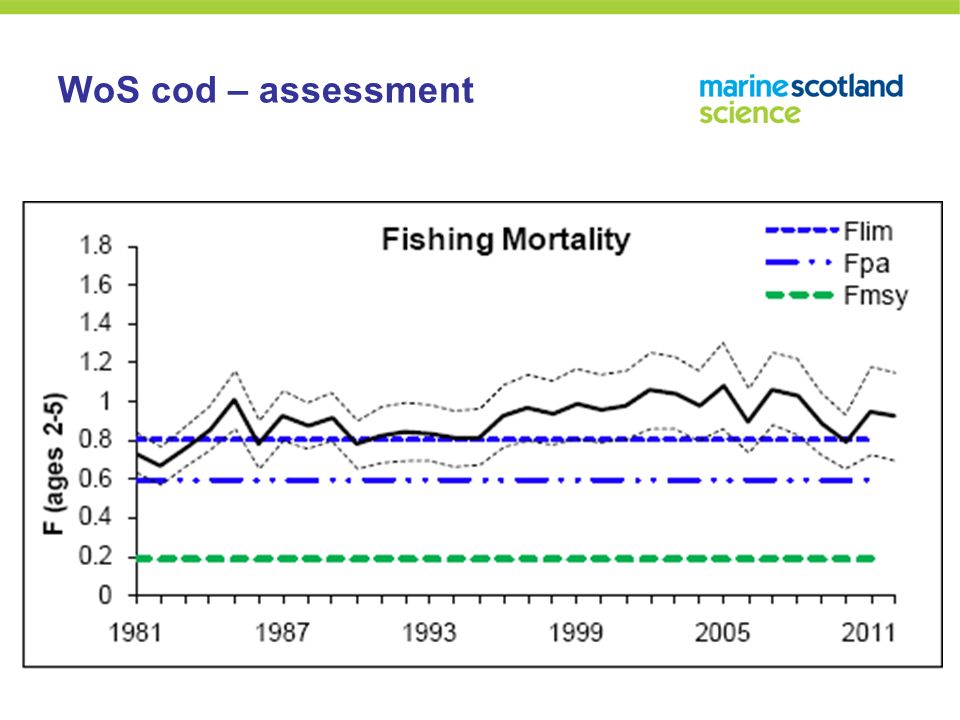
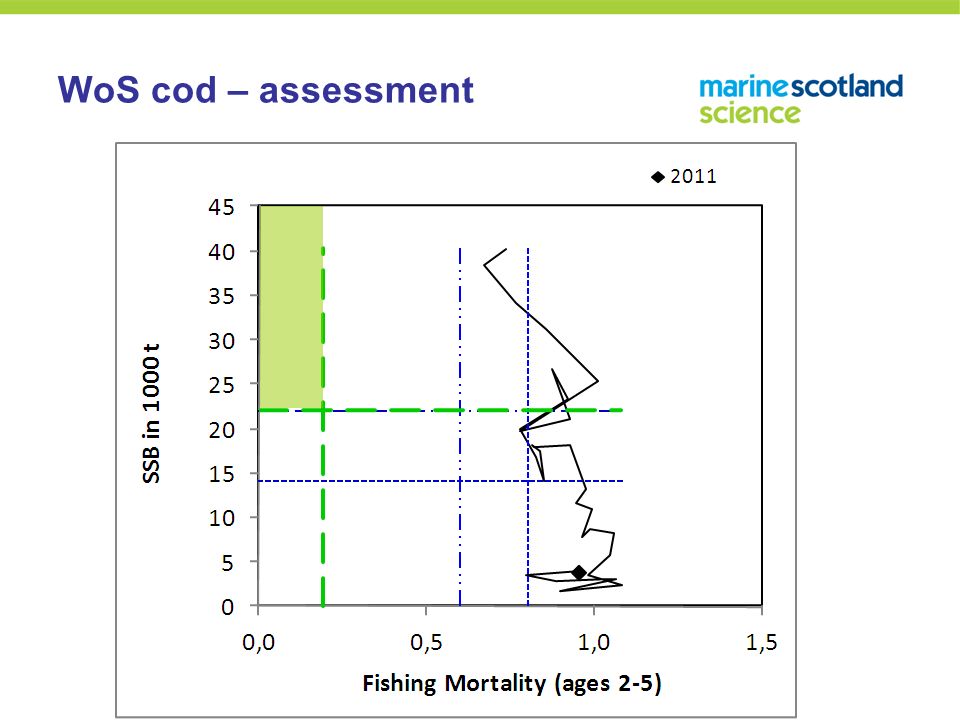
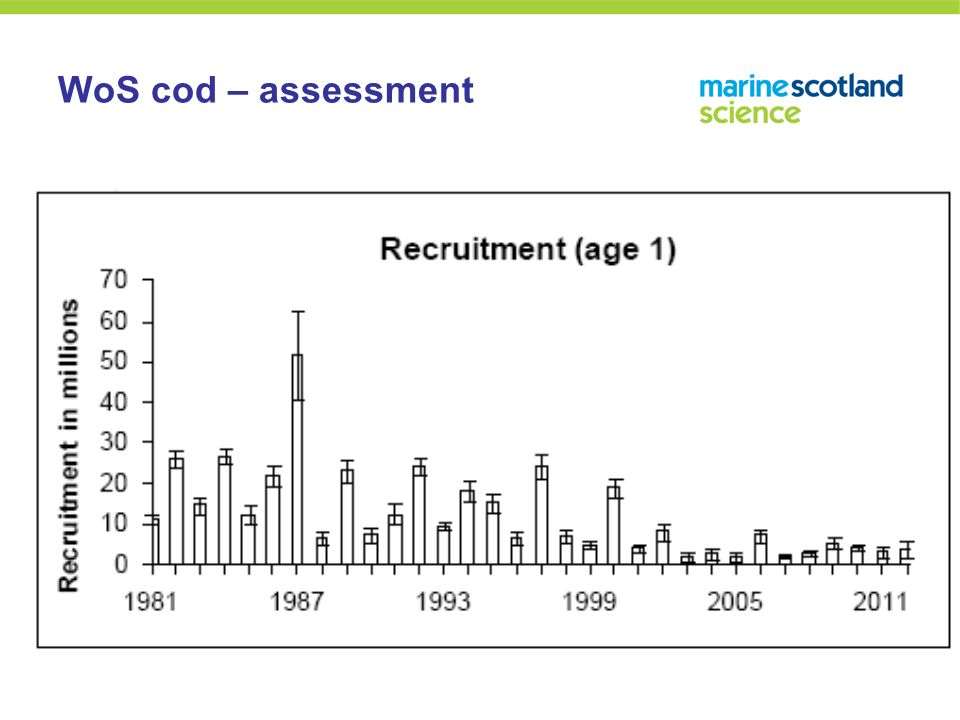
22
WoS cod – assessment Assessed using the TSA method –Includes ScoGFS-WIBTS-Q1 survey, landings & discards –Landings 1995-2005 not used (suspected as biased) –No survey data for 2011-2012. TSA - same basic approach as SAM model but developed in house (Rob Fryer)
.")
23
WoS cod – assessment

27
WoS cod mortality – lnds vs dis

28
WoS cod – assessment

29
WoS cod – area misreporting

30
WoS cod – Management plan Unlike N Sea F reduction only related to previous year Reduction depends on prediction of SSB at start of TAC year: –25% reduction in F if SSB < Blim –15% reduction in F if Blim < SSB < Bpa –Min(10% reduction in F or F=0.4) if SSB > Bpa But 20% limit to changes in TAC But But 25% TAC reduction if stock unhealthy yet ‘data poor’ Also – ICES has never accepted management plan as precautionary
 if SSB > Bpa But 20% limit to changes in TAC But But 25% TAC reduction if stock unhealthy yet ‘data poor’ Also – ICES has never accepted management plan as precautionary")
31
WoS cod – Advice MSY approach –MSY framework:TAC = 30 t –MSY transition:TAC = 270 t But because SSB << Blim advice was for zero catch

32
North Sea cod – forecasts & advice (June 2012) For both management plan phases: –Maximum effort reduced in line with F (but with bycatch rules). –± 20% constraint on annual quota changes. –Forecasts based on estimate total removals, which are then split into: Landings (quota). Discards. Unaccounted removals. Other Articles relevant also: –Article 9: data-poor situations. –Article 10: different approach if recovery not working. –Article 13: derogations to reduce effort cuts.
. Discards. Unaccounted removals. Other Articles relevant also: –Article 9: data-poor situations. –Article 10: different approach if recovery not working. –Article 13: derogations to reduce effort cuts..")
Similar presentations

 Carmen Fernández, ICES ACOM vice-chair.>")


>")


 Ciaran Kelly (Fisheries Science Services, Marine Institute) Edward.>")
 Channel Case - study Channel Fisheries Model cemare.>")


, Casey (1996), Harley (2000), Dingsør (2001), Palsson (2003), McBride.>")


