Download presentation
Presentation is loading. Please wait.

2
Objective To map out a Forest Community and to compare and contrast different soil types

4
How It all was done 4 First perimeter triangles were placed out for reference point so that I did not cross old paths and previously recorded trees

5
How It all was done 4 Trees were “marked” digitally by a GPS unit. And given a number (waypoint)
")
6
How It all was done 4 Then the species name and DBH (Diameter Breast Height) were correlated with Waypoint number
 were correlated with Waypoint number")
7
How It all was done 4 The GPS data was then transferred to the computer via Waypoint.exe. 4 The Points were taken from Waypoint format and projected into a Archview layout of the Heinke Farm Using AV Garmin Software

8
How It all was done 4 The GPS data was then transferred to the computer via Waypoint.exe. 4 The Points were taken from Waypoint format and projected into a Archview layout of the Heinke Farm Using AV Garmin Software

9
How it all was done 4 The trees were laid over the soil map and the Quadrats were picked by three characteristics 4 1. They had to be within a 1000 sq meter Quadrat 4 2. All the trees were on the forest edge 4 3. All the trees were on the same soil type

10
How it all was done 4 The trees were laid over the soil map and the Quadrats were picked by three characteristics 4 1. They had to be within a 1000 sq meter Quadrat 4 2. All the trees were on the forest edge 4 3. All the trees were on the same soil type

11
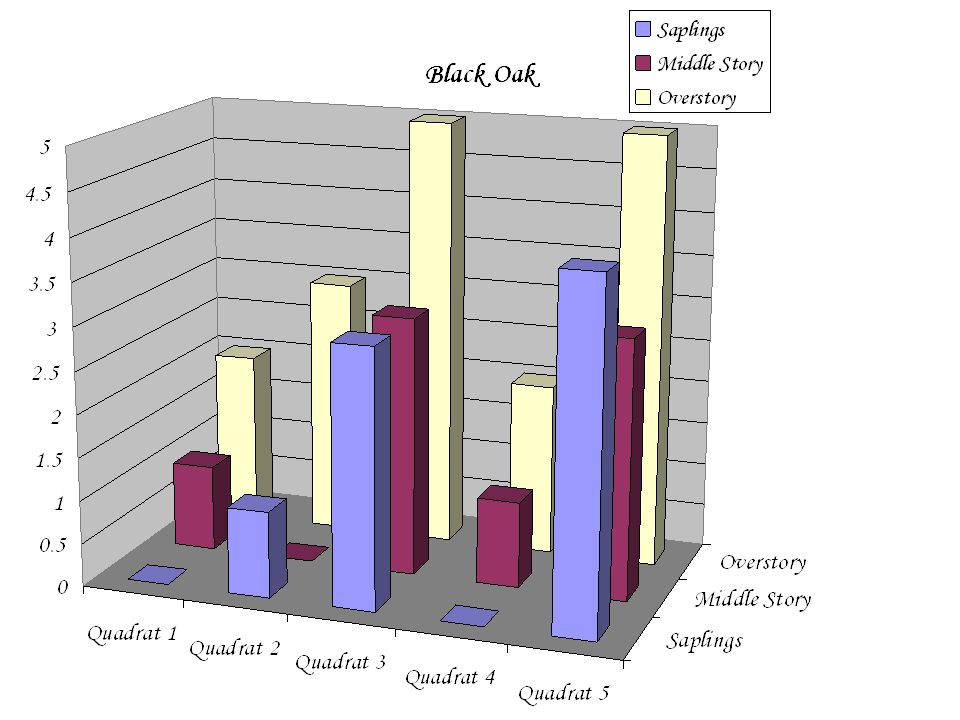
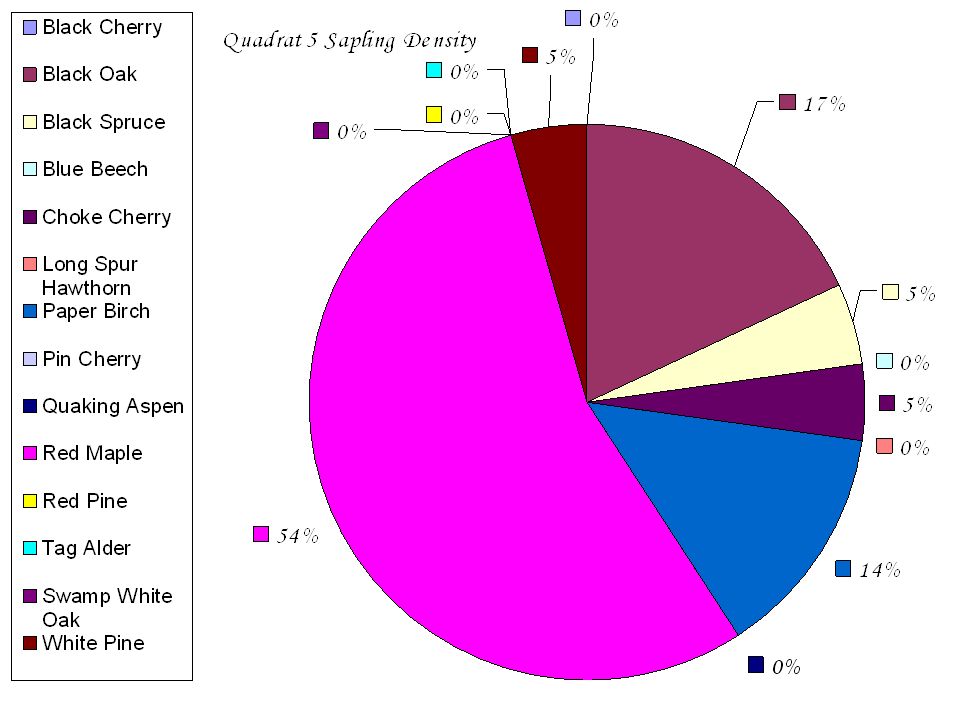
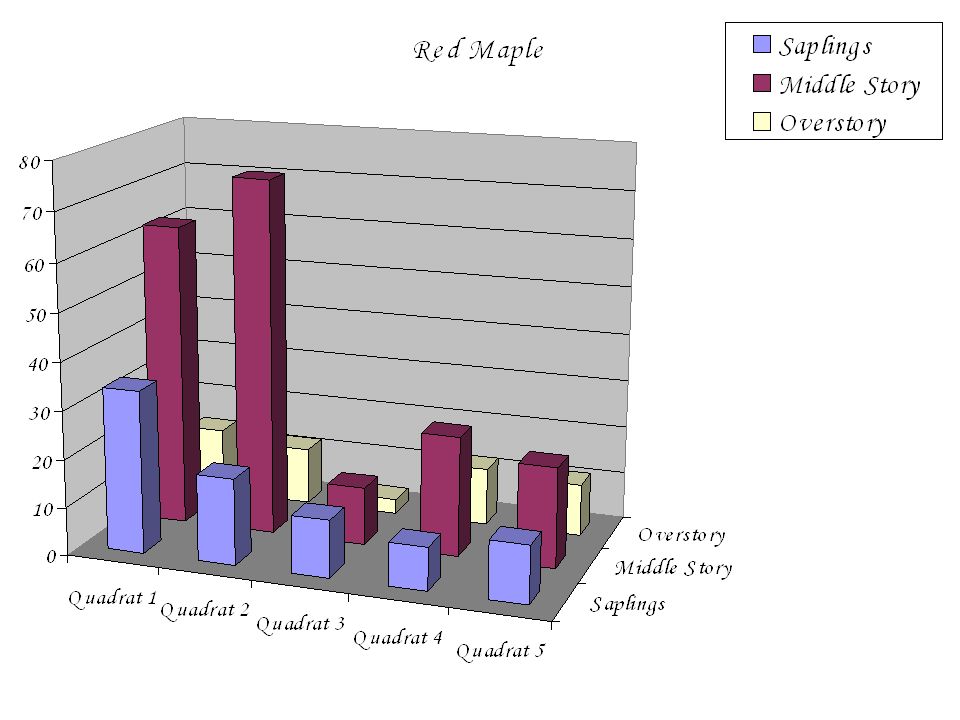
How it was all done 4 Next each tree in each Quadrat was typed into Microsoft Excel 4 From there the data was categorized by: 4 Tree Species 4 Tree density (amount of trees compared with the total amount of trees) 4 Layers (Sapling, Middle Layer, and Overstory 4 Further they were cut into Density Sapling Layer, Density Middle Layer… and so on
 4 Layers (Sapling, Middle Layer, and Overstory 4 Further they were cut into Density Sapling Layer, Density Middle Layer… and so on")
12
How it all got done 4 From those specifications I was able to compare each Quadrat to find my ultimate goal of determining the differences between tree composition and soil type.

17
Analysis at the beginning 4 Then you could ask yourself, like I did: I see all this data but how do I know that they are different and not just a fluke in the soil, trees, or maybe even the researcher?

18
Analysis 4 I went for help and I got some information on how to analyze my data using statistical software.

19
Analysis 4 The research called for an ANOVA (Analysis of Variance) test using two factors without replication. 4 From this point I compared all the data using a 95% confidence level. 4 I crossed Sapling layers of Quadrats with Density percents, Middle Story with Species Variety, and so on and so forth...

21
Interpretation of data 4 Overall there was only one difference between the Quadrats taken and the soil type that the Quadrat was on. That was between the Quadrat 1 and Quadrat 3, 4, and 5. I stream-lined my findings and found that it had occurred in the Middle story of the Quadrats.

22
Conclusions 4 So the different soil types had produced different tree composition, although very slight. There was a difference between the soil types on this small of a soil scale. The soil types had changed only by a couple of degrees of slope, the composition of the soil, and the moisture in the soil.

23
ANY QUESTIONS?

24
Now, Find the Researcher

Similar presentations


 Itzhak Omer and Ran Goldblatt Tel Aviv University, Israel.>")

 Species identification (FOR 219) Defect recognition and determination Quality determination.>")


 Stands in the Central Appalachian Mountains Henri D. Grissino-Mayer¹, Charles W. Lafon²,>")


 Tree measurement (diameters and heights) Defect recognition and determination.>")


