Download presentation
Presentation is loading. Please wait.

1
Sem Physio 9 – Cardiac muscle and the heart as a pump
Prof. dr. Željko Dujić

2
Figure 9-1 Structure of the heart, and course of blood flow through the heart chambers and heart valves. Downloaded from: StudentConsult (on 5 October :26 PM) © 2005 Elsevier 2
 © 2005 Elsevier. 2.")
3
Figure 9-2 "Syncytial," interconnecting nature of cardiac muscle fibers.
Downloaded from: StudentConsult (on 5 October :26 PM) © 2005 Elsevier 3
 © 2005 Elsevier. 3.")
4
Figure 9-5 Mechanisms of excitation-contraction coupling and relaxation in cardiac muscle.
Downloaded from: StudentConsult (on 5 October :26 PM) © 2005 Elsevier 4
 © 2005 Elsevier. 4.")
5
Figure 9-3 Rhythmical action potentials (in millivolts) from a Purkinje fiber and from a ventricular muscle fiber, recorded by means of microelectrodes. Downloaded from: StudentConsult (on 5 October :26 PM) © 2005 Elsevier 5
 © 2005 Elsevier. 5.")
6
Figure 9-4 Force of ventricular heart muscle contraction, showing also duration of the refractory period and relative refractory period, plus the effect of premature contraction. Note that premature contractions do not cause wave summation, as occurs in skeletal muscle. Downloaded from: StudentConsult (on 5 October :26 PM) © 2005 Elsevier 6
 © 2005 Elsevier. 6.")
7
AFTER THE EFFECTIVE OR ABSOLUTE REFRACTORY PERIOD (FAST FIBER)
MV The figure above shows the Absolute Refractory Period (ARP) and Relative Refractory Period (RRP) for a fast fiber. As you can see there is no Post Repolarization Refractoriness in fast fibers. Right at the beginning of phase 4 you can elicit a full blown action potential. All the sodium gates are fully recuperated at this time. If we stimulate during the early RRP, the AP elicited is similar to a slow fiber AP. Do you know why? Think about what happens to the h gates at the membrane potential of the early RRP. Remember the effect of high K+ on the h gates. ARP -80 RRP TIME 7
 and Relative Refractory Period (RRP) for a fast fiber. As you can see there is no Post Repolarization Refractoriness in fast fibers. Right at the beginning of phase 4 you can elicit a full blown action potential. All the sodium gates are fully recuperated at this time. If we stimulate during the early RRP, the AP elicited is similar to a slow fiber AP. Do you know why Think about what happens to the h gates at the membrane potential of the early RRP. Remember the effect of high K+ on the h gates. ARP RRP. TIME. 7.")
8
POST-REPOLARIZATION REFRACTORINESS (SLOW FIBER)
200 MSEC C B mV A The figure above shows a slow fiber action potential and the effects of Post Repolarization Refractoriness(PRR). There’s a 200msec delay from the onset of phase 4 to the time in which the fiber will respond again with a complete AP similar to the preceding one in amplitude. A and B are responses elicited by stimulation during the period of PRR. It is clear that during this period the fiber will respond with less than maximun capacity and conduction of these responses will be slower than that of a full response. See page 27 B&L. -60 POSTREPO TIME 8
. There’s a 200msec delay from the onset of phase 4 to the time in which the fiber will respond again with a complete AP similar to the preceding one in amplitude. A and B are responses elicited by stimulation during the period of PRR. It is clear that during this period the fiber will respond with less than maximun capacity and conduction of these responses will be slower than that of a full response. See page 27 B&L POSTREPO. TIME. 8.")
9
Figure 9-6 Events of the cardiac cycle for left ventricular function, showing changes in left atrial pressure, left ventricular pressure, aortic pressure, ventricular volume, the electrocardiogram, and the phonocardiogram. Downloaded from: StudentConsult (on 5 October :26 PM) © 2005 Elsevier 9
 © 2005 Elsevier. 9.")
10
- End diastolic volume, end systolic volume, stroke volume, ejection fraction
- A-V valves and the function of papillary muscles - Aortic and pulmonary artery valves (rapid closure, high velocity of blood flow through the valves, large mechanical load)
")
11
Figure 9-7 Mitral and aortic valves (the left ventricular valves).
Downloaded from: StudentConsult (on 5 October :26 PM) © 2005 Elsevier 11
 © 2005 Elsevier. 11.")
12
- Cardiac work: external work (moving the blood from low pressure to high pressure compartments) and kinetic energy of blood flow component (usually lower that 1% for left ventricle). Kinetic work is high in pulmonary/aortic stenosis (up to 50%). - Oxygen consumption at rest – 75% of local reserves on Hb, during work fresh blood serves to replenish myocardial oxygen demands

13
Figure 9-8 Relationship between left ventricular volume and intraventricular pressure during diastole and systole. Also shown by the heavy red lines is the "volume-pressure diagram," demonstrating changes in intraventricular volume and pressure during the normal cardiac cycle. EW, net external work. Downloaded from: StudentConsult (on 5 October :26 PM) © 2005 Elsevier 13
 © 2005 Elsevier. 13.")
14
Figure 9-9 The "volume-pressure diagram" demonstrating changes in intraventricular volume and pressure during a single cardiac cycle (red line). The tan shaded area represents the net external work (EW) output by the left ventricle during the cardiac cycle. Downloaded from: StudentConsult (on 5 October :26 PM) © 2005 Elsevier 14
 © 2005 Elsevier. 14.")
15
- External work (shaded area of the pressure-volume curve)
- Potential energy - Preload and afterload - Energetic sources in heart: fats, laktate, glucose

16
PRELOAD AND AFTERLOAD IN THE HEART
INCREASE IN FILLING PRESSURE=INCREASED PRELOAD PRELOAD REFERS TO END DIASTOLIC VOLUME. AFTERLOAD IS THE AORTIC PRESSURE DURING THE EJECTION PERIOD/AORTIC VALVE OPENING. A preloaded muscle is one in which some tension has been applied before the muscle performs any work. In the case of the heart this tension is provided by the End Diastolic Volume (EDV). Afterload refers to the load that the preloaded muscle has to work against. In the heart it refers to the aortic pressure present just at the instant that the aortic valve opens. Thus, the higher the aortic diastolic pressure, the more work the heart has to perform to pump blood into it. A higher aortic pressure means more afterload. Afterload is also defined as the Ventricular Wall Stress that develops during systolic ejection. It can be estimated using Laplace’s Law: VWS = Pressure x radius / 2 (wall thickness) The pressure can be estimated from arterial systolic pressure. In heart failure the dilated heart increases its thickness to reduce wall stress. This is a compensatory measure. 16
. Afterload refers to the load that the preloaded muscle has to work against. In the heart it refers to the aortic pressure present just at the instant that the aortic valve opens. Thus, the higher the aortic diastolic pressure, the more work the heart has to perform to pump blood into it. A higher aortic pressure means more afterload. Afterload is also defined as the Ventricular Wall Stress that develops during systolic ejection. It can be estimated using Laplace’s Law: VWS = Pressure x radius / 2 (wall thickness) The pressure can be estimated from arterial systolic pressure. In heart failure the dilated heart increases its thickness to reduce wall stress. This is a compensatory measure. 16.")
17
- Efficiency of cardiac contraction 25%
- Frank-Starling’s law - Bainbridge effect (increase in heart rate) - Importance of pericardium (limits heart expansion acutely)
 - Importance of pericardium (limits heart expansion acutely)")
18
LENGHT/ TENSION AND THE FRANK-STARLING RELATION
Systole LEFT VENTRICULAR PRESSURE The relationship above was studied more than 100 years ago by Drs. Frank and Starling in the UK. It is a classical study in cardiovascular physiology and the concept, called Starling’s Law of the Heart, still stands today though much better understood. Now, read your axes carefully. The x axis shows either the volume of blood in the left ventricle at the end of diastole when the ventricle is full. At this point the cardiac myocites are stretched to a certain length so we can also place in this axis the initial myocardial fiber length. Either one will do. The Y axis depicts ventricular pressure. This is the pressure generated by the contraction of the ventricle(upper curve) or by the mere presence of a volume in the ventricle(lower curve). This pressure is, at the same time, a measure of contractile force(upper curve). Now, look at the lower curve again. It shows the pressure inside the ventricle as a function of either initial fiber length or end diastolic volume. This is a passive pressure generated by the volume inside a ventricle that is not contracting. The upper curve shows what happens when the ventricle contracts at different levels of end diastolic volume (EDV). As you can see, there is a specific EDV at which the ventricular pressure generated is maximal. This EDV corresponds to a certain initial fiber length. In other words, at this initial myocardial fiber length the heart contracts with maximum force and generates the greatest pressure. This is the length tension relationship for the heart muscle and it has major clinical implications. Diastole INITIAL MYOCARDIAL FIBER LENGHT LEFT VENTRICULAR END-DIASTOLIC VOLUME 18
 or by the mere presence of a volume in the ventricle(lower curve). This pressure is, at the same time, a measure of contractile force(upper curve). Now, look at the lower curve again. It shows the pressure inside the ventricle as a function of either initial fiber length or end diastolic volume. This is a passive pressure generated by the volume inside a ventricle that is not contracting. The upper curve shows what happens when the ventricle contracts at different levels of end diastolic volume (EDV). As you can see, there is a specific EDV at which the ventricular pressure generated is maximal. This EDV corresponds to a certain initial fiber length. In other words, at this initial myocardial fiber length the heart contracts with maximum force and generates the greatest pressure. This is the length tension relationship for the heart muscle and it has major clinical implications. Diastole. INITIAL MYOCARDIAL FIBER LENGHT. LEFT VENTRICULAR END-DIASTOLIC VOLUME. 18.")
20
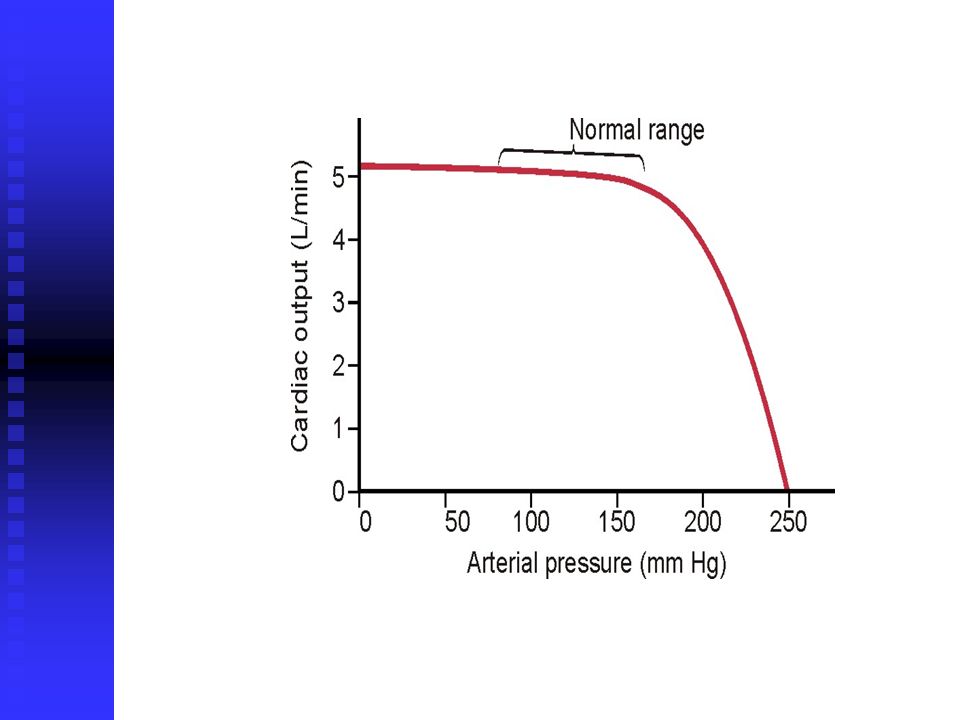
- Arterial pressure (under normal range) in aorta does not affect cardiac output
- Increased atrial pressure increases ventricular volume and the contractility (Frank Starling law) - Right ventricle is more compliant (larger changes in volume per unit of filling pressure)
 - Right ventricle is more compliant (larger changes in volume per unit of filling pressure)")
21
Figure 9-10 Left and right ventricular function curves recorded from dogs, depicting ventricular stroke work output as a function of left and right mean atrial pressures. (Curves reconstructed from data in Sarnoff SJ: Myocardial contractility as described by ventricular function curves. Physiol Rev 35:107, 1955.) Downloaded from: StudentConsult (on 5 October :26 PM) © 2005 Elsevier 21
 © 2005 Elsevier. 21.")
22
Figure 9-11 Approximate normal right and left ventricular volume output curves for the normal resting human heart as extrapolated from data obtained in dogs and data from human beings. Downloaded from: StudentConsult (on 5 October :26 PM) © 2005 Elsevier 22
 © 2005 Elsevier. 22.")
25
Figure 9-13 Effect on the cardiac output curve of different degrees of sympathetic or parasympathetic stimulation. Downloaded from: StudentConsult (on 5 October :26 PM) © 2005 Elsevier 25
 © 2005 Elsevier. 25.")
26
- Calcium effects: spastic contraction
- Potassium effects: high potassium causes dilatation and weakening of the heart and block in conduction through AV node - Temperature effects: moderate increase stimulates heart’s contractility

Similar presentations


 Myocardiocytes The Heart.>")
 –Contracts.>")


