Download presentation
Presentation is loading. Please wait.

1
Making Wisconsin the Healthiest State David Kindig Bridget Booske Patrick Remington UW Population Health Institute University of Wisconsin School of Medicine and Public Health

2
Purpose Review progress to date Get feedback and advice Ultimately, provide a resource for the state and for communities

3
Three Questions: How healthy are we? What are the drivers of health? What works?

4
How healthy are we?

5
How good?How fair? How healthy are we?

7
Wisconsin Working-Age Adult Mortality Rates (Ages 25-64, rates per 100,000 population) ABCDFABCDF Some college (212) College graduates (188) Whites (279) Women (225) Suburban (247) Non-urban (275) Rural (319) Men (367) Milwaukee County (424) High school or less (459) Native Americans (592) African Americans (624) Worst state Mississippi (519) Wisconsin (296) Best state Minnesota (257) Asians (170)
 ABCDFABCDF Some college (212) College graduates (188) Whites (279) Women (225) Suburban (247) Non-urban (275) Rural (319) Men (367) Milwaukee County (424) High school or less (459) Native Americans (592) African Americans (624) Worst state Mississippi (519) Wisconsin (296) Best state Minnesota (257) Asians (170)")
8
Wisconsin Working-Age Adult Mortality Rates (Ages 25-64, rates per 100,000 population) ABCDFABCDF Some college (212) College graduates (188) Whites (279) Women (225) Suburban (247) Non-urban (275) Rural (319) Men (367) Milwaukee County (424) Native Americans (592) African Americans (624) Worst state Mississippi (519) Best state Minnesota (257) Asians (170) High school or less (459) (212) Wisconsin (296) (206)
 ABCDFABCDF Some college (212) College graduates (188) Whites (279) Women (225) Suburban (247) Non-urban (275) Rural (319) Men (367) Milwaukee County (424) Native Americans (592) African Americans (624) Worst state Mississippi (519) Best state Minnesota (257) Asians (170) High school or less (459) (212) Wisconsin (296) (206)")
14
Mortality burden: excess deaths Age group County with Best Rate Best rate (deaths per 100,000) Excess deaths (annual) < 1 yearWood346230 1-14 yearsWaukesha12105 15-24 yearsEau Claire39261 25-34 yearsWaukesha53232 35-44 yearsCalumet91541 45-54 yearsWashington229817 55-64 yearsWaukesha6361070 65-74 yearsPepin18241526 All ages--4782
 Excess deaths (annual) < 1 yearWood yearsWaukesha yearsEau Claire yearsWaukesha yearsCalumet yearsWashington yearsWaukesha yearsPepin All ages--4782")
15
*Dots are randomly placed within the county to which they are assigned. Annual excess deaths in Wisconsin Total deaths = 4,782 1 dot = 1 excess death

16
*Dots are randomly placed within the county to which they are assigned. Annual excess deaths in Wisconsin Total deaths = 4,782 City = 1330 Rest of county = 320 1 dot = 1 excess death

17
Major Finding: Considerable excess mortality exists throughout Wisconsin The City of Milwaukee has about 28% of Wisconsin’s excess mortality

18
How healthy are we? Wisconsin’s health overall is good (not perfect) But the distribution of health is not fair, by: –geography –education –race/ethnicity
 But the distribution of health is not fair, by: –geography –education –race/ethnicity.")
19
What are the drivers of health?

21
What works?

22
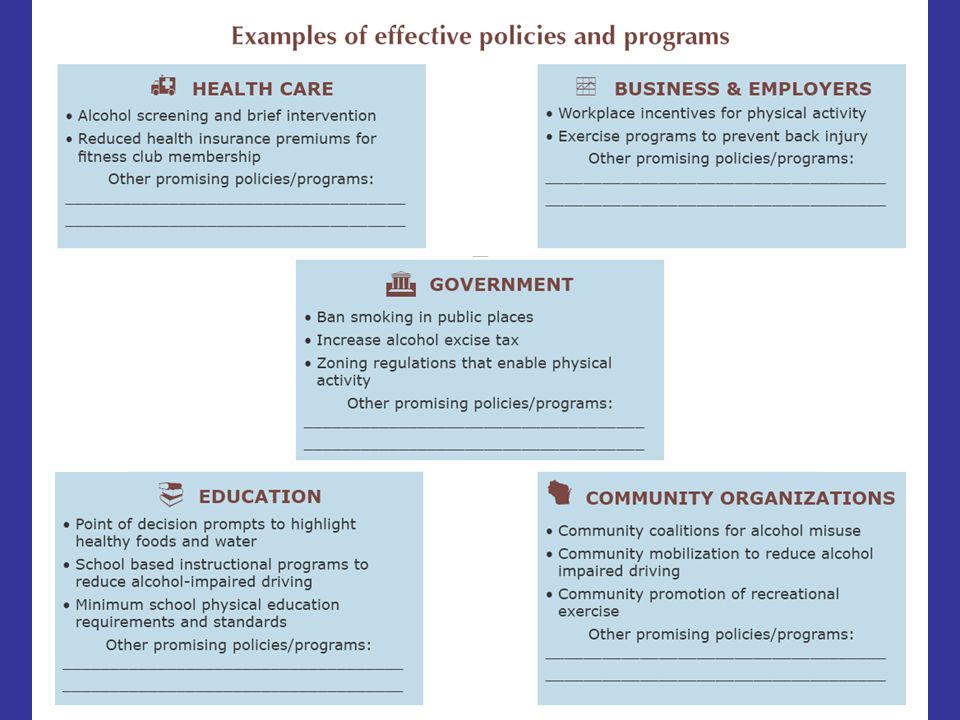
What Works: Policies and Programs to Improve Wisconsin’s Health For each of the drivers of health, we identified potential policies and programs that could improve the driver For each policy and program, we performed a wide information scan to identify: –Intended beneficial outcomes –Level of implementation in Wisconsin & other states –Strength of evidence of effectiveness, and –In some limited cases where information was available: the likely impact on disparities

23
In addition, for each policy and program, we – estimated potential population reach – identified potential decision makers and – attempted to determine likely impact on disparities We contacted content experts from academia, government, and the community who reviewed and commented on the evidence summaries We developed a database containing over 360 potential policies and programs, with links to references on evidence of effectiveness What Works: Policies and Programs to Improve Wisconsin’s Health (cont)
")
24
What works?

25
Add community and practice perspectives on evidence: move from what might work to what really will work in practice Identify gaps between research- and practice-based evidence Next Steps

27
Challenges for this process “Top down” versus “bottom up” evidence Evidence on reducing disparities is very limited…which ones might increase disparities? No discussion of feasibility, unintended consequences, or multiple benefits Much less information on cost- effectiveness ($$/QALY) than effectiveness
 than effectiveness.")
28
Reduced disease, injury, and disability Healthy, safe, and resilient communities, families, and individuals Effective systems and policies aligned for better health Improved health across lifespan Improved health equity Healthy Wisconsin 2020 Framework

29
Acknowledgments Former Secretary, Helene Nelson Anna Graupner, and other graduate students The Department of Health Services The reviewers of the drafts of evidence tables Today’s experts and facilitators The Wisconsin Partnership Program University of Wisconsin School of Medicine and Public Health

30
Dialogue on Key Strategies Track A: Improving our health behaviors –Room E: Physical activity, nutrition, and obesity –Room F: Alcohol use and addiction Track B: Mix of prevention and treatment –Room G: Health care quality and costs –Room H: Public health improvement across sectors Track C: Healthier social and economic climate –Room I: Children born healthy with a healthy start –Room J: Working together to improve rural health

Similar presentations


 length of life and 2)>")


Women generally need more health care than men because.>")


